| Param | Original file | Final file |
|---|---|---|
| Filename | modeM0/AS1A13_072T01_9000006008_44662cztM0_level2.fits | modeM0/AS1A13_072T01_9000006008_44662cztM0_level2_quad_clean.evt |
| Size (bytes) | 434,926,080 | 110,615,040 |
| Size | 414.8 MB | 105.5 MB |
| Events in quadrant A | 5,190,319 | 736,882 |
| Events in quadrant B | 3,329,304 | 775,660 |
| Events in quadrant C | 3,122,180 | 739,278 |
| Events in quadrant D | 3,964,104 | 654,247 |
| Mode M0 | |||
|---|---|---|---|
| Quadrant | BADHDUFLAG | Total packets | Discarded packets |
| A | 0 | 20628 | 2 |
| B | 0 | 14252 | 2 |
| C | 0 | 13819 | 2 |
| D | 0 | 16296 | 2 |
| Mode SS | |||
|---|---|---|---|
| Quadrant | BADHDUFLAG | Total packets | Discarded packets |
| A | 0 | 130 | 0 |
| B | 0 | 130 | 0 |
| C | 0 | 130 | 0 |
| D | 0 | 130 | 0 |
| Mode M9 | |||
|---|---|---|---|
| Quadrant | BADHDUFLAG | Total packets | Discarded packets |
| A | 0 | 17 | 0 |
| B | 0 | 18 | 0 |
| C | 0 | 18 | 0 |
| D | 0 | 18 | 0 |
| Quadrant | Total seconds | Saturated seconds | Saturation percentage |
|---|---|---|---|
| A | 6354 | 164 | 2.581051% |
| B | 6354 | 97 | 1.526597% |
| C | 6354 | 52 | 0.818382% |
| D | 6354 | 214 | 3.367957% |
Noise dominated data is calculated using 1-second bins in cleaned event files. If a bin has >2000 counts, and if more than 50% of those come from <1% of pixels, then it is considered to be noise-dominated and hence unusable.
| Quadrant | # 1 sec bins | Bins with >0 counts | Bins with >2000 counts | High rate bins dominated by noise | Noise dominated (total time) | Noise dominated (detector-on time) | Marked lightcurve |
|---|---|---|---|---|---|---|---|
| A | 7599 | 6355 | 30 | 30 | 0.39% | 0.47% | 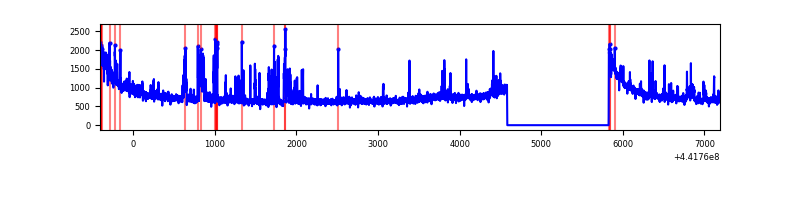 |
| B | 7599 | 6355 | 32 | 32 | 0.42% | 0.50% | 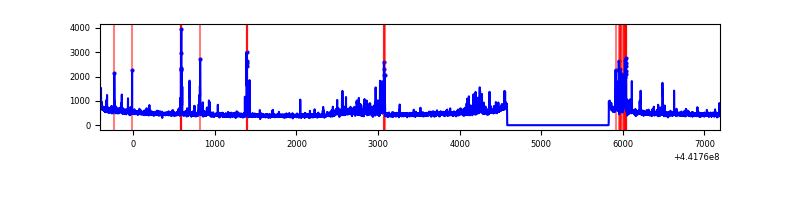 |
| C | 7599 | 6355 | 26 | 26 | 0.34% | 0.41% | 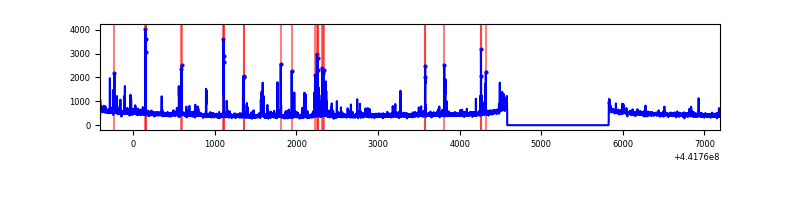 |
| D | 7599 | 6355 | 144 | 144 | 1.89% | 2.27% | 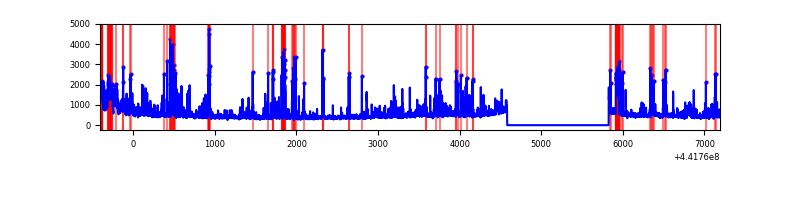 |
Top three noisy pixels from each quadrant. If the there are fewer than three noisy pixels in the level2.evt file, extra rows are filled as -1
| Pixel properties | Quadrant properties | ||||||
|---|---|---|---|---|---|---|---|
| Quadrant | DetID | PixID | Counts | Sigma | Mean | Median | Sigma |
| A | 10 | 83 | 1929139 | 13065.33 | 717 | 702 | 147.6 |
| A | 15 | 223 | 314057 | 2123.01 | 717 | 702 | 147.6 |
| A | 13 | 248 | 72188 | 484.32 | 717 | 702 | 147.6 |
| B | 0 | 246 | 128814 | 904.03 | 727 | 705 | 141.7 |
| B | 0 | 189 | 122187 | 857.27 | 727 | 705 | 141.7 |
| B | 5 | 172 | 72709 | 508.11 | 727 | 705 | 141.7 |
| C | 14 | 254 | 286059 | 1715.51 | 713 | 718 | 166.3 |
| C | 12 | 2 | 32353 | 190.19 | 713 | 718 | 166.3 |
| C | 3 | 233 | 12452 | 70.55 | 713 | 718 | 166.3 |
| D | 1 | 52 | 691055 | 3971.35 | 695 | 673 | 173.8 |
| D | 2 | 249 | 186414 | 1068.46 | 695 | 673 | 173.8 |
| D | 13 | 249 | 159867 | 915.75 | 695 | 673 | 173.8 |
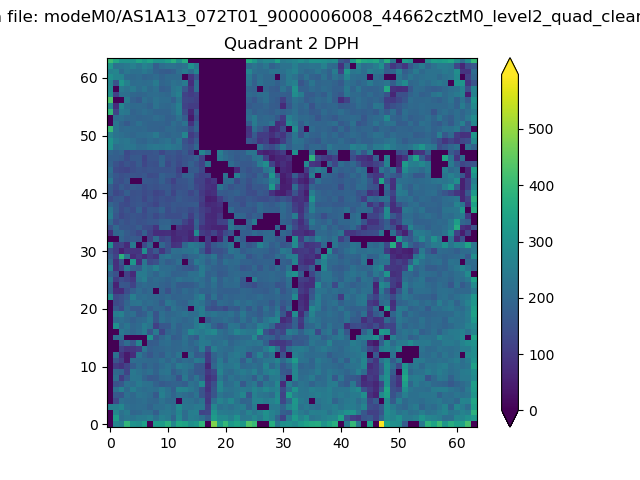
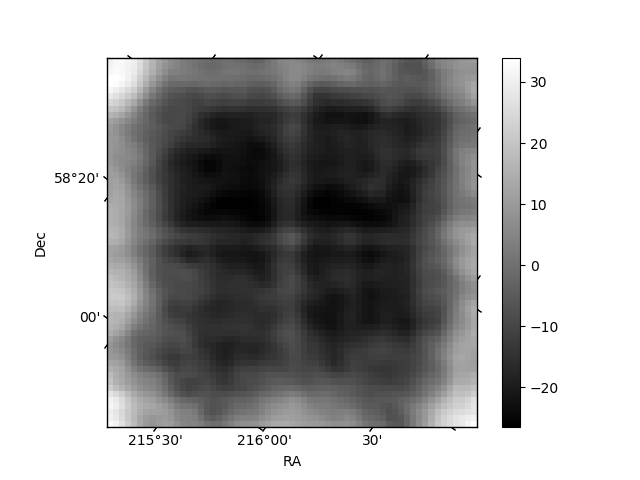
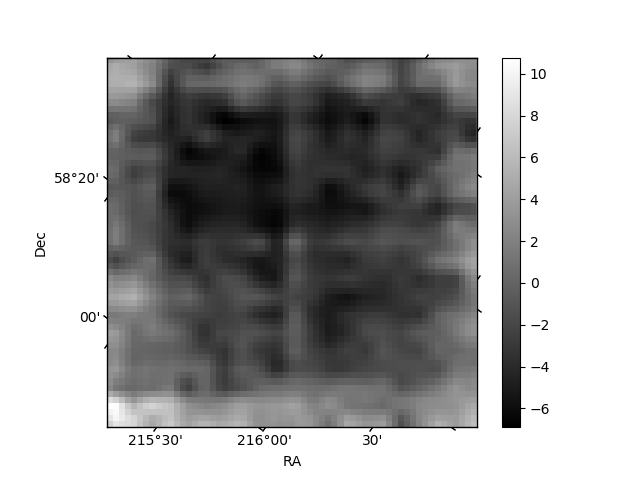
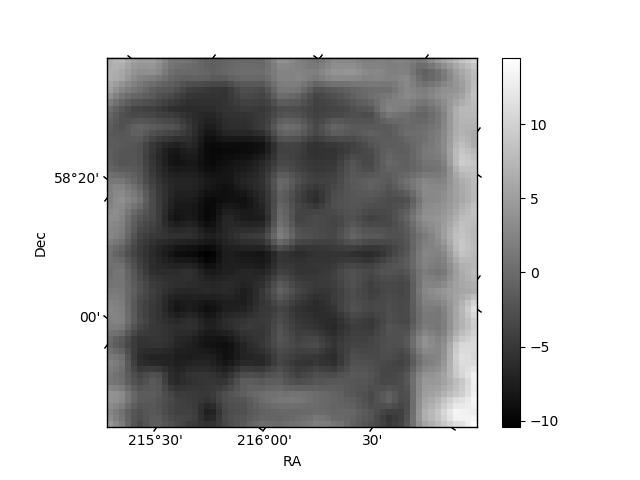
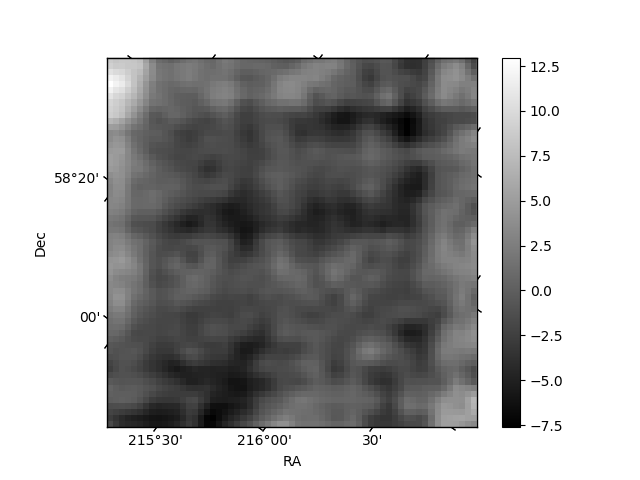
Histogram calculated using DETX and DETY for each event in the final _common_clean file
| Quadrant A | 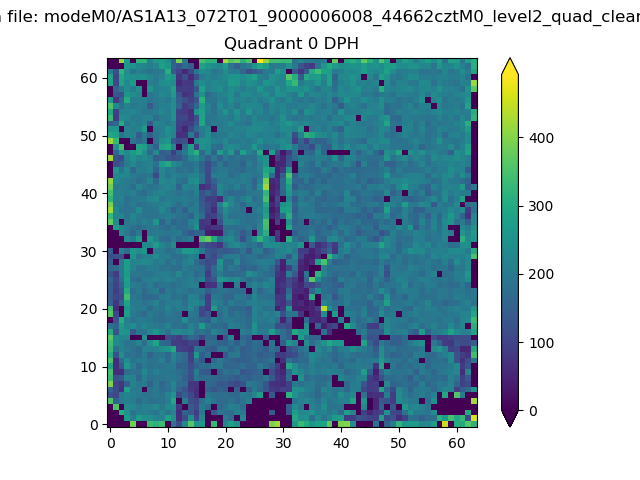 |
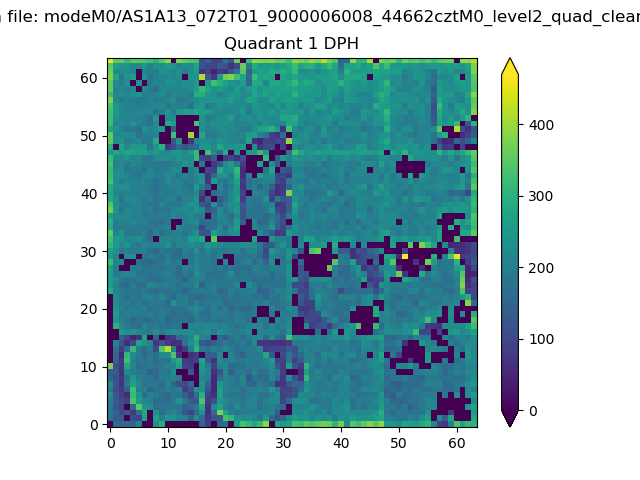 |
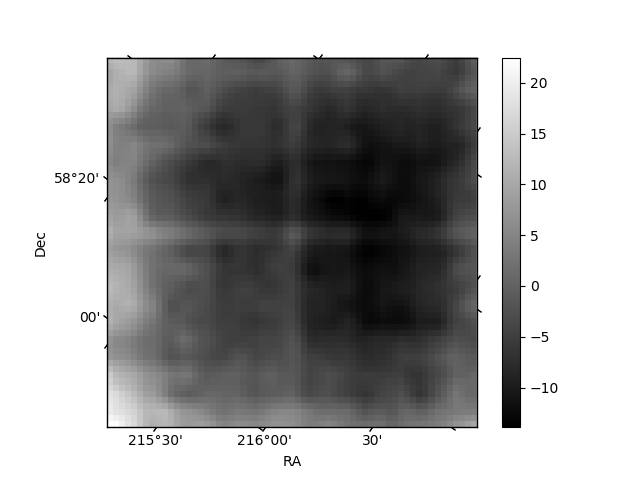
Quadrant B |
|---|---|---|---|
| Quadrant D | 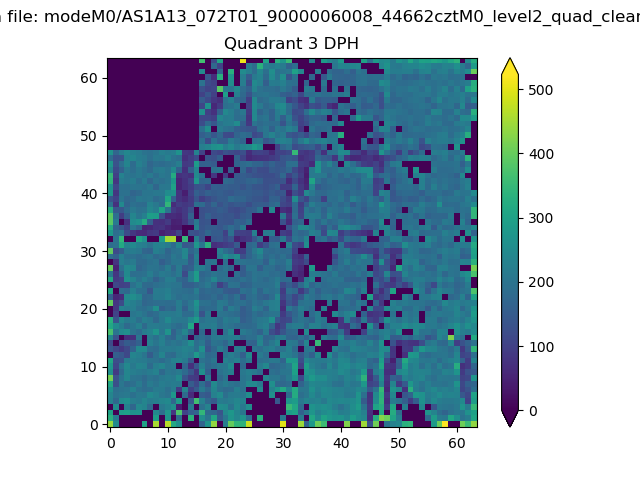 |
 |
Quadrant C |
| Plot type | Count rate plots | Images |
|---|---|---|
| Comparison with Poisson distribution Blue bars denote a histogram of data divided into 1 sec bins. Red curve is a Poisson curve with rate = median count rate of data. |
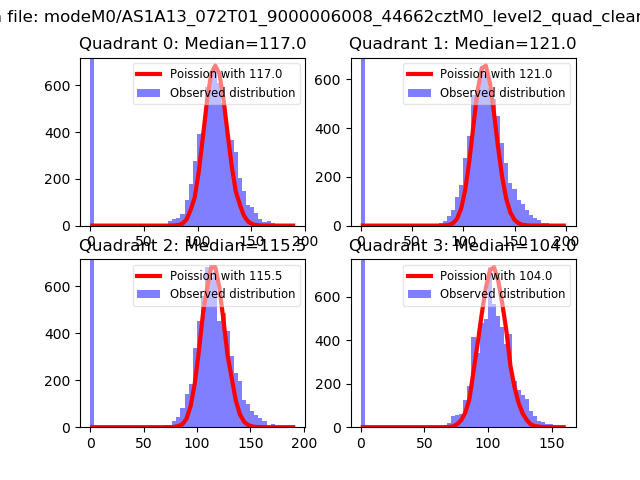 |
 |
| Quadrant-wise count rates Data is divided into 100 sec bins |
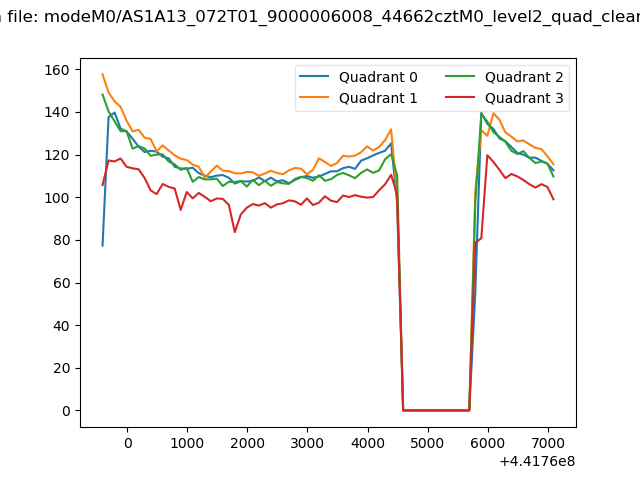 |
|
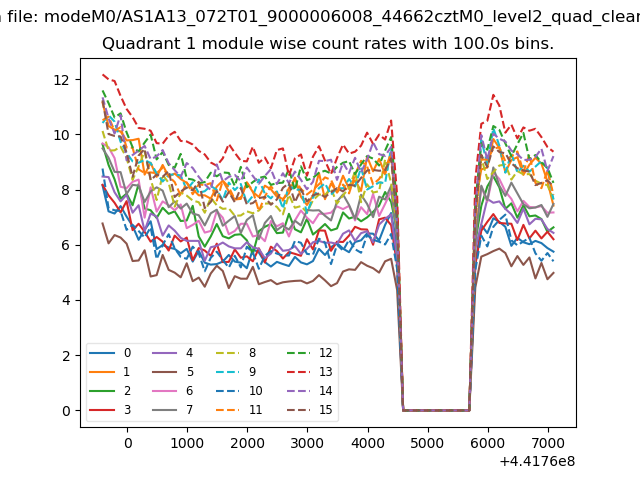
| Module-wise count rates for Quadrant A Data is divided into 100 sec bins |
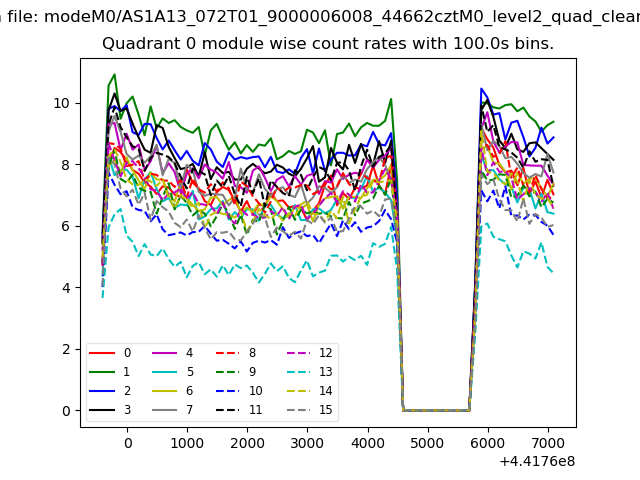 |
 |
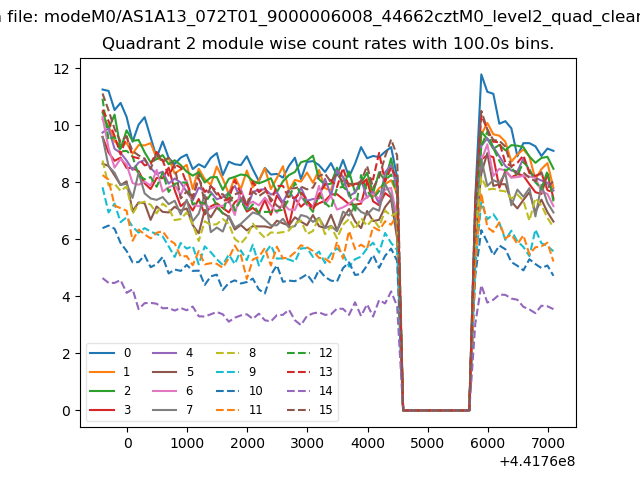
| Module-wise count rates for Quadrant B Data is divided into 100 sec bins |
 |
 |
| Module-wise count rates for Quadrant C Data is divided into 100 sec bins |
 |
 |
| Module-wise count rates for Quadrant D Data is divided into 100 sec bins |
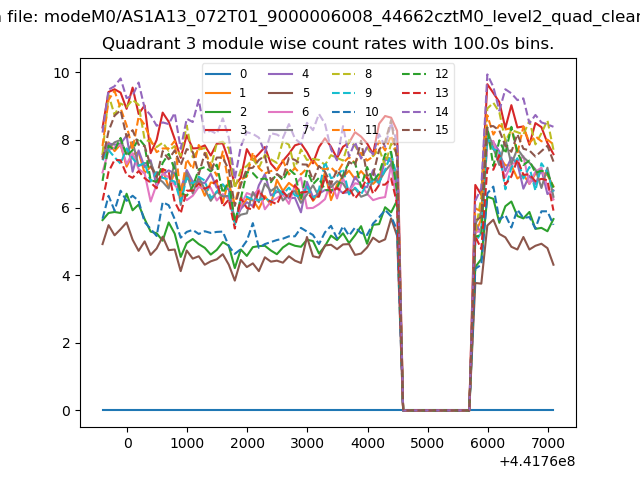 |
 |
| Parameter | Plot |
|---|---|
| CZT HV Monitor | 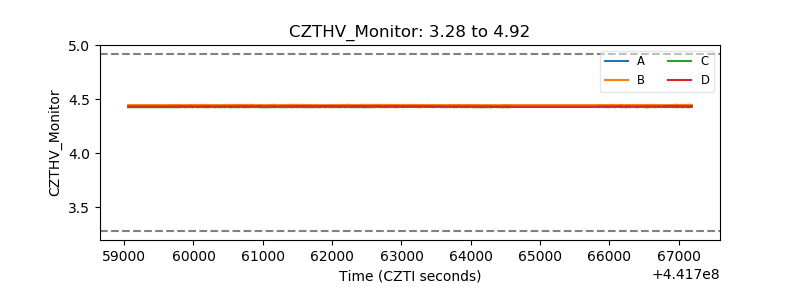 |
| D_VDD | 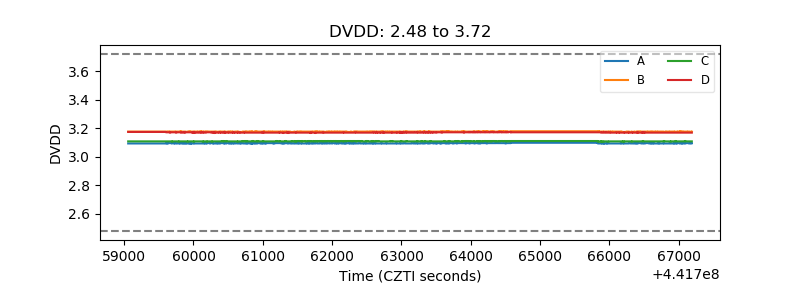 |
| Temperature 1 | 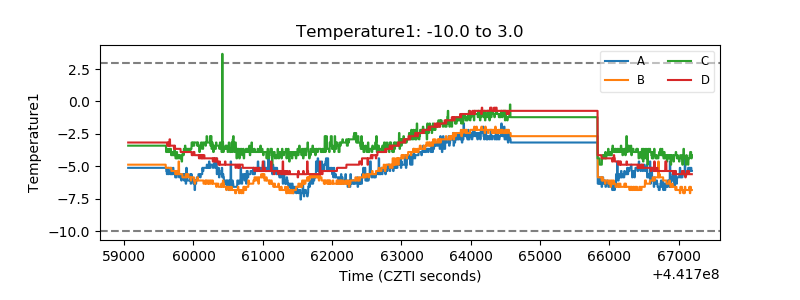 |
| Veto HV Monitor | 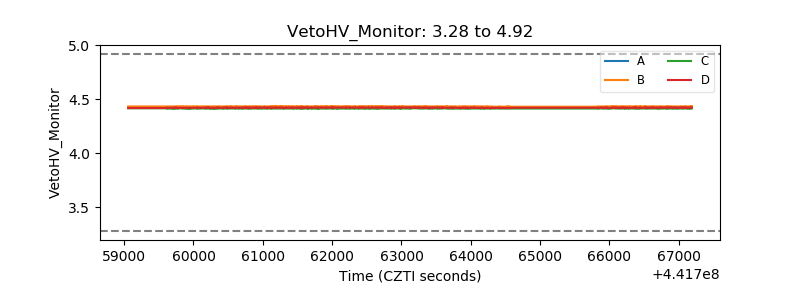 |
| Veto LLD | 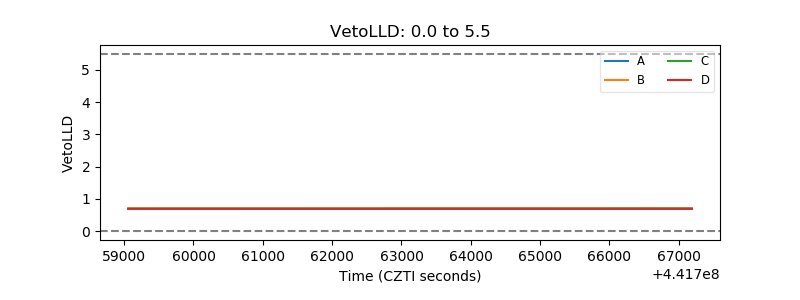 |
| Alpha Counter | 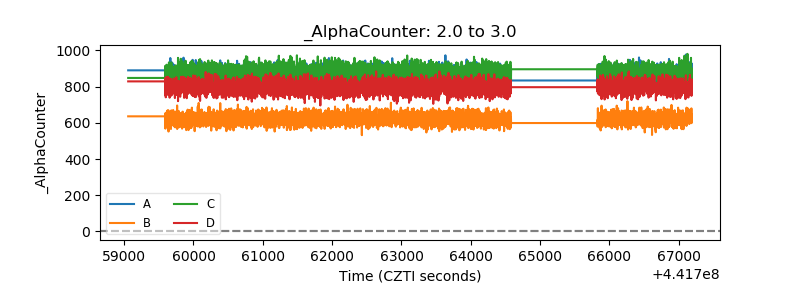 |
| _CPM_Rate | 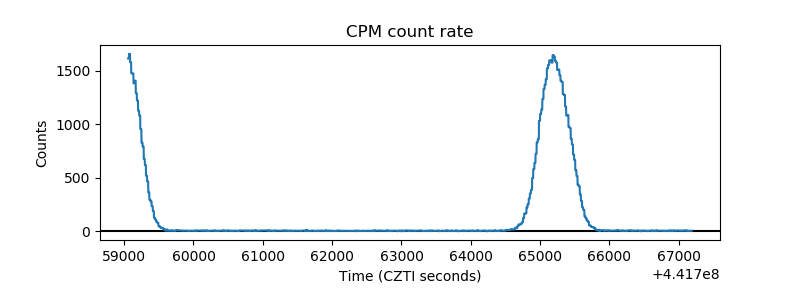 |
| CZT Counter | 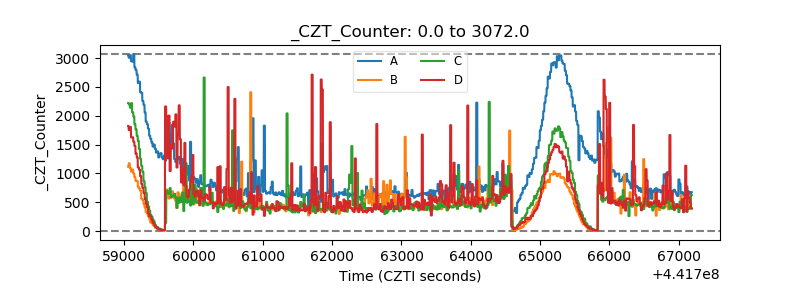 |
| +2.5 Volts monitor | 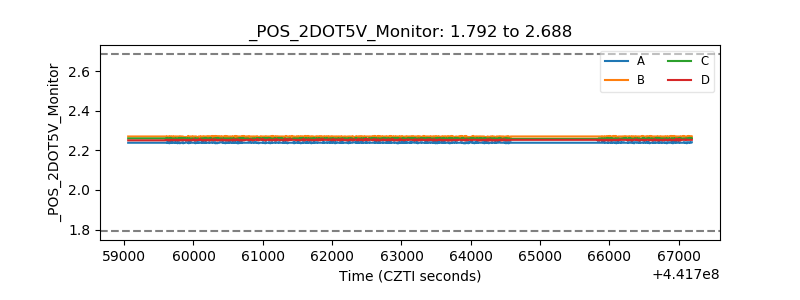 |
| +5 Volts monitor | 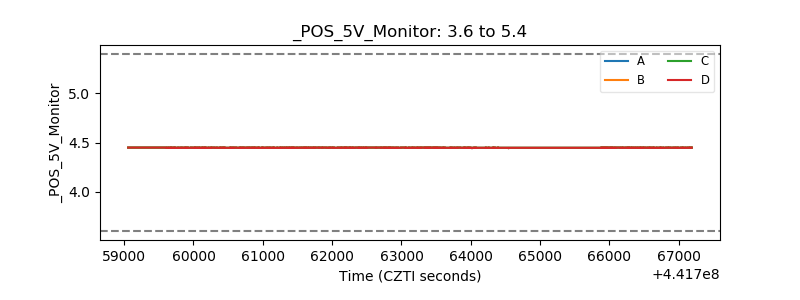 |
| _ROLL_ROT | 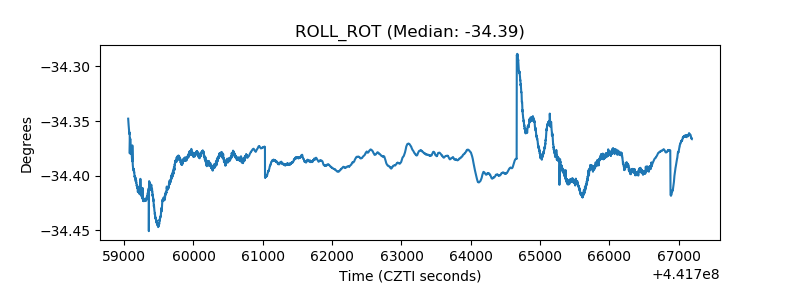 |
| _Roll_DEC | 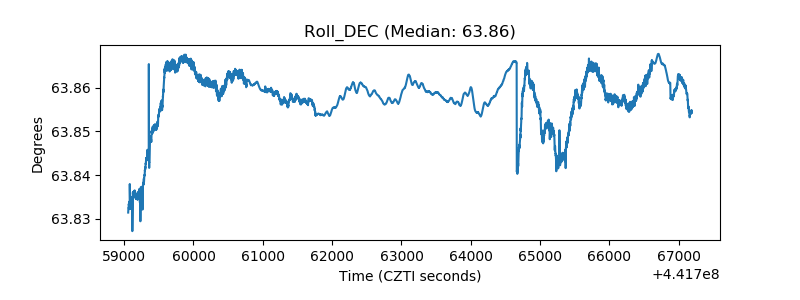 |
| _Roll_RA | 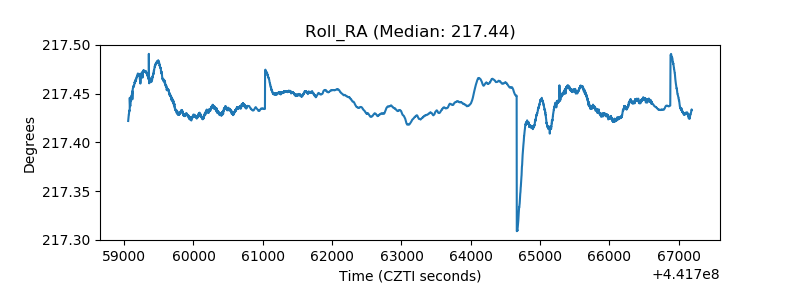 |
| Veto Counter | 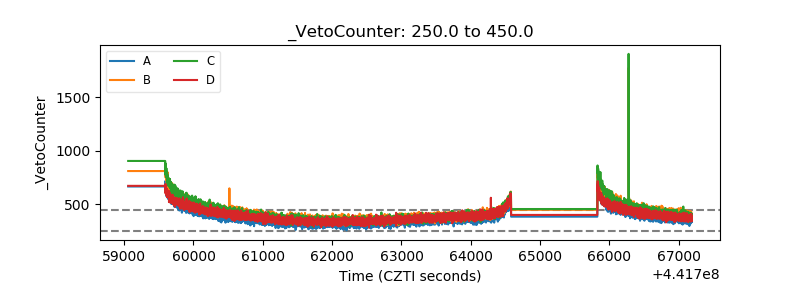 |