| Param | Original file | Final file |
|---|---|---|
| Filename | modeM0/AS1A13_072T01_9000006008_44663cztM0_level2.fits | modeM0/AS1A13_072T01_9000006008_44663cztM0_level2_quad_clean.evt |
| Size (bytes) | 445,821,120 | 109,748,160 |
| Size | 425.2 MB | 104.7 MB |
| Events in quadrant A | 4,994,327 | 733,592 |
| Events in quadrant B | 3,354,534 | 773,426 |
| Events in quadrant C | 2,931,739 | 734,391 |
| Events in quadrant D | 4,726,075 | 636,172 |
| Mode M0 | |||
|---|---|---|---|
| Quadrant | BADHDUFLAG | Total packets | Discarded packets |
| A | 0 | 20047 | 2 |
| B | 0 | 14409 | 2 |
| C | 0 | 13367 | 2 |
| D | 0 | 18568 | 2 |
| Mode SS | |||
|---|---|---|---|
| Quadrant | BADHDUFLAG | Total packets | Discarded packets |
| A | 0 | 130 | 0 |
| B | 0 | 130 | 0 |
| C | 0 | 130 | 0 |
| D | 0 | 130 | 0 |
| Mode M9 | |||
|---|---|---|---|
| Quadrant | BADHDUFLAG | Total packets | Discarded packets |
| A | 0 | 21 | 0 |
| B | 0 | 22 | 0 |
| C | 0 | 22 | 0 |
| D | 0 | 22 | 0 |
| Quadrant | Total seconds | Saturated seconds | Saturation percentage |
|---|---|---|---|
| A | 6388 | 157 | 2.457733% |
| B | 6388 | 110 | 1.721979% |
| C | 6388 | 19 | 0.297433% |
| D | 6388 | 369 | 5.776456% |
Noise dominated data is calculated using 1-second bins in cleaned event files. If a bin has >2000 counts, and if more than 50% of those come from <1% of pixels, then it is considered to be noise-dominated and hence unusable.
| Quadrant | # 1 sec bins | Bins with >0 counts | Bins with >2000 counts | High rate bins dominated by noise | Noise dominated (total time) | Noise dominated (detector-on time) | Marked lightcurve |
|---|---|---|---|---|---|---|---|
| A | 7563 | 6389 | 10 | 10 | 0.13% | 0.16% | 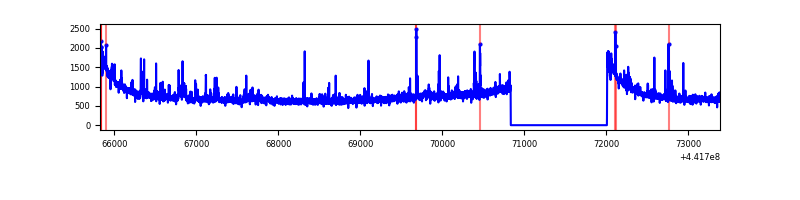 |
| B | 7563 | 6389 | 30 | 30 | 0.40% | 0.47% | 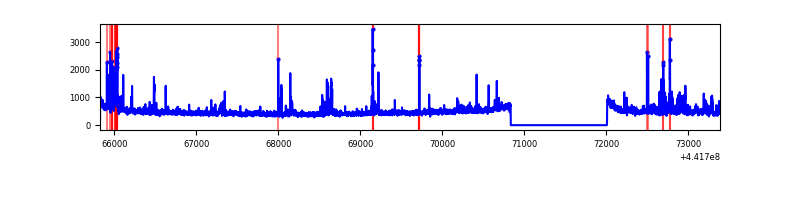 |
| C | 7563 | 6389 | 9 | 9 | 0.12% | 0.14% | 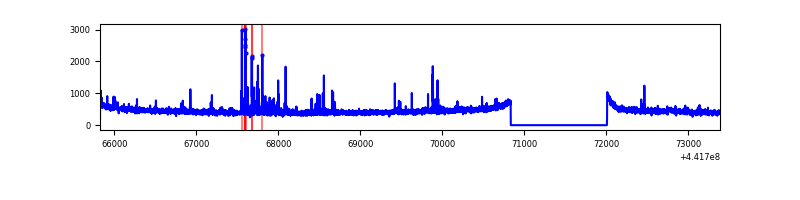 |
| D | 7563 | 6389 | 315 | 315 | 4.17% | 4.93% | 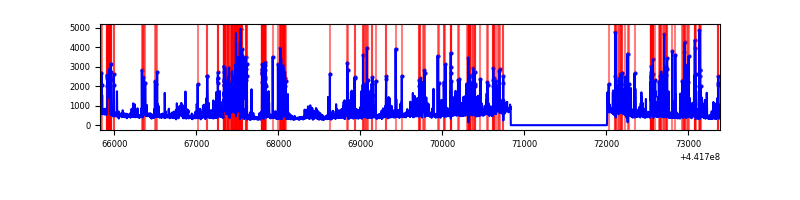 |
Top three noisy pixels from each quadrant. If the there are fewer than three noisy pixels in the level2.evt file, extra rows are filled as -1
| Pixel properties | Quadrant properties | ||||||
|---|---|---|---|---|---|---|---|
| Quadrant | DetID | PixID | Counts | Sigma | Mean | Median | Sigma |
| A | 10 | 83 | 1956356 | 13109.87 | 720 | 705 | 149.2 |
| A | 2 | 79 | 125173 | 834.38 | 720 | 705 | 149.2 |
| A | 13 | 248 | 58102 | 384.77 | 720 | 705 | 149.2 |
| B | 0 | 183 | 168060 | 1189.45 | 727 | 706 | 140.7 |
| B | 0 | 189 | 111496 | 787.43 | 727 | 706 | 140.7 |
| B | 5 | 172 | 90725 | 639.8 | 727 | 706 | 140.7 |
| C | 14 | 254 | 76874 | 461.83 | 708 | 712 | 164.9 |
| C | 12 | 2 | 53950 | 322.83 | 708 | 712 | 164.9 |
| C | 12 | 250 | 16810 | 97.62 | 708 | 712 | 164.9 |
| D | 1 | 52 | 865291 | 5047.93 | 685 | 663 | 171.3 |
| D | 13 | 249 | 727069 | 4240.96 | 685 | 663 | 171.3 |
| D | 2 | 249 | 244914 | 1426.0 | 685 | 663 | 171.3 |
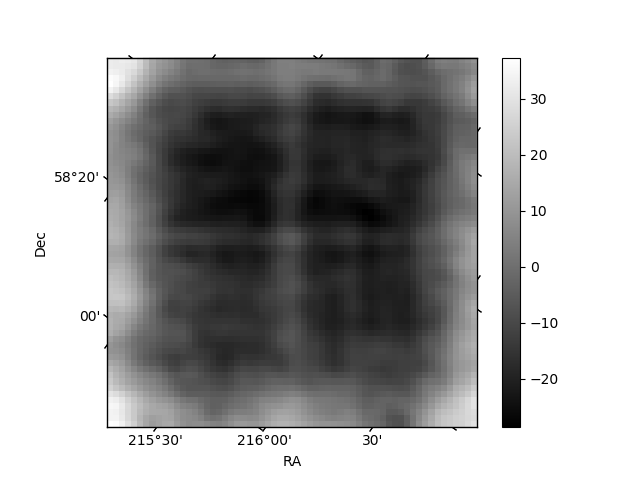
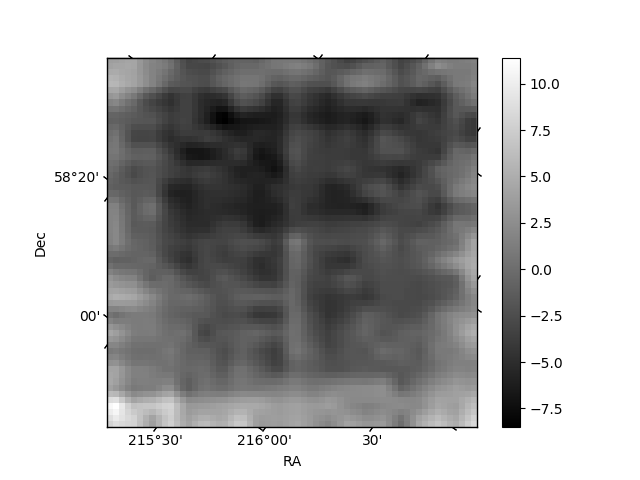
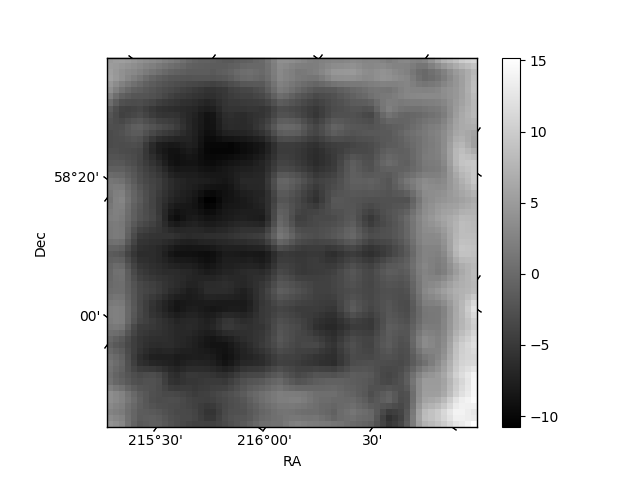
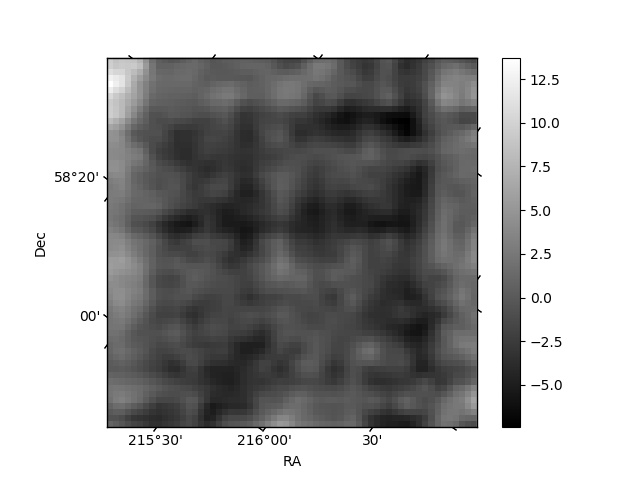
Histogram calculated using DETX and DETY for each event in the final _common_clean file
| Quadrant A | 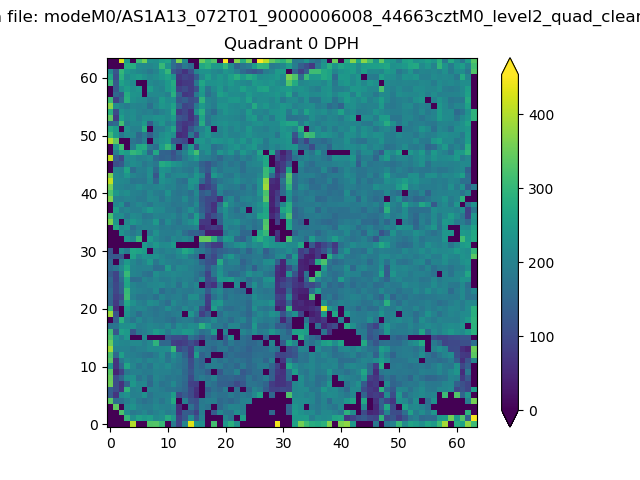 |
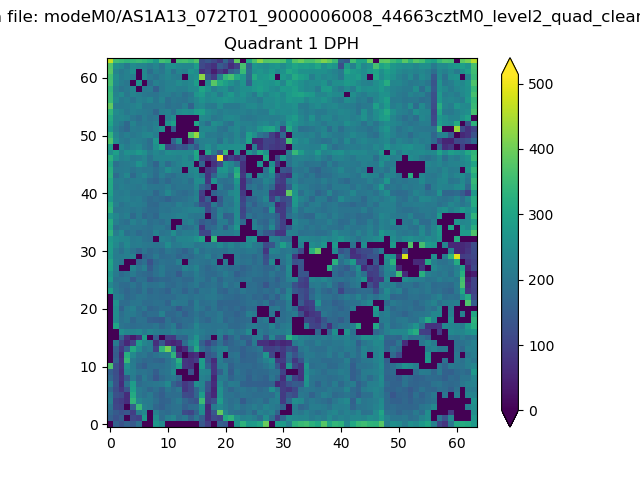 |
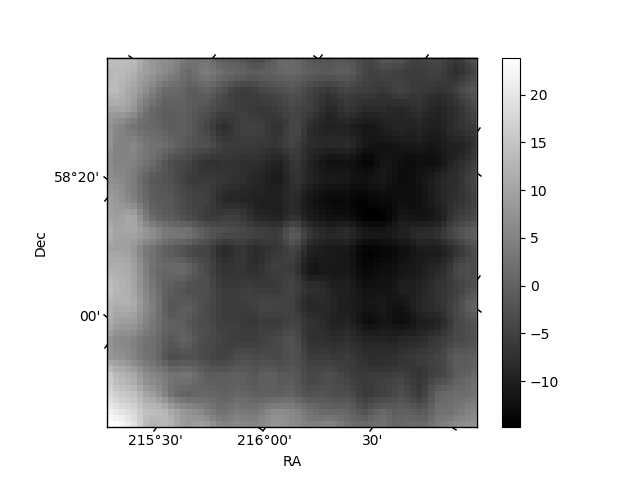
Quadrant B |
|---|---|---|---|
| Quadrant D | 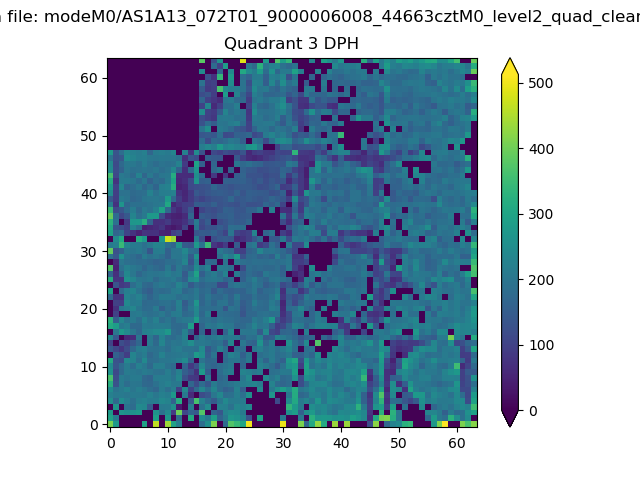 |
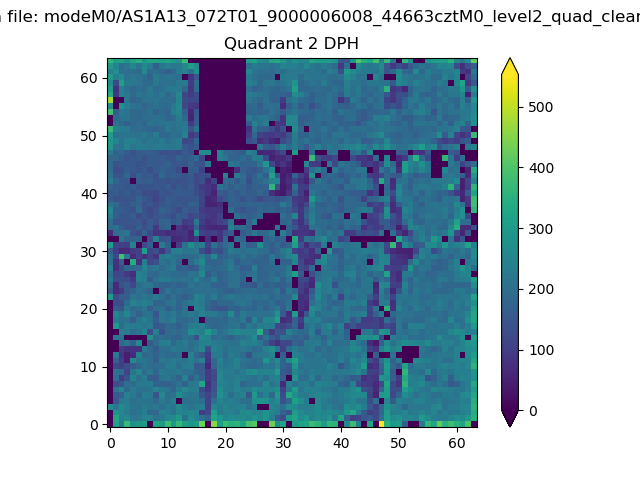 |
Quadrant C |
| Plot type | Count rate plots | Images |
|---|---|---|
| Comparison with Poisson distribution Blue bars denote a histogram of data divided into 1 sec bins. Red curve is a Poisson curve with rate = median count rate of data. |
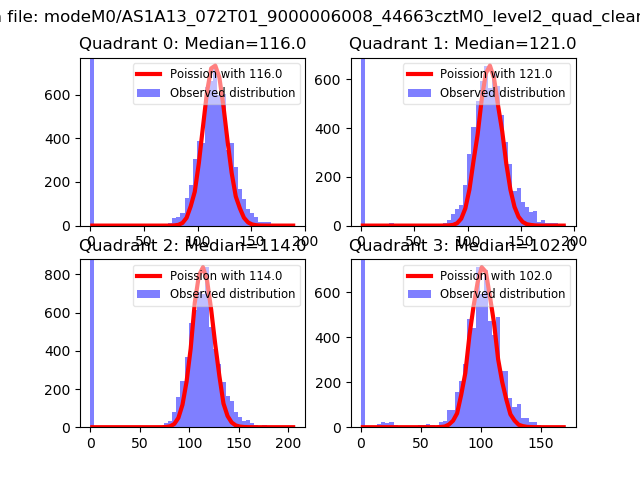 |
 |
| Quadrant-wise count rates Data is divided into 100 sec bins |
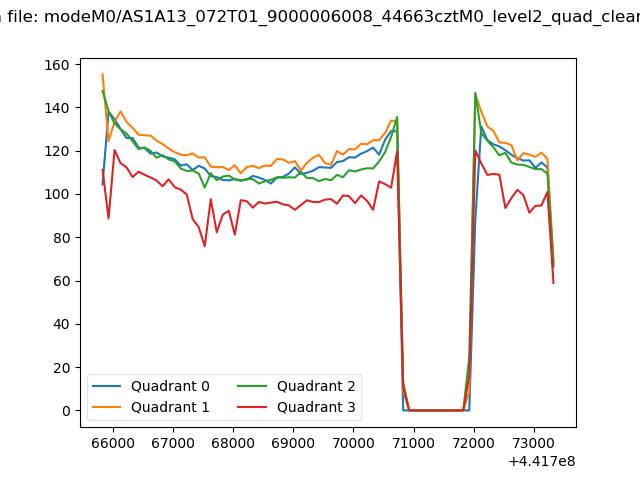 |
|
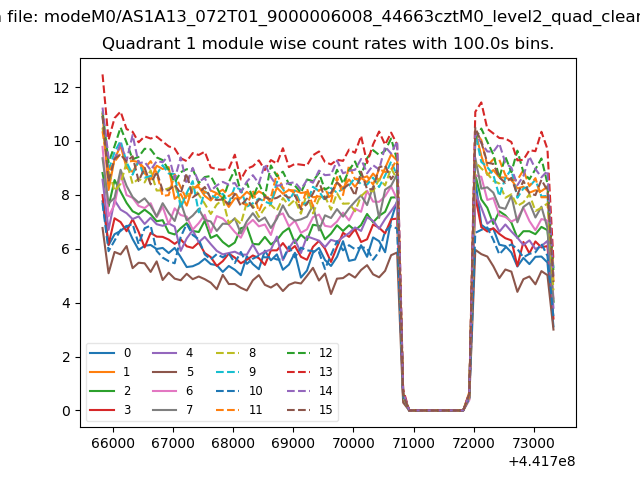
| Module-wise count rates for Quadrant A Data is divided into 100 sec bins |
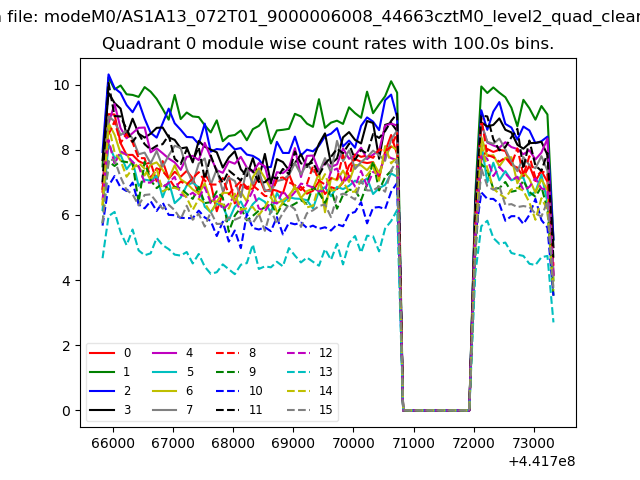 |
 |
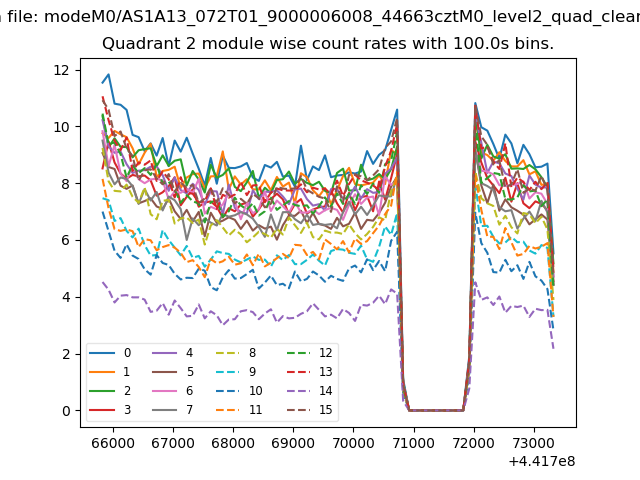
| Module-wise count rates for Quadrant B Data is divided into 100 sec bins |
 |
 |
| Module-wise count rates for Quadrant C Data is divided into 100 sec bins |
 |
 |
| Module-wise count rates for Quadrant D Data is divided into 100 sec bins |
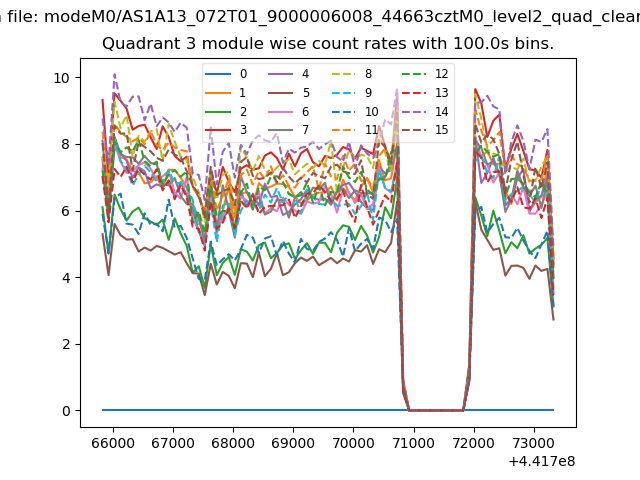 |
 |
| Parameter | Plot |
|---|---|
| CZT HV Monitor | 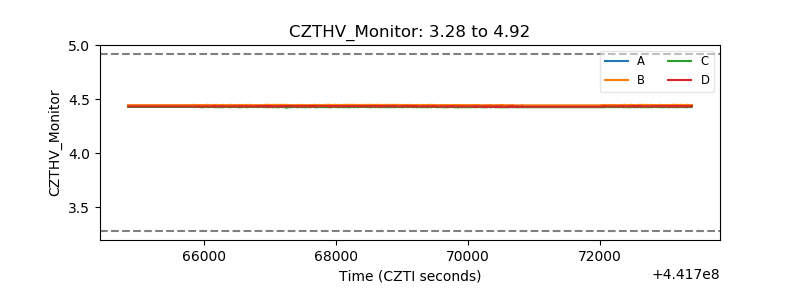 |
| D_VDD | 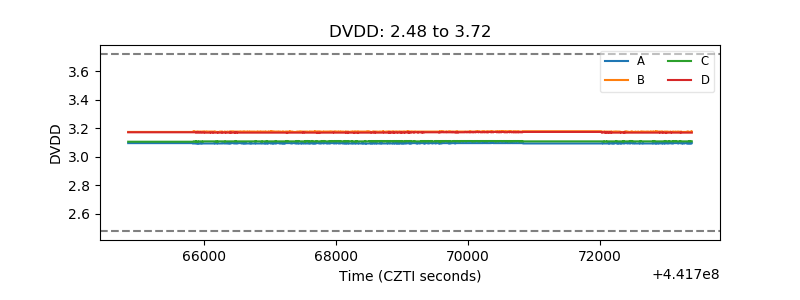 |
| Temperature 1 | 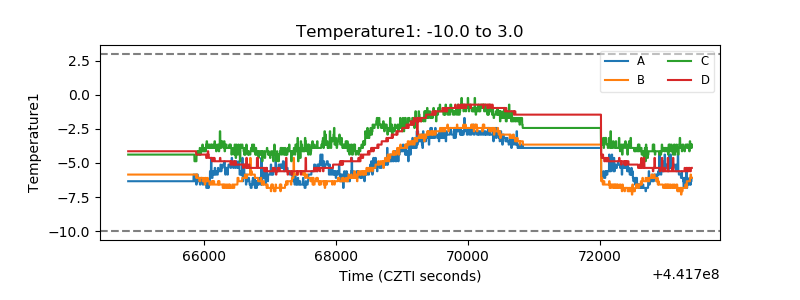 |
| Veto HV Monitor | 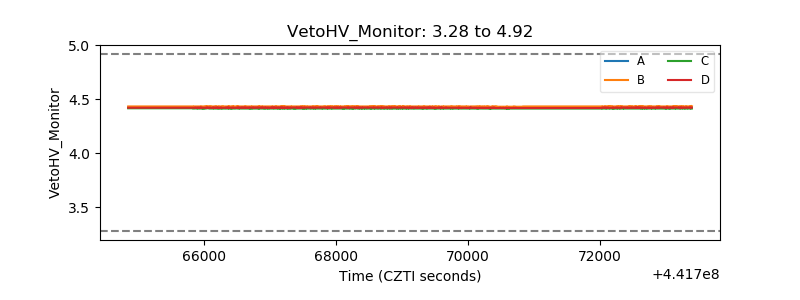 |
| Veto LLD | 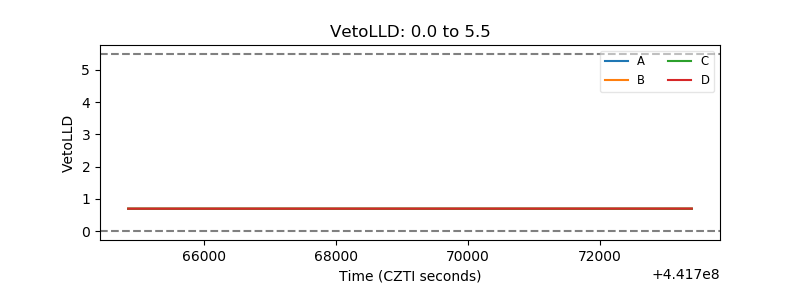 |
| Alpha Counter | 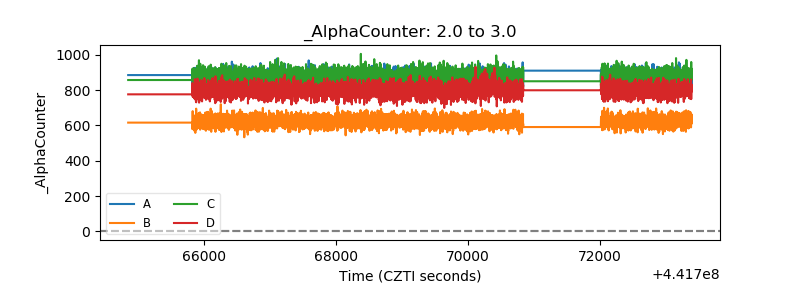 |
| _CPM_Rate | 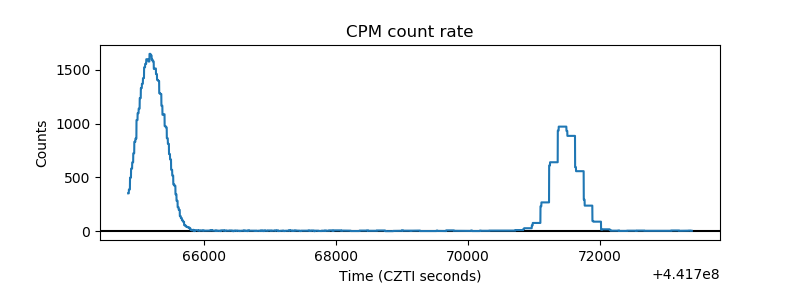 |
| CZT Counter | 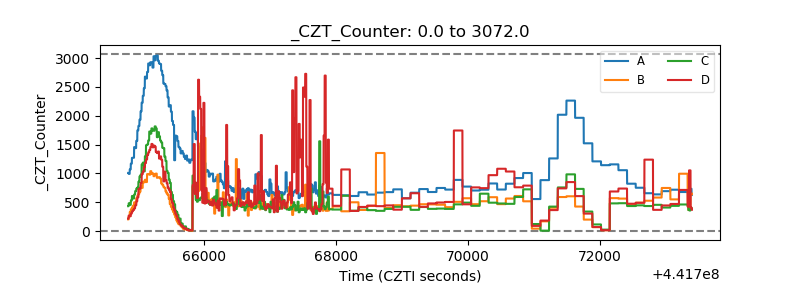 |
| +2.5 Volts monitor | 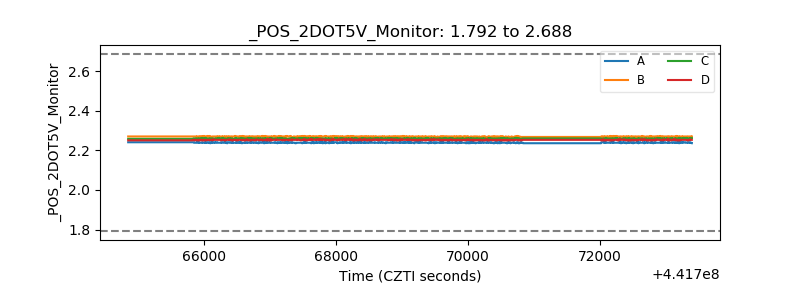 |
| +5 Volts monitor | 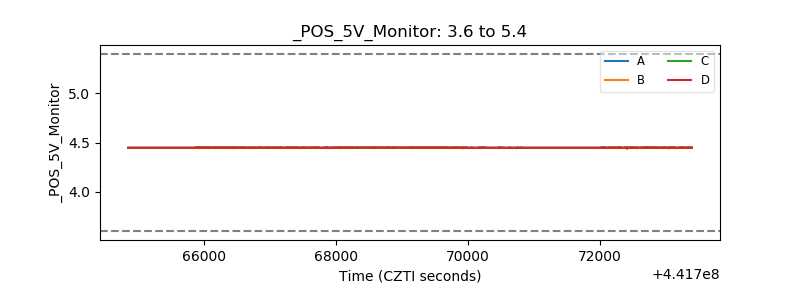 |
| _ROLL_ROT | 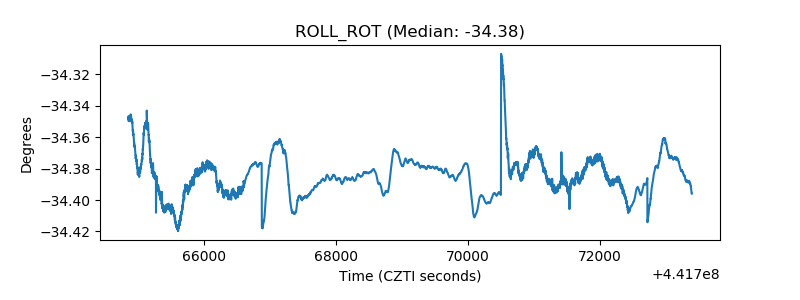 |
| _Roll_DEC | 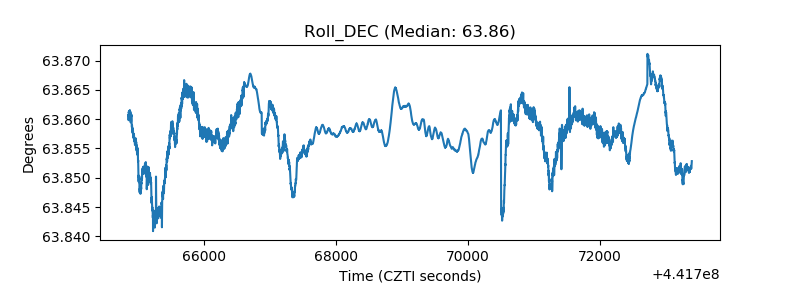 |
| _Roll_RA | 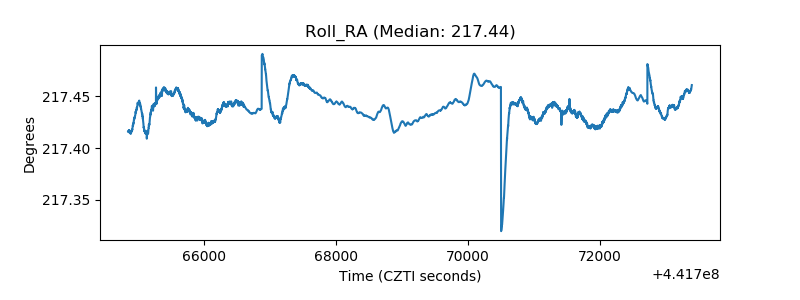 |
| Veto Counter | 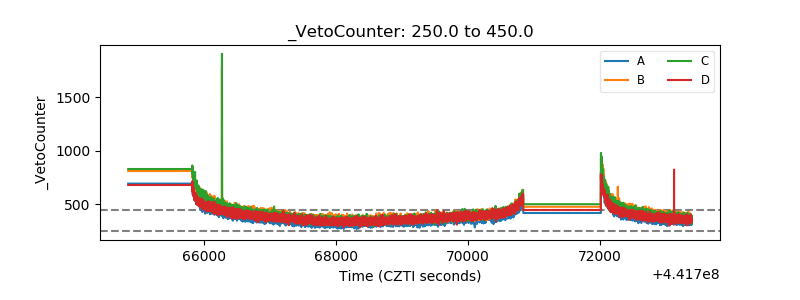 |