| Param | Original file | Final file |
|---|---|---|
| Filename | modeM0/AS1A13_072T01_9000006008_44665cztM0_level2.fits | modeM0/AS1A13_072T01_9000006008_44665cztM0_level2_quad_clean.evt |
| Size (bytes) | 456,477,120 | 110,306,880 |
| Size | 435.3 MB | 105.2 MB |
| Events in quadrant A | 5,125,556 | 731,156 |
| Events in quadrant B | 3,124,718 | 768,669 |
| Events in quadrant C | 3,034,796 | 730,281 |
| Events in quadrant D | 5,079,714 | 632,668 |
| Mode M0 | |||
|---|---|---|---|
| Quadrant | BADHDUFLAG | Total packets | Discarded packets |
| A | 0 | 21267 | 243 |
| B | 0 | 14439 | 116 |
| C | 0 | 14358 | 113 |
| D | 0 | 20250 | 209 |
| Mode SS | |||
|---|---|---|---|
| Quadrant | BADHDUFLAG | Total packets | Discarded packets |
| A | 0 | 138 | 0 |
| B | 0 | 140 | 0 |
| C | 0 | 140 | 0 |
| D | 0 | 140 | 0 |
| Mode M9 | |||
|---|---|---|---|
| Quadrant | BADHDUFLAG | Total packets | Discarded packets |
| A | 0 | 12 | 0 |
| B | 0 | 13 | 0 |
| C | 0 | 13 | 0 |
| D | 0 | 13 | 0 |
| Quadrant | Total seconds | Saturated seconds | Saturation percentage |
|---|---|---|---|
| A | 6826 | 176 | 2.578377% |
| B | 6857 | 75 | 1.093773% |
| C | 6857 | 15 | 0.218755% |
| D | 6853 | 438 | 6.391361% |
Noise dominated data is calculated using 1-second bins in cleaned event files. If a bin has >2000 counts, and if more than 50% of those come from <1% of pixels, then it is considered to be noise-dominated and hence unusable.
| Quadrant | # 1 sec bins | Bins with >0 counts | Bins with >2000 counts | High rate bins dominated by noise | Noise dominated (total time) | Noise dominated (detector-on time) | Marked lightcurve |
|---|---|---|---|---|---|---|---|
| A | 7745 | 6900 | 25 | 25 | 0.32% | 0.36% | 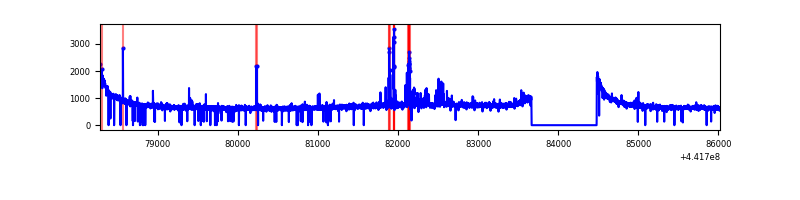 |
| B | 7745 | 6904 | 9 | 9 | 0.12% | 0.13% | 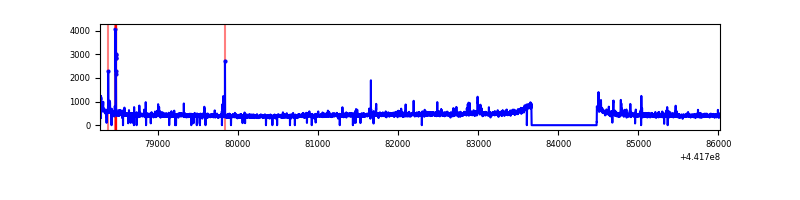 |
| C | 7745 | 6905 | 5 | 5 | 0.06% | 0.07% | 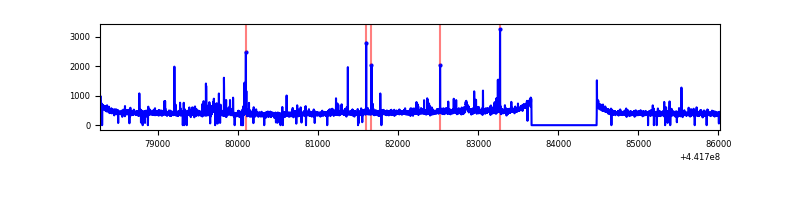 |
| D | 7745 | 6907 | 326 | 326 | 4.21% | 4.72% | 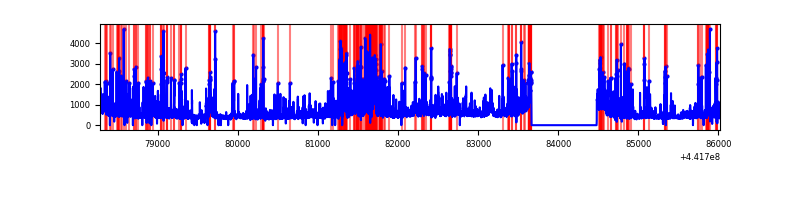 |
Top three noisy pixels from each quadrant. If the there are fewer than three noisy pixels in the level2.evt file, extra rows are filled as -1
| Pixel properties | Quadrant properties | ||||||
|---|---|---|---|---|---|---|---|
| Quadrant | DetID | PixID | Counts | Sigma | Mean | Median | Sigma |
| A | 10 | 83 | 2074917 | 13479.34 | 744 | 728 | 153.9 |
| A | 13 | 248 | 140418 | 907.79 | 744 | 728 | 153.9 |
| A | 10 | 248 | 23878 | 150.44 | 744 | 728 | 153.9 |
| B | 5 | 172 | 46695 | 314.36 | 749 | 728 | 146.2 |
| B | 4 | 171 | 35055 | 234.76 | 749 | 728 | 146.2 |
| B | 0 | 246 | 22325 | 147.7 | 749 | 728 | 146.2 |
| C | 14 | 254 | 58474 | 339.52 | 728 | 732 | 170.1 |
| C | 12 | 2 | 55422 | 321.58 | 728 | 732 | 170.1 |
| C | 3 | 233 | 37530 | 216.37 | 728 | 732 | 170.1 |
| D | 2 | 249 | 901042 | 5142.81 | 702 | 679 | 175.1 |
| D | 1 | 52 | 612783 | 3496.29 | 702 | 679 | 175.1 |
| D | 13 | 249 | 444005 | 2532.25 | 702 | 679 | 175.1 |
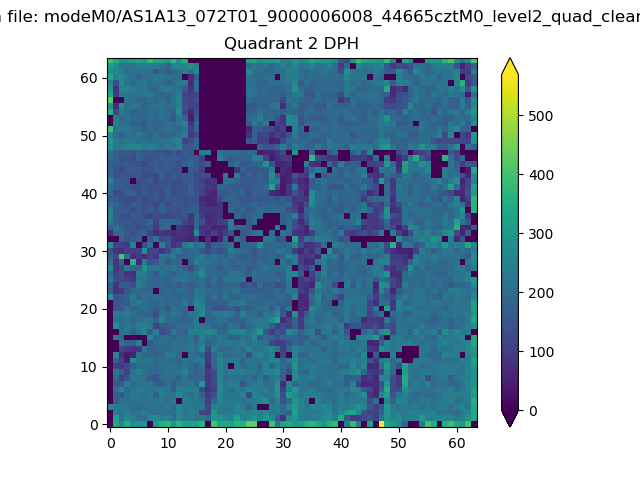
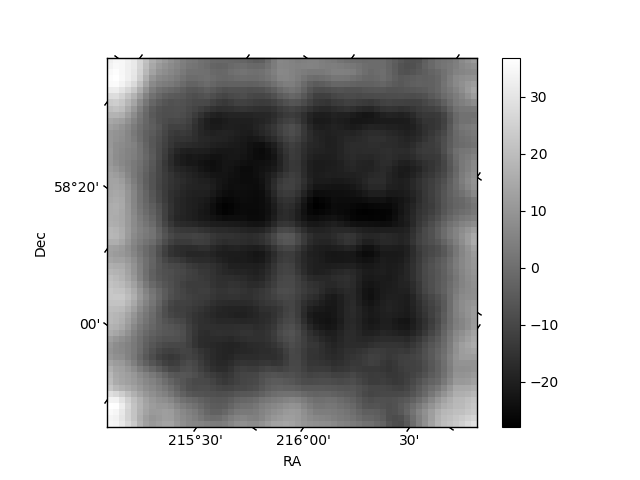
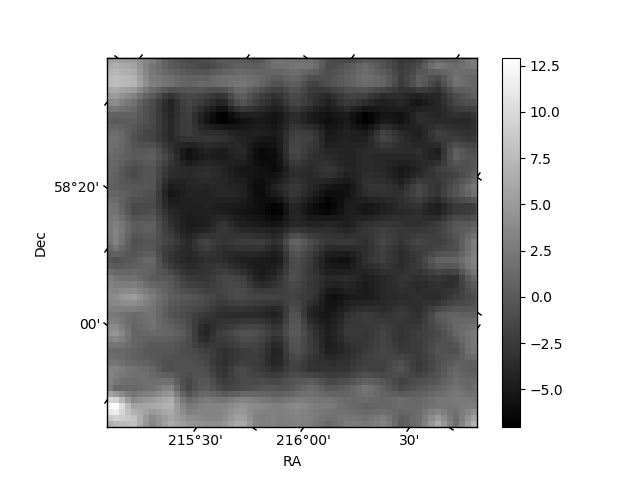
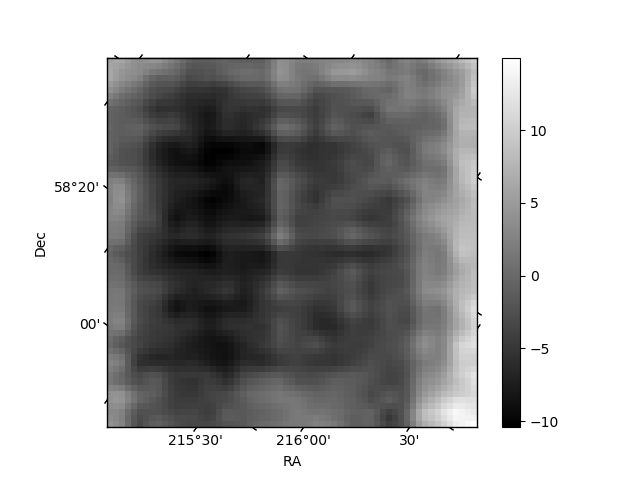
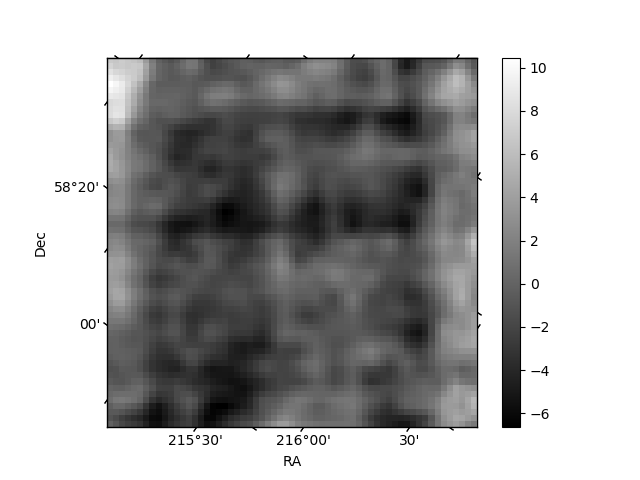
Histogram calculated using DETX and DETY for each event in the final _common_clean file
| Quadrant A | 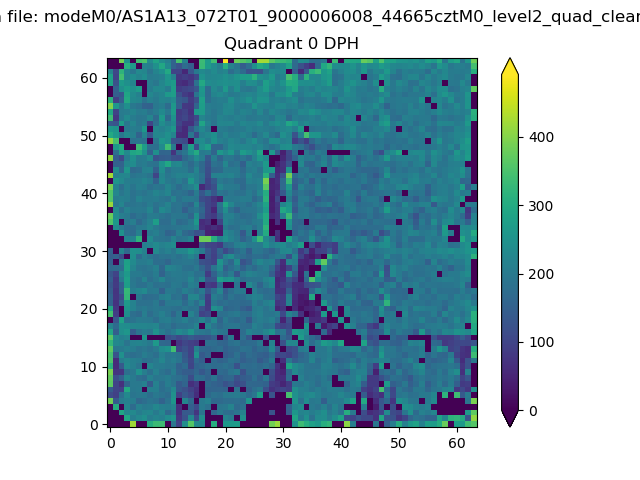 |
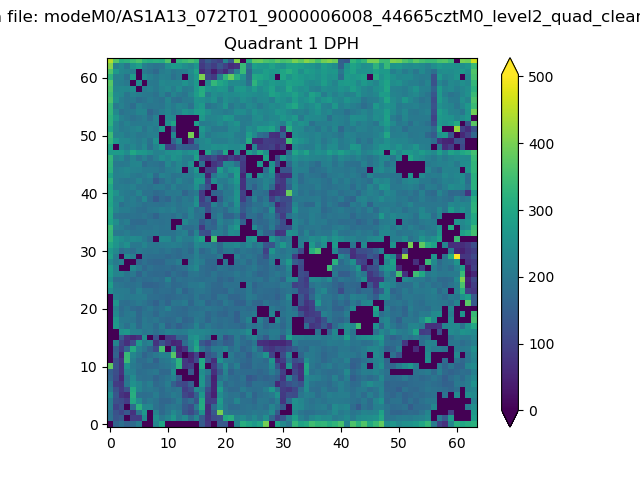 |
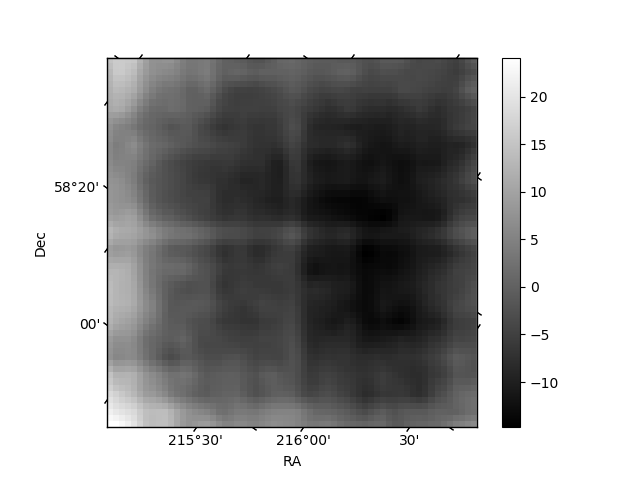
Quadrant B |
|---|---|---|---|
| Quadrant D | 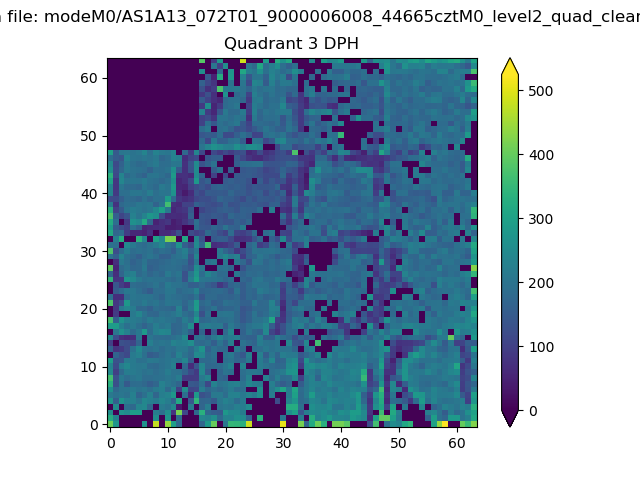 |
 |
Quadrant C |
| Plot type | Count rate plots | Images |
|---|---|---|
| Comparison with Poisson distribution Blue bars denote a histogram of data divided into 1 sec bins. Red curve is a Poisson curve with rate = median count rate of data. |
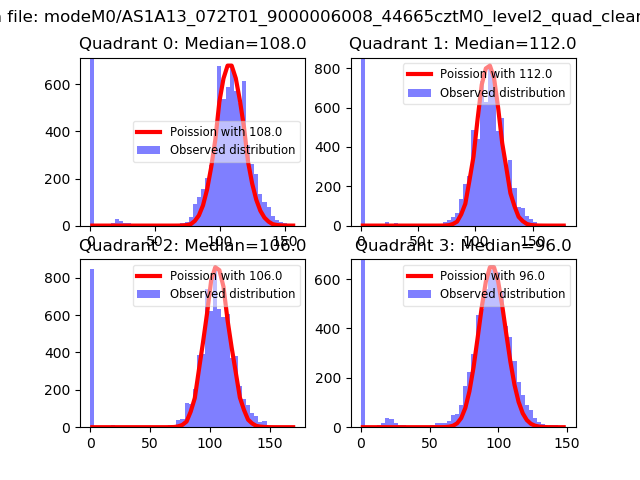 |
 |
| Quadrant-wise count rates Data is divided into 100 sec bins |
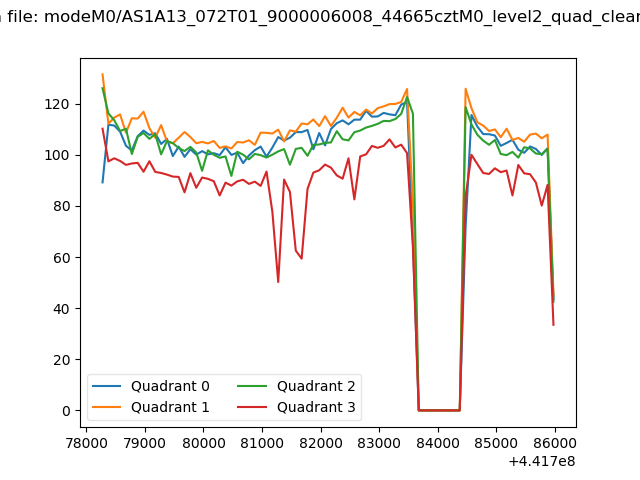 |
|
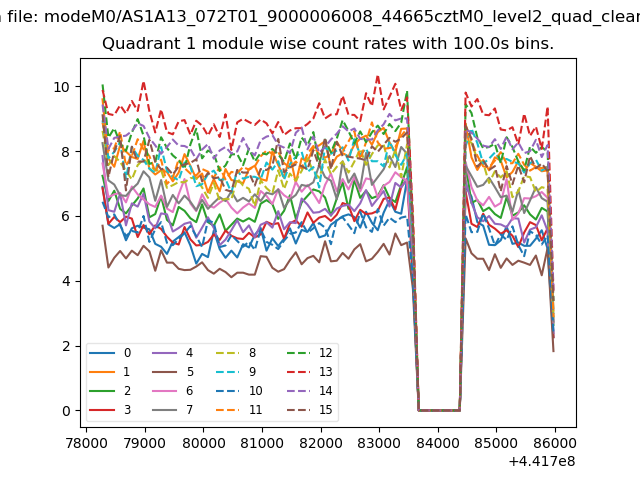
| Module-wise count rates for Quadrant A Data is divided into 100 sec bins |
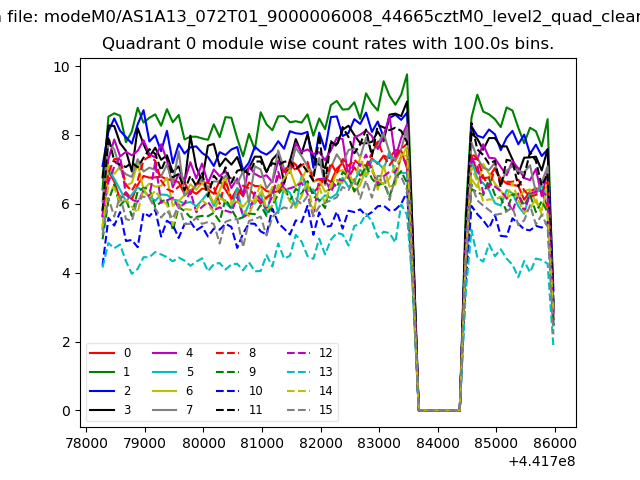 |
 |
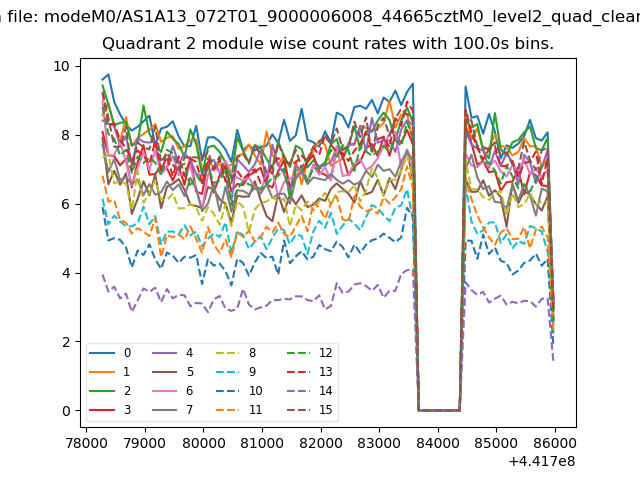
| Module-wise count rates for Quadrant B Data is divided into 100 sec bins |
 |
 |
| Module-wise count rates for Quadrant C Data is divided into 100 sec bins |
 |
 |
| Module-wise count rates for Quadrant D Data is divided into 100 sec bins |
 |
 |
| Parameter | Plot |
|---|---|
| CZT HV Monitor | 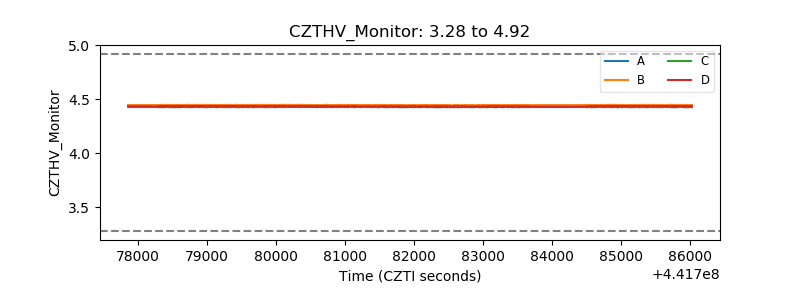 |
| D_VDD | 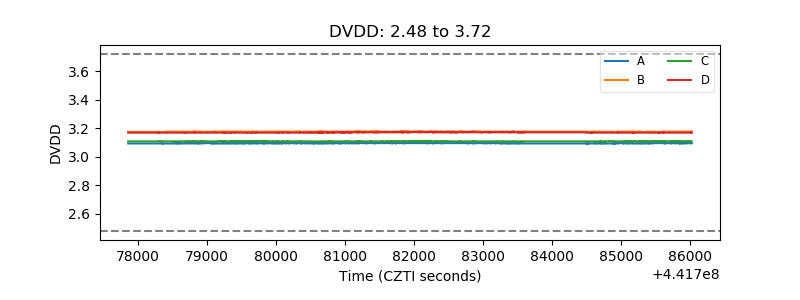 |
| Temperature 1 | 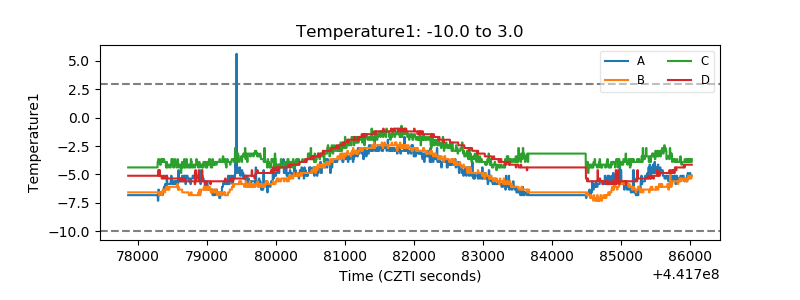 |
| Veto HV Monitor | 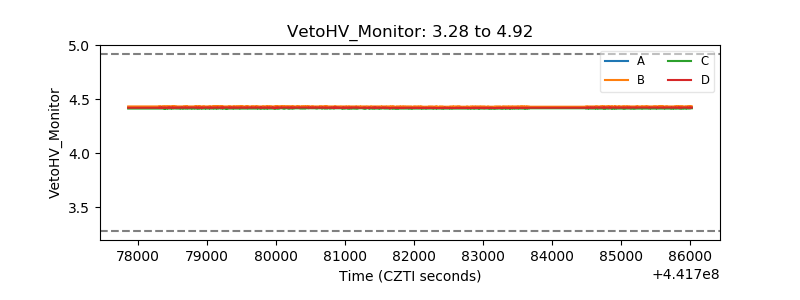 |
| Veto LLD | 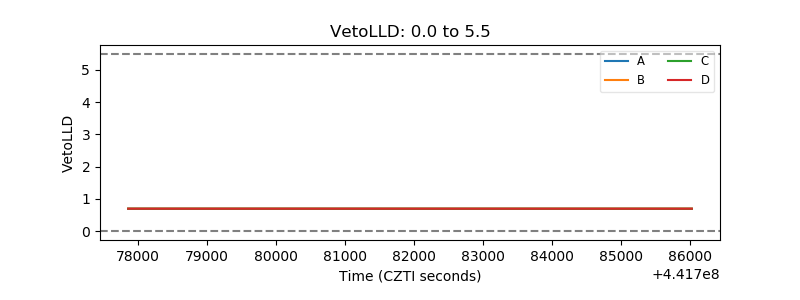 |
| Alpha Counter | 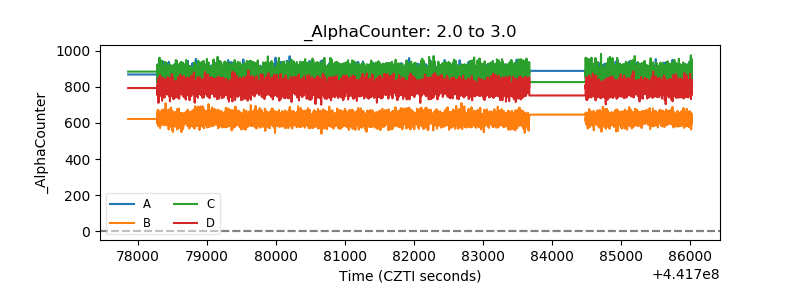 |
| _CPM_Rate | 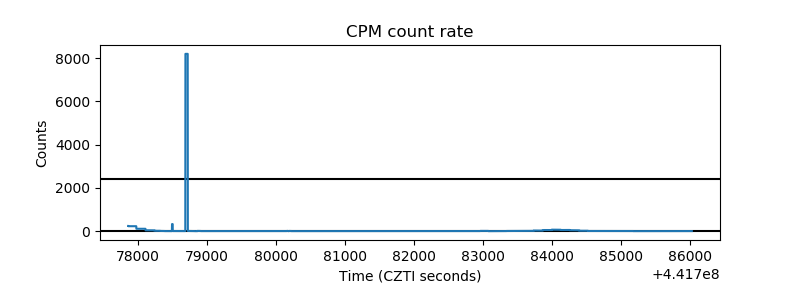 |
| CZT Counter | 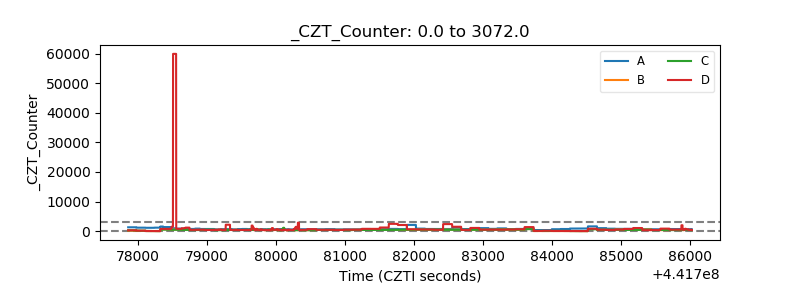 |
| +2.5 Volts monitor | 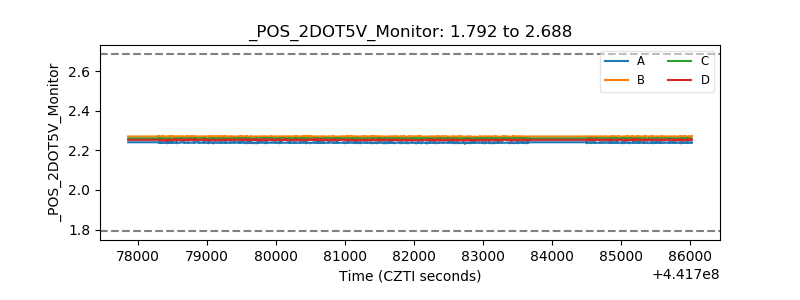 |
| +5 Volts monitor | 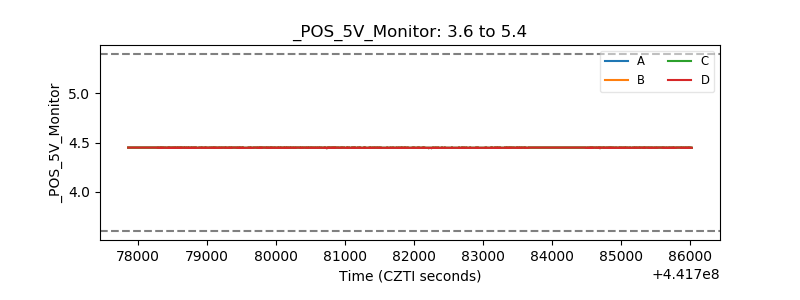 |
| _ROLL_ROT | 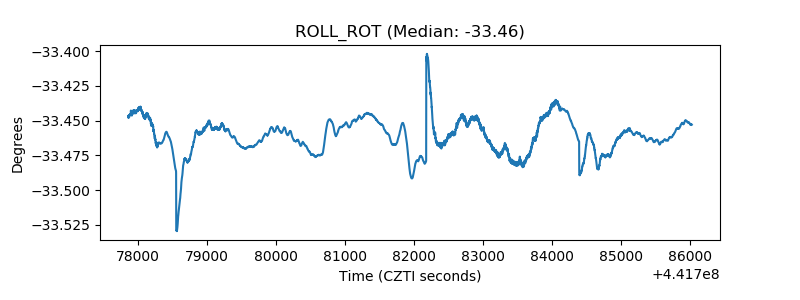 |
| _Roll_DEC | 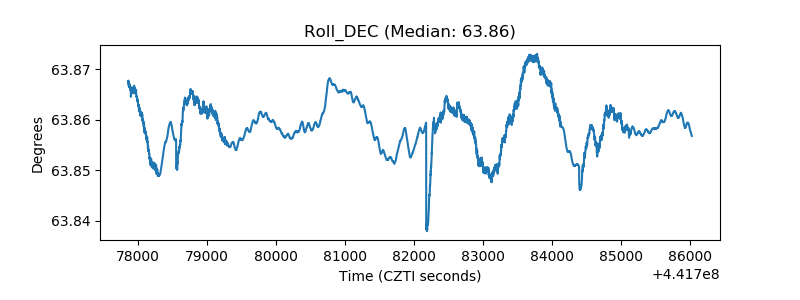 |
| _Roll_RA | 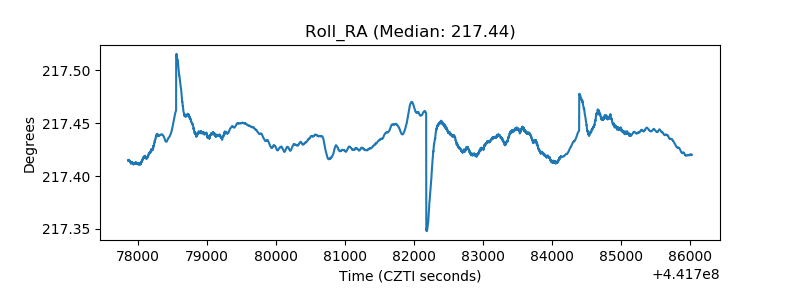 |
| Veto Counter | 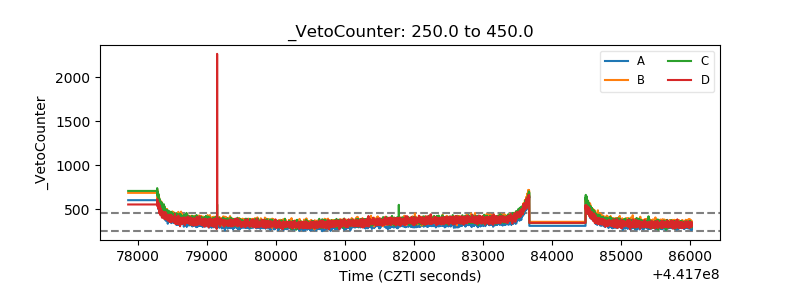 |