| Param | Original file | Final file |
|---|---|---|
| Filename | modeM0/AS1A13_072T01_9000006008_44666cztM0_level2.fits | modeM0/AS1A13_072T01_9000006008_44666cztM0_level2_quad_clean.evt |
| Size (bytes) | 477,809,280 | 109,601,280 |
| Size | 455.7 MB | 104.5 MB |
| Events in quadrant A | 4,824,461 | 721,315 |
| Events in quadrant B | 3,335,460 | 759,241 |
| Events in quadrant C | 3,159,215 | 727,731 |
| Events in quadrant D | 5,826,947 | 624,686 |
| Mode M0 | |||
|---|---|---|---|
| Quadrant | BADHDUFLAG | Total packets | Discarded packets |
| A | 0 | 20629 | 2 |
| B | 0 | 15016 | 2 |
| C | 0 | 14685 | 2 |
| D | 0 | 22229 | 2 |
| Mode SS | |||
|---|---|---|---|
| Quadrant | BADHDUFLAG | Total packets | Discarded packets |
| A | 0 | 144 | 0 |
| B | 0 | 144 | 0 |
| C | 0 | 144 | 0 |
| D | 0 | 144 | 0 |
| Mode M9 | |||
|---|---|---|---|
| Quadrant | BADHDUFLAG | Total packets | Discarded packets |
| A | 0 | 1 | 0 |
| B | 0 | 1 | 0 |
| C | 0 | 1 | 0 |
| D | 0 | 1 | 0 |
| Quadrant | Total seconds | Saturated seconds | Saturation percentage |
|---|---|---|---|
| A | 6962 | 232 | 3.332376% |
| B | 6963 | 196 | 2.814879% |
| C | 6963 | 58 | 0.832974% |
| D | 6963 | 581 | 8.344105% |
Noise dominated data is calculated using 1-second bins in cleaned event files. If a bin has >2000 counts, and if more than 50% of those come from <1% of pixels, then it is considered to be noise-dominated and hence unusable.
| Quadrant | # 1 sec bins | Bins with >0 counts | Bins with >2000 counts | High rate bins dominated by noise | Noise dominated (total time) | Noise dominated (detector-on time) | Marked lightcurve |
|---|---|---|---|---|---|---|---|
| A | 7117 | 6965 | 5 | 5 | 0.07% | 0.07% | 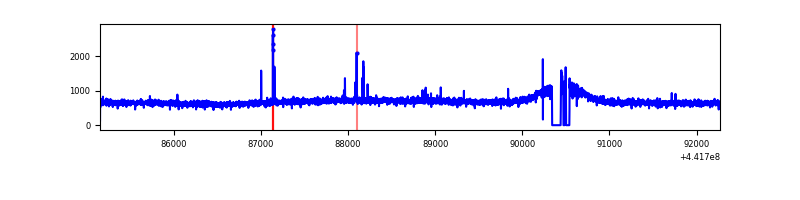 |
| B | 7118 | 6966 | 16 | 16 | 0.22% | 0.23% | 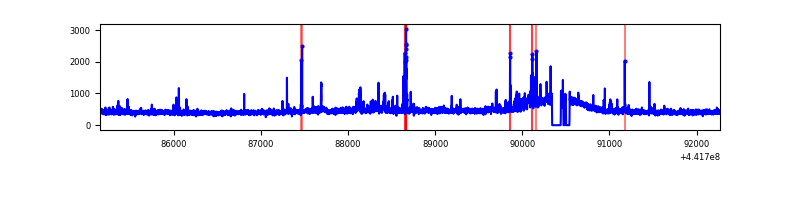 |
| C | 7118 | 6966 | 12 | 12 | 0.17% | 0.17% | 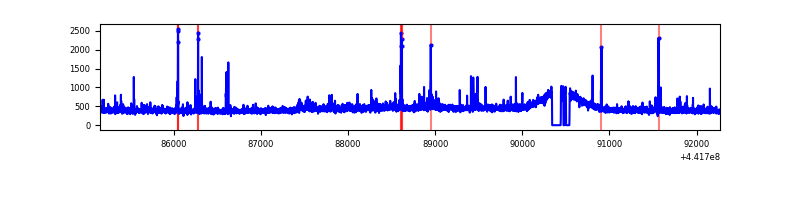 |
| D | 7118 | 6966 | 414 | 414 | 5.82% | 5.94% | 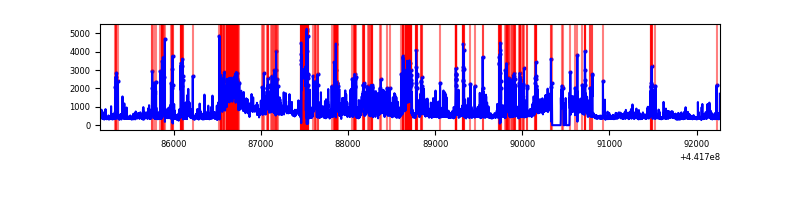 |
Top three noisy pixels from each quadrant. If the there are fewer than three noisy pixels in the level2.evt file, extra rows are filled as -1
| Pixel properties | Quadrant properties | ||||||
|---|---|---|---|---|---|---|---|
| Quadrant | DetID | PixID | Counts | Sigma | Mean | Median | Sigma |
| A | 10 | 83 | 1768907 | 11078.04 | 772 | 754 | 159.6 |
| A | 13 | 248 | 40239 | 247.39 | 772 | 754 | 159.6 |
| A | 15 | 223 | 15681 | 93.52 | 772 | 754 | 159.6 |
| B | 0 | 168 | 84951 | 551.78 | 768 | 746 | 152.6 |
| B | 3 | 112 | 56983 | 368.51 | 768 | 746 | 152.6 |
| B | 5 | 255 | 39126 | 251.5 | 768 | 746 | 152.6 |
| C | 14 | 254 | 106285 | 597.87 | 752 | 754 | 176.5 |
| C | 3 | 233 | 61922 | 346.54 | 752 | 754 | 176.5 |
| C | 2 | 14 | 21951 | 120.09 | 752 | 754 | 176.5 |
| D | 2 | 37 | 876500 | 4786.73 | 730 | 705 | 183.0 |
| D | 1 | 52 | 845963 | 4619.83 | 730 | 705 | 183.0 |
| D | 2 | 249 | 591696 | 3230.11 | 730 | 705 | 183.0 |
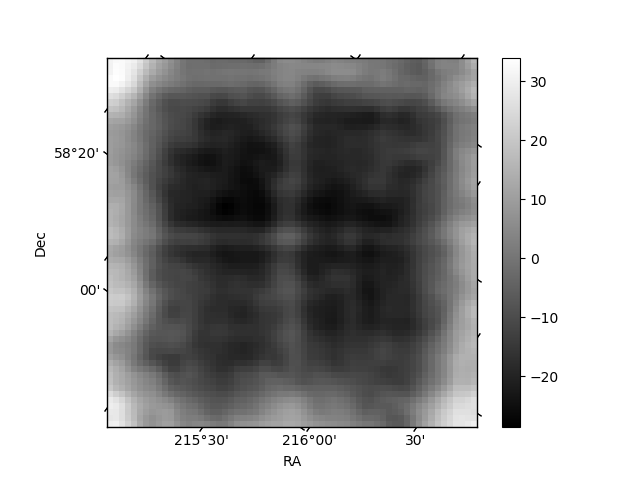
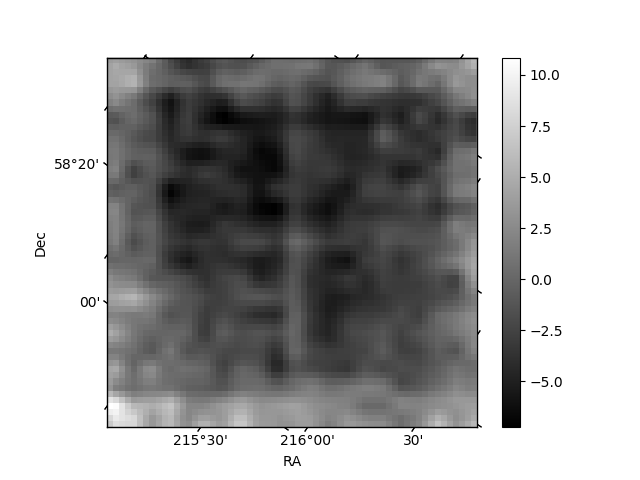
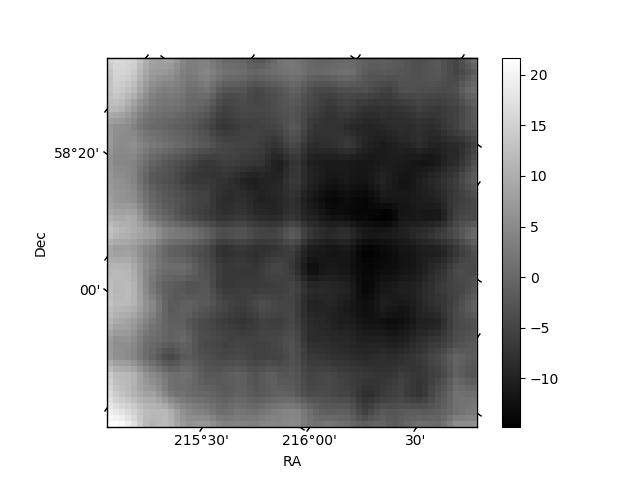
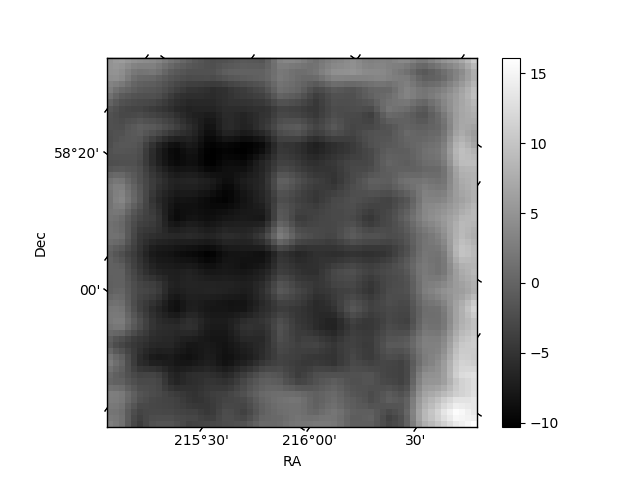
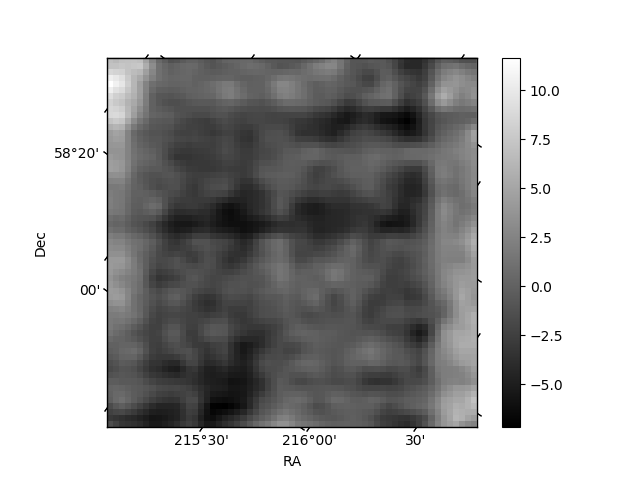
Histogram calculated using DETX and DETY for each event in the final _common_clean file
| Quadrant A | 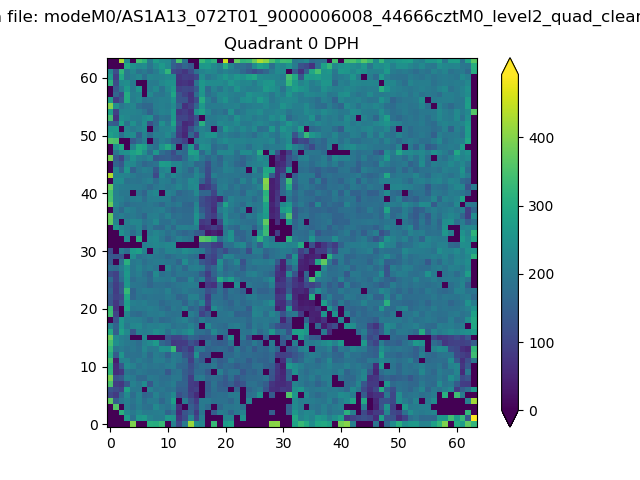 |
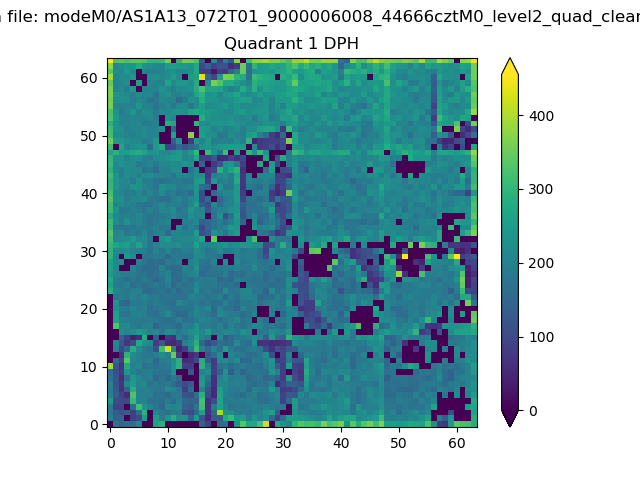 |
Quadrant B |
|---|---|---|---|
| Quadrant D | 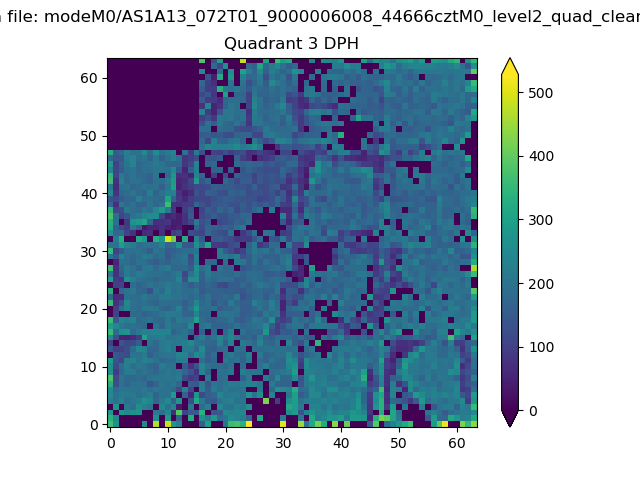 |
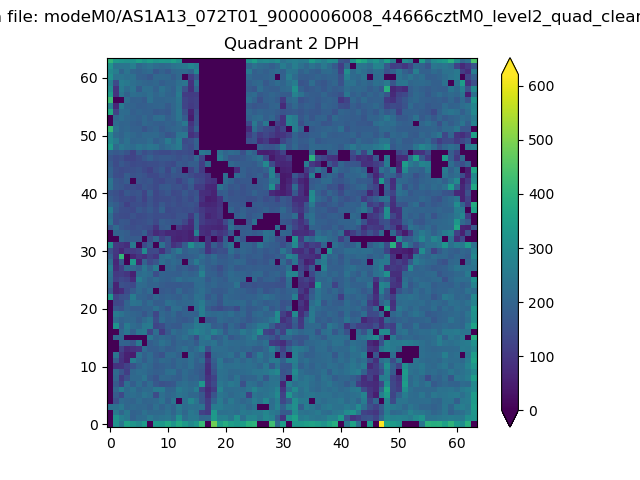 |
Quadrant C |
| Plot type | Count rate plots | Images |
|---|---|---|
| Comparison with Poisson distribution Blue bars denote a histogram of data divided into 1 sec bins. Red curve is a Poisson curve with rate = median count rate of data. |
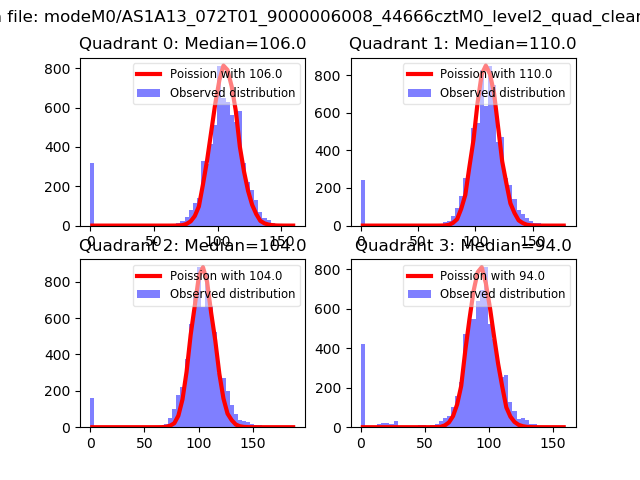 |
 |
| Quadrant-wise count rates Data is divided into 100 sec bins |
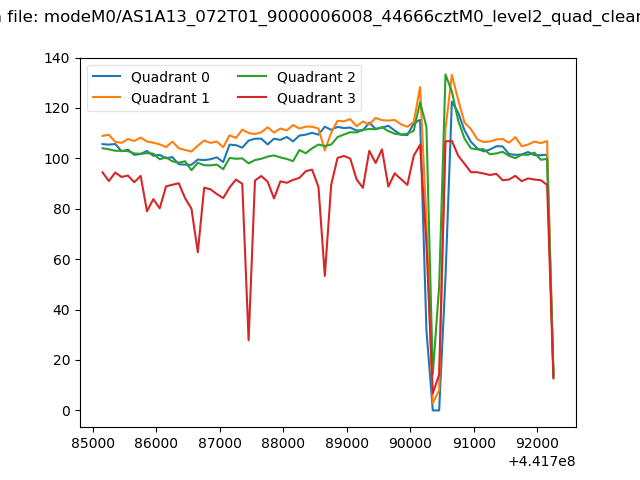 |
|
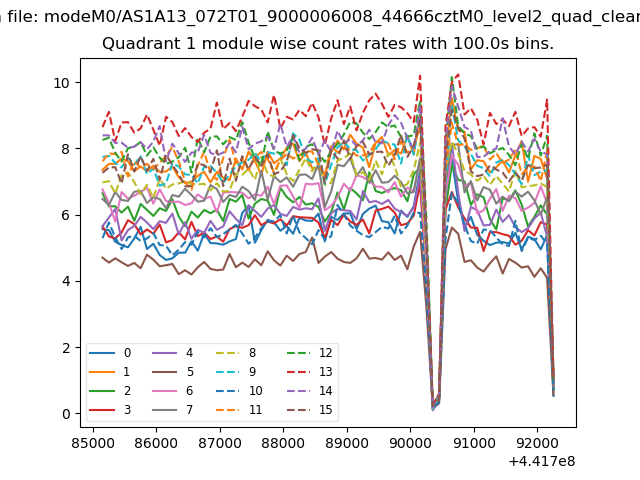
| Module-wise count rates for Quadrant A Data is divided into 100 sec bins |
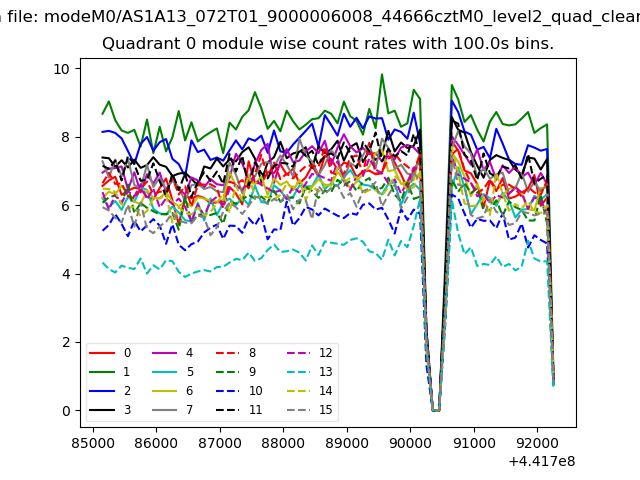 |
 |
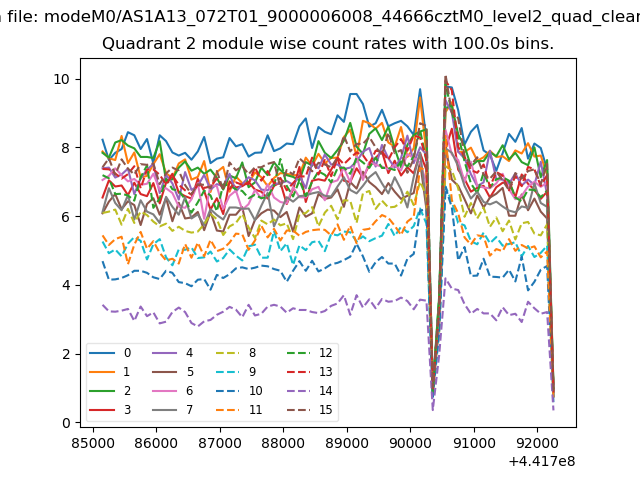
| Module-wise count rates for Quadrant B Data is divided into 100 sec bins |
 |
 |
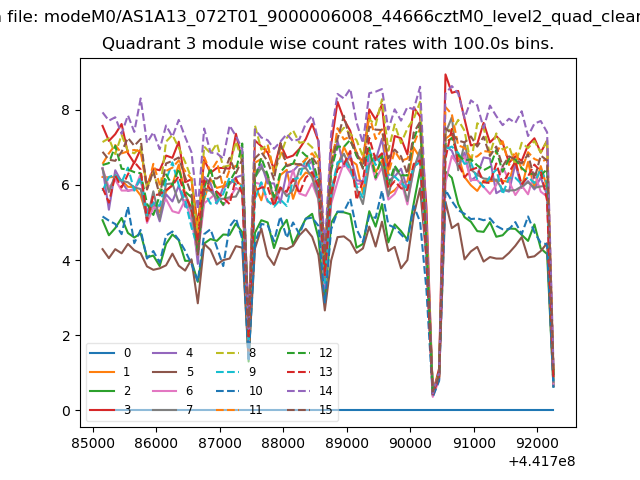
| Module-wise count rates for Quadrant C Data is divided into 100 sec bins |
 |
 |
| Module-wise count rates for Quadrant D Data is divided into 100 sec bins |
 |
 |
| Parameter | Plot |
|---|---|
| CZT HV Monitor | 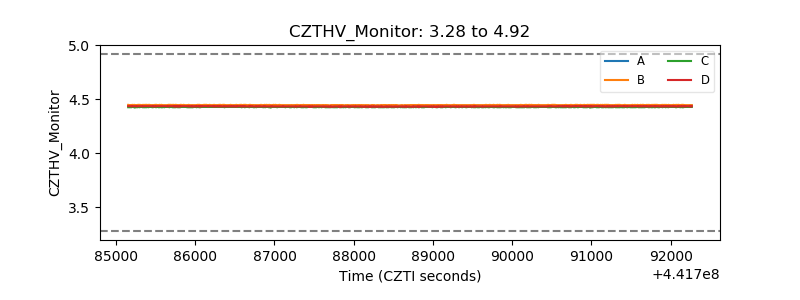 |
| D_VDD | 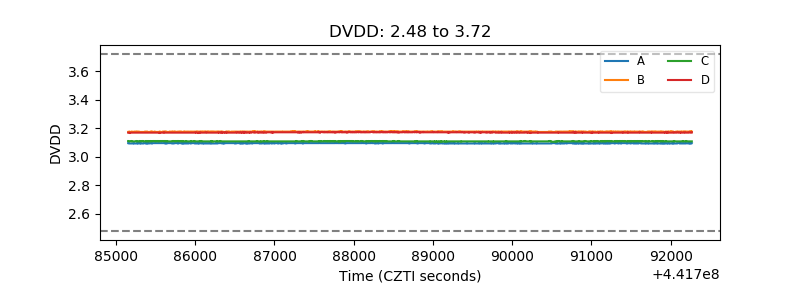 |
| Temperature 1 |  |
| Veto HV Monitor | 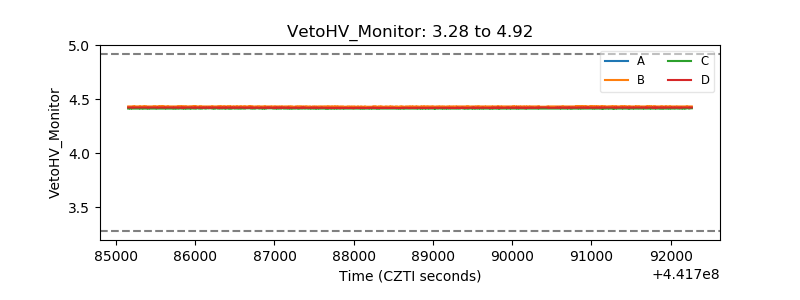 |
| Veto LLD | 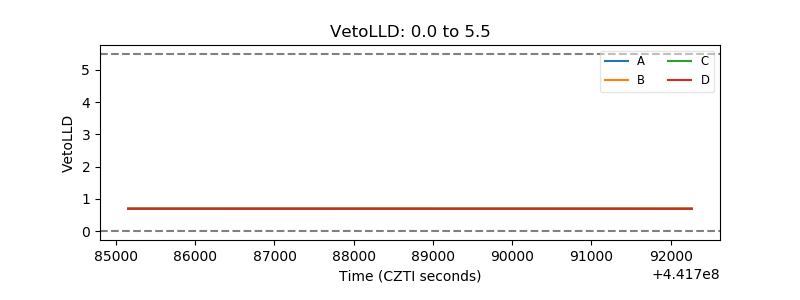 |
| Alpha Counter | 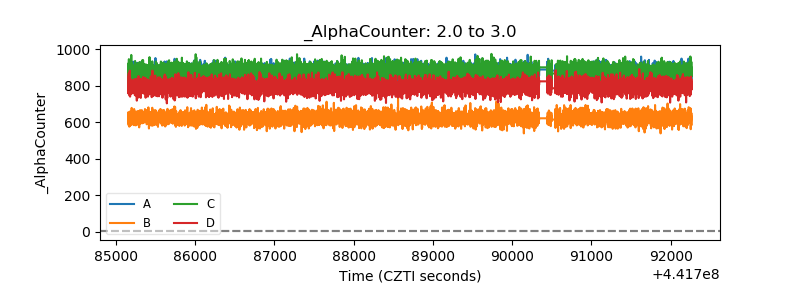 |
| _CPM_Rate | 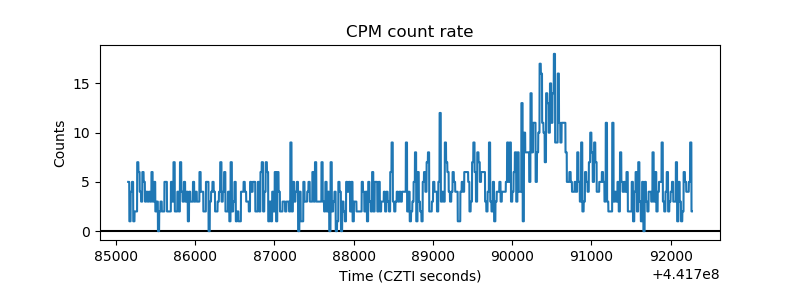 |
| CZT Counter | 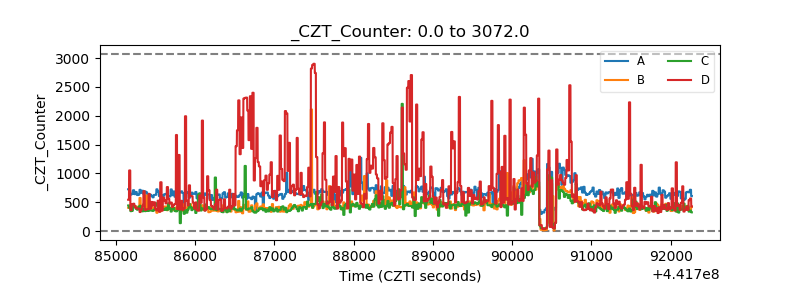 |
| +2.5 Volts monitor | 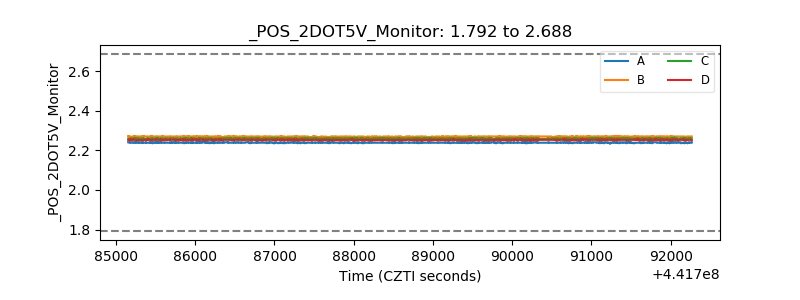 |
| +5 Volts monitor | 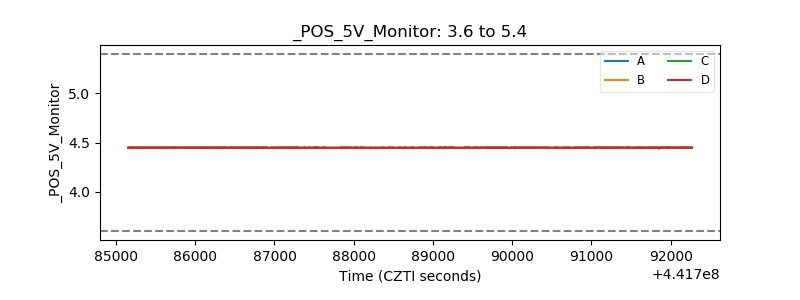 |
| _ROLL_ROT | 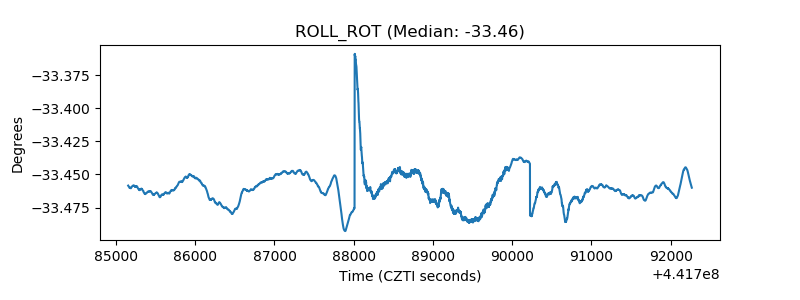 |
| _Roll_DEC | 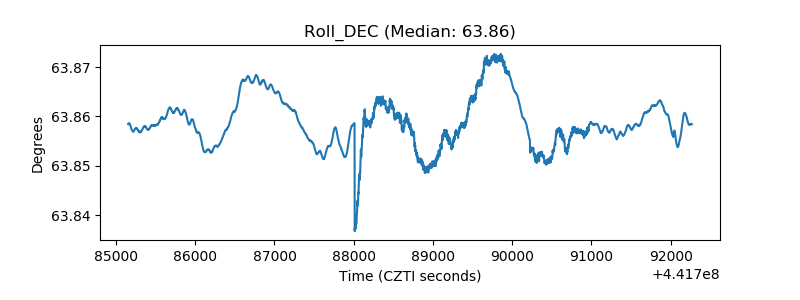 |
| _Roll_RA | 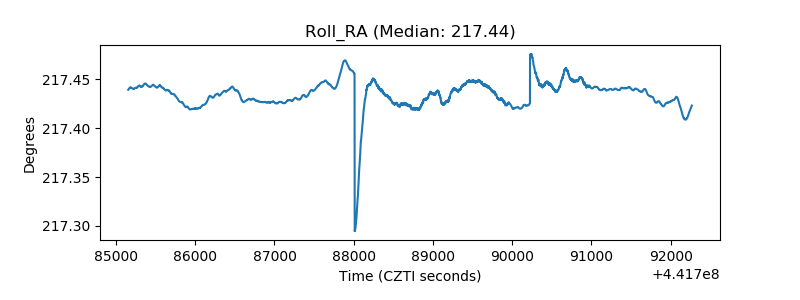 |
| Veto Counter | 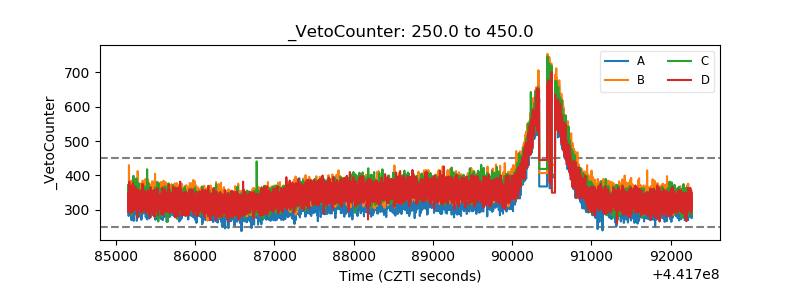 |