| Param | Original file | Final file |
|---|---|---|
| Filename | modeM0/AS1A13_072T01_9000006008_44667cztM0_level2.fits | modeM0/AS1A13_072T01_9000006008_44667cztM0_level2_quad_clean.evt |
| Size (bytes) | 1,582,205,760 | 371,177,280 |
| Size | 1.5 GB | 354.0 MB |
| Events in quadrant A | 16,525,152 | 2,486,281 |
| Events in quadrant B | 11,075,405 | 2,594,678 |
| Events in quadrant C | 10,508,227 | 2,456,822 |
| Events in quadrant D | 18,659,421 | 2,098,165 |
| Mode M0 | |||
|---|---|---|---|
| Quadrant | BADHDUFLAG | Total packets | Discarded packets |
| A | 0 | 69430 | 4 |
| B | 0 | 49711 | 4 |
| C | 0 | 48780 | 4 |
| D | 0 | 72086 | 4 |
| Mode SS | |||
|---|---|---|---|
| Quadrant | BADHDUFLAG | Total packets | Discarded packets |
| A | 0 | 472 | 0 |
| B | 0 | 472 | 0 |
| C | 0 | 472 | 0 |
| D | 0 | 472 | 0 |
| Mode M9 | |||
|---|---|---|---|
| Quadrant | BADHDUFLAG | Total packets | Discarded packets |
| A | 0 | 21 | 0 |
| B | 0 | 21 | 0 |
| C | 0 | 21 | 0 |
| D | 0 | 21 | 0 |
| Quadrant | Total seconds | Saturated seconds | Saturation percentage |
|---|---|---|---|
| A | 23280 | 460 | 1.975945% |
| B | 23281 | 324 | 1.391693% |
| C | 23281 | 109 | 0.468193% |
| D | 23281 | 1970 | 8.461836% |
Noise dominated data is calculated using 1-second bins in cleaned event files. If a bin has >2000 counts, and if more than 50% of those come from <1% of pixels, then it is considered to be noise-dominated and hence unusable.
| Quadrant | # 1 sec bins | Bins with >0 counts | Bins with >2000 counts | High rate bins dominated by noise | Noise dominated (total time) | Noise dominated (detector-on time) | Marked lightcurve |
|---|---|---|---|---|---|---|---|
| A | 25380 | 23285 | 35 | 35 | 0.14% | 0.15% | 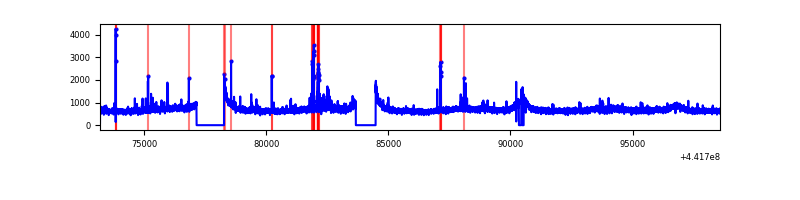 |
| B | 25381 | 23286 | 38 | 38 | 0.15% | 0.16% | 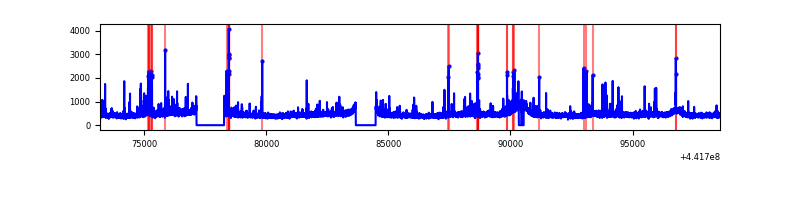 |
| C | 25381 | 23286 | 43 | 43 | 0.17% | 0.18% | 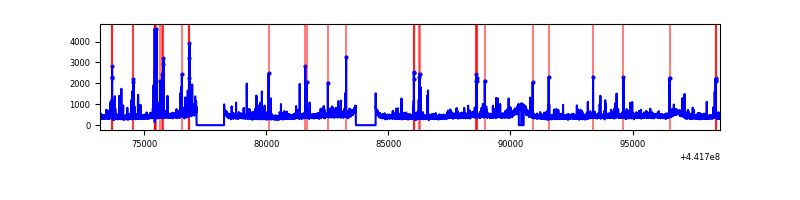 |
| D | 25381 | 23286 | 1498 | 1498 | 5.90% | 6.43% | 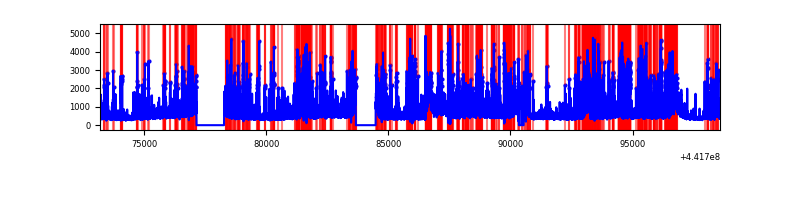 |
Top three noisy pixels from each quadrant. If the there are fewer than three noisy pixels in the level2.evt file, extra rows are filled as -1
| Pixel properties | Quadrant properties | ||||||
|---|---|---|---|---|---|---|---|
| Quadrant | DetID | PixID | Counts | Sigma | Mean | Median | Sigma |
| A | 10 | 83 | 6274568 | 11933.62 | 2566 | 2505 | 525.6 |
| A | 13 | 248 | 213042 | 400.58 | 2566 | 2505 | 525.6 |
| A | 10 | 248 | 48324 | 87.18 | 2566 | 2505 | 525.6 |
| B | 0 | 189 | 182729 | 363.61 | 2559 | 2475 | 495.7 |
| B | 0 | 183 | 150994 | 299.59 | 2559 | 2475 | 495.7 |
| B | 0 | 168 | 121204 | 239.5 | 2559 | 2475 | 495.7 |
| C | 14 | 254 | 235733 | 402.12 | 2496 | 2506 | 580.0 |
| C | 12 | 2 | 216443 | 368.86 | 2496 | 2506 | 580.0 |
| C | 3 | 233 | 167284 | 284.1 | 2496 | 2506 | 580.0 |
| D | 1 | 52 | 3263703 | 5434.77 | 2408 | 2332 | 600.1 |
| D | 2 | 249 | 2246720 | 3740.06 | 2408 | 2332 | 600.1 |
| D | 13 | 249 | 1795206 | 2987.66 | 2408 | 2332 | 600.1 |
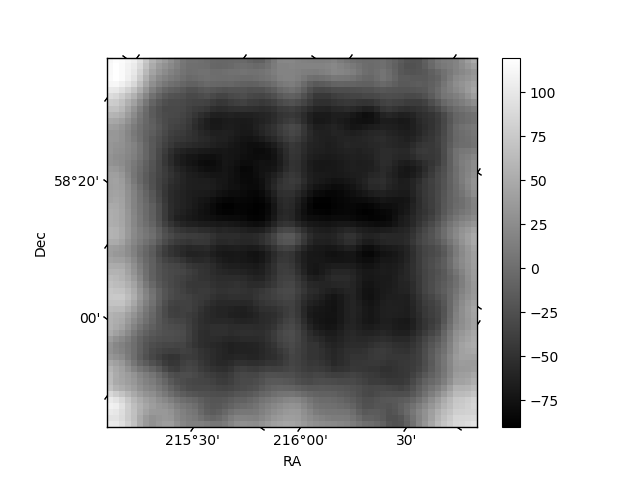
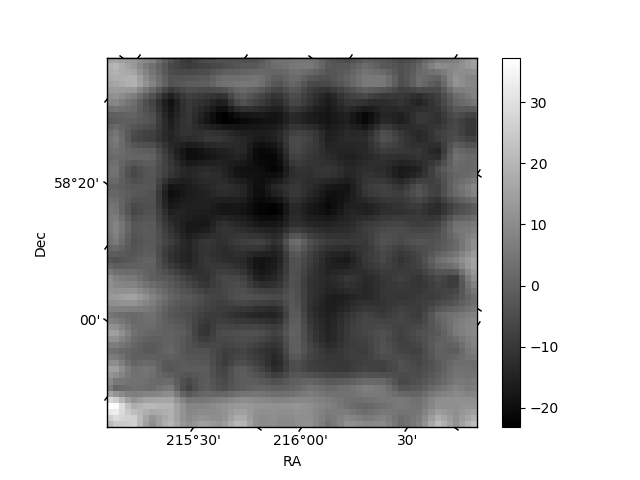
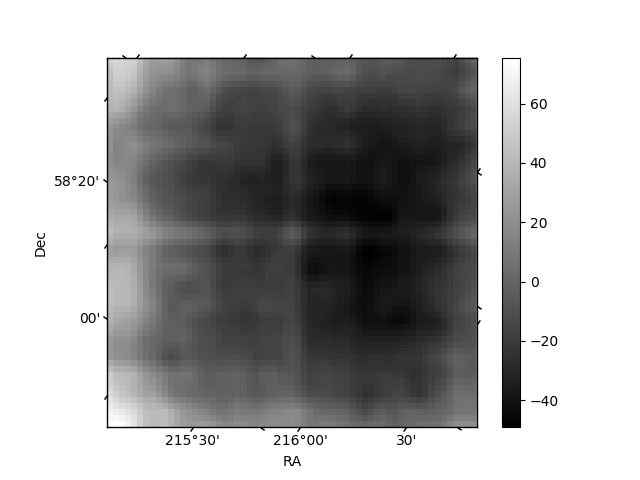
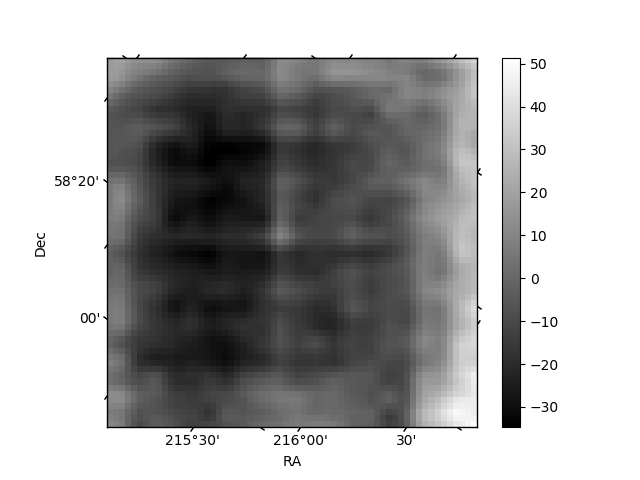
Histogram calculated using DETX and DETY for each event in the final _common_clean file
| Quadrant A | 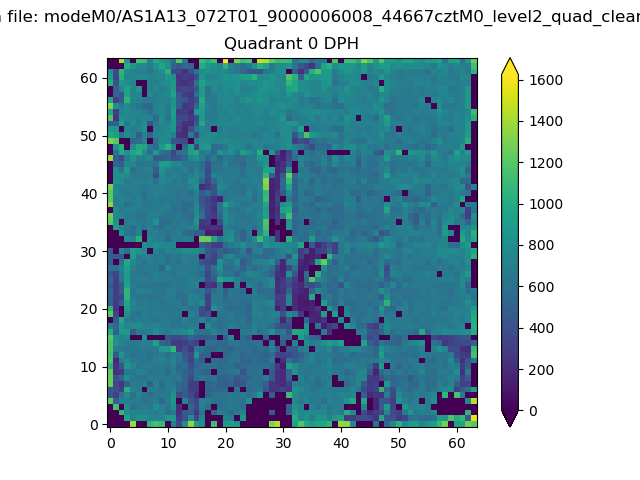 |
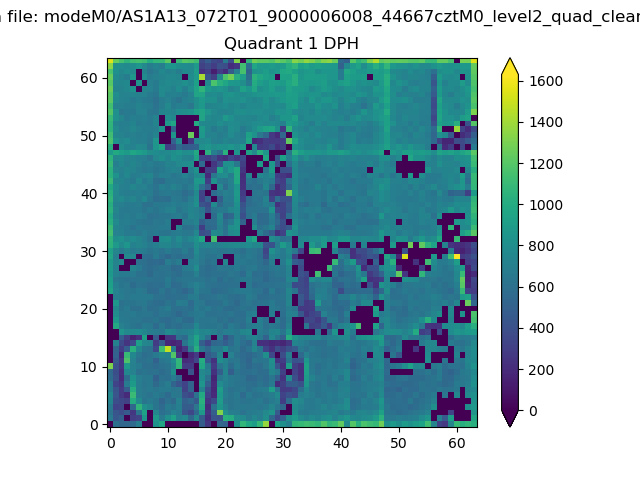 |
Quadrant B |
|---|---|---|---|
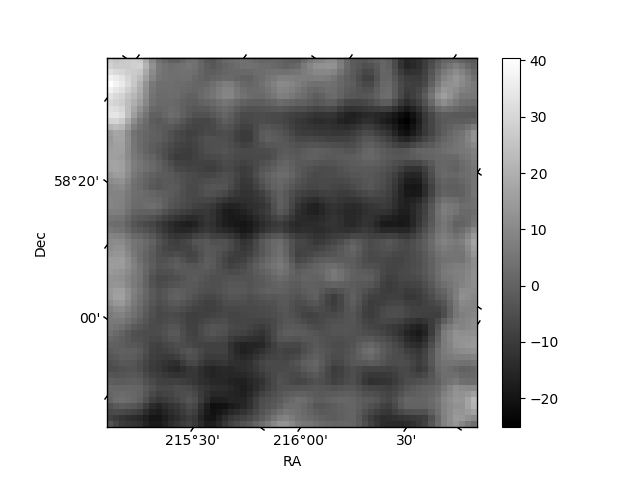
| Quadrant D | 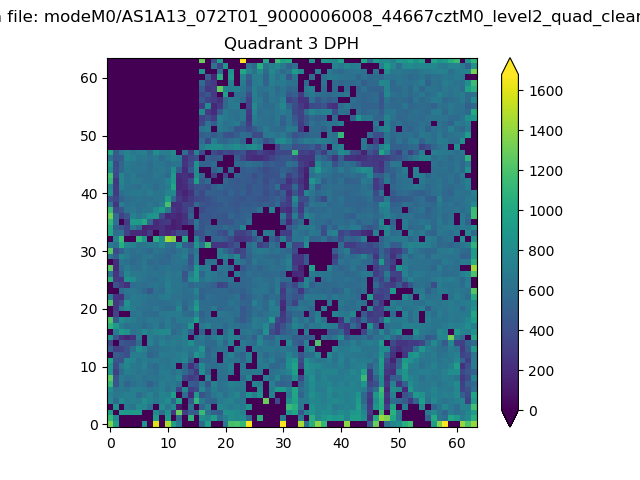 |
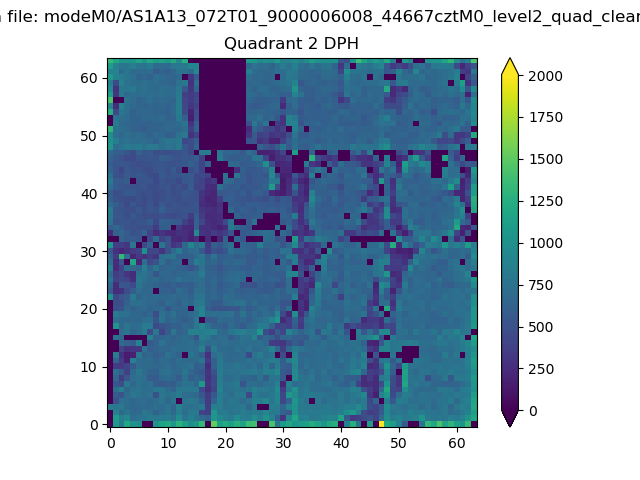 |
Quadrant C |
| Plot type | Count rate plots | Images |
|---|---|---|
| Comparison with Poisson distribution Blue bars denote a histogram of data divided into 1 sec bins. Red curve is a Poisson curve with rate = median count rate of data. |
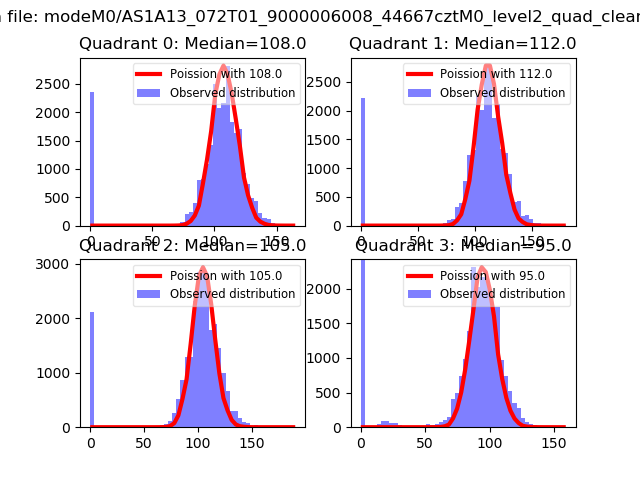 |
 |
| Quadrant-wise count rates Data is divided into 100 sec bins |
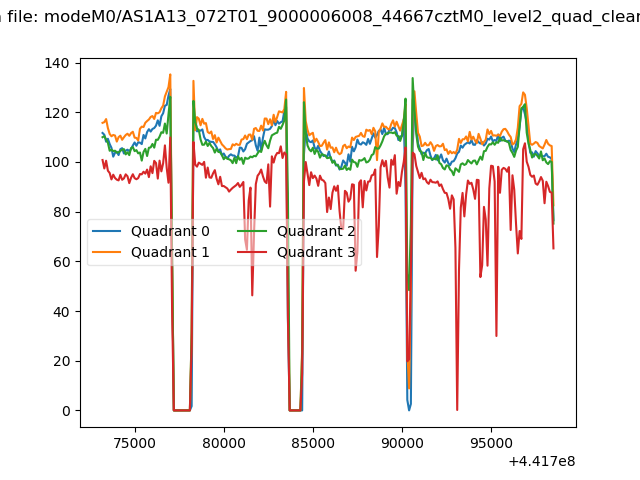 |
|
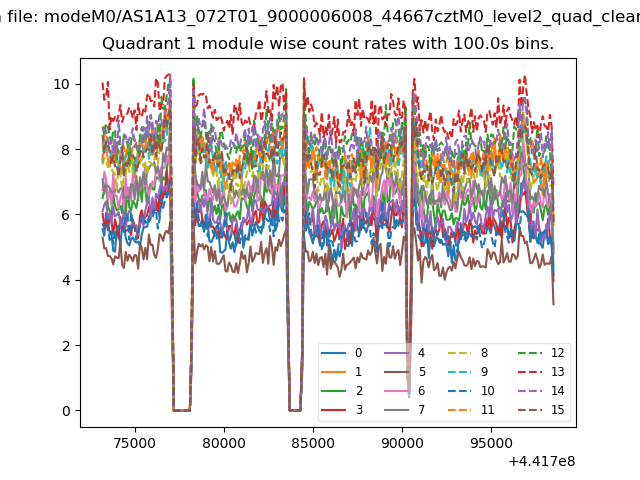
| Module-wise count rates for Quadrant A Data is divided into 100 sec bins |
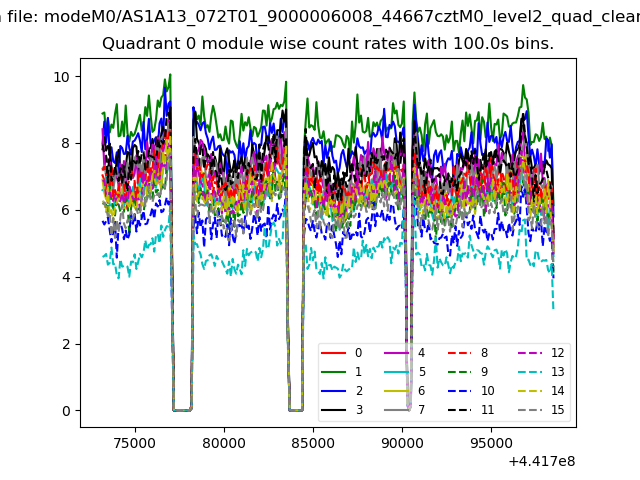 |
 |
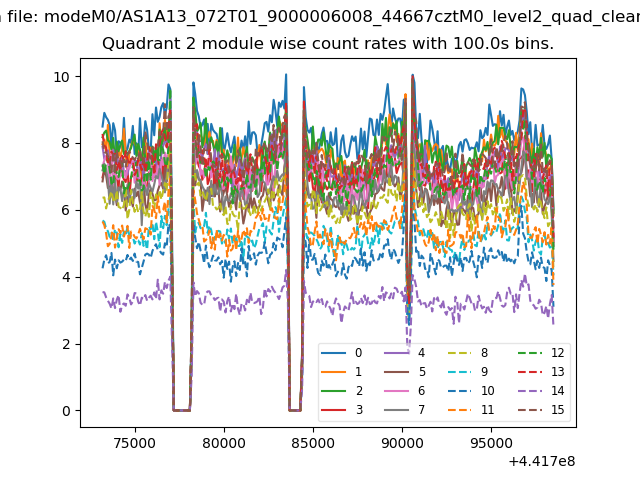
| Module-wise count rates for Quadrant B Data is divided into 100 sec bins |
 |
 |
| Module-wise count rates for Quadrant C Data is divided into 100 sec bins |
 |
 |
| Module-wise count rates for Quadrant D Data is divided into 100 sec bins |
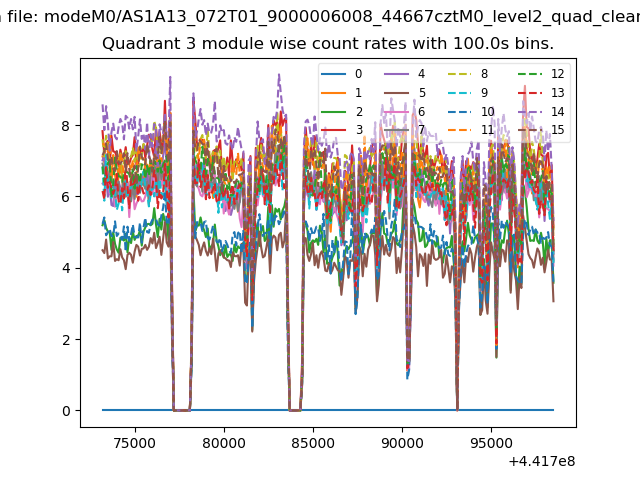 |
 |
| Parameter | Plot |
|---|---|
| CZT HV Monitor | 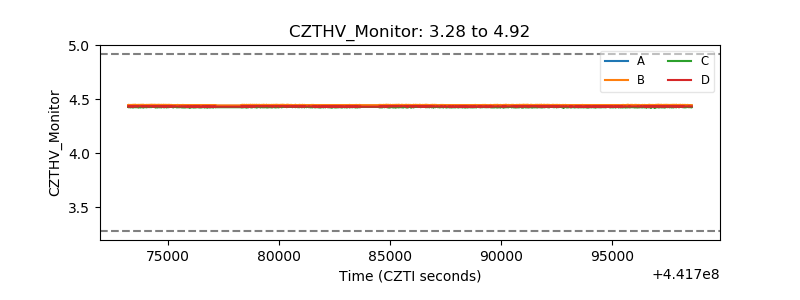 |
| D_VDD | 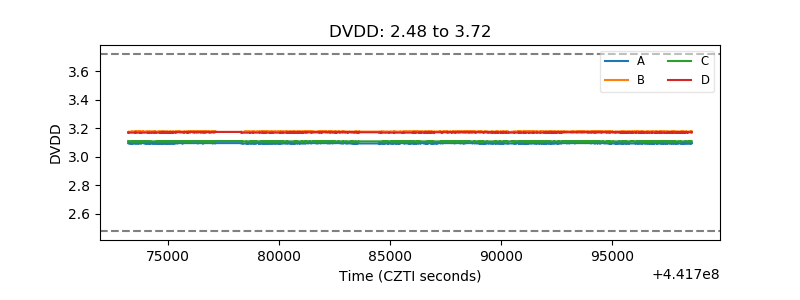 |
| Temperature 1 | 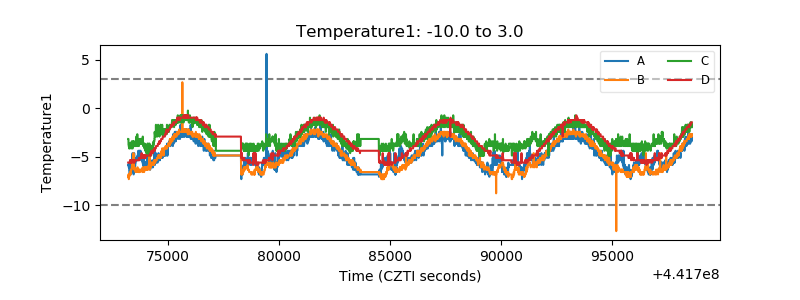 |
| Veto HV Monitor | 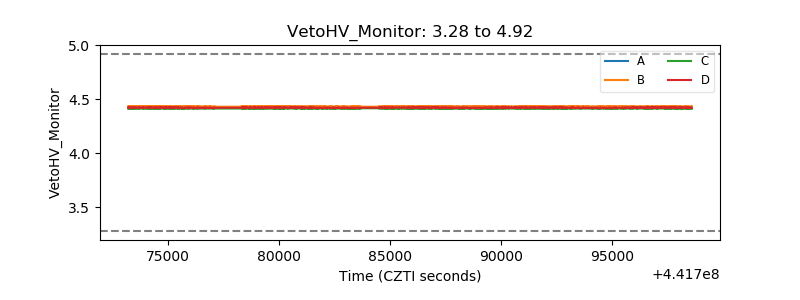 |
| Veto LLD | 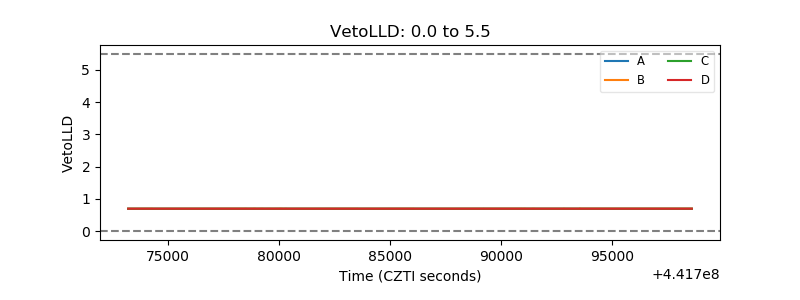 |
| Alpha Counter | 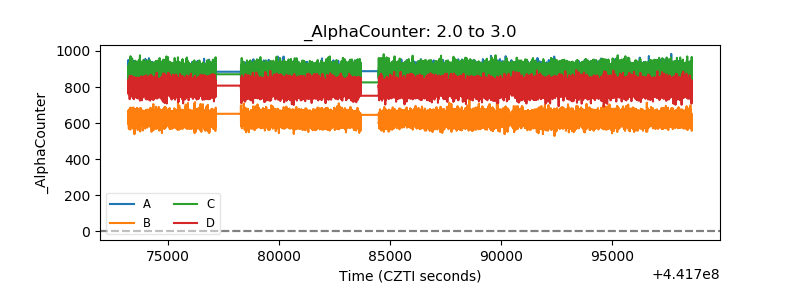 |
| _CPM_Rate | 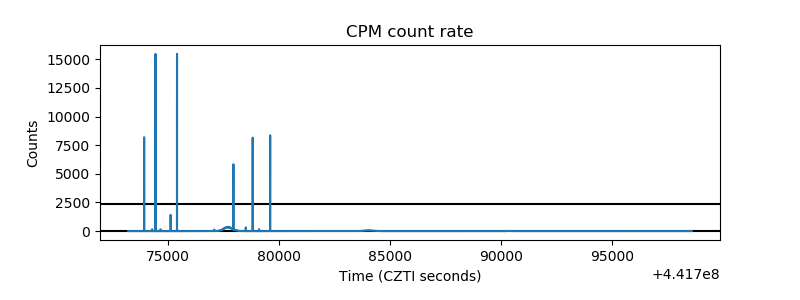 |
| CZT Counter | 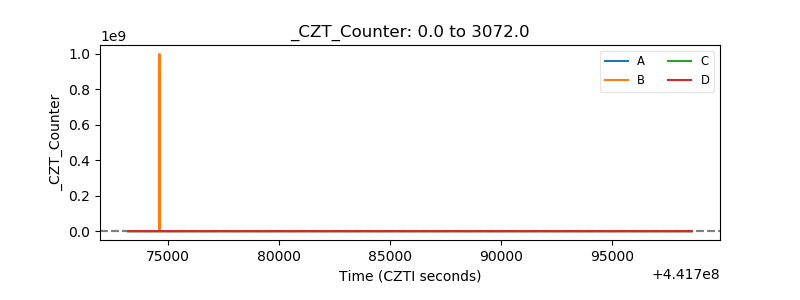 |
| +2.5 Volts monitor | 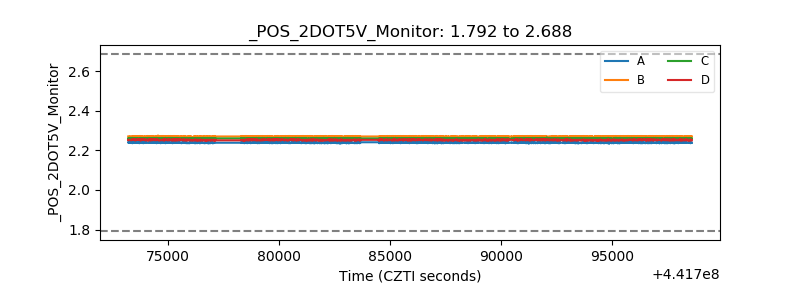 |
| +5 Volts monitor | 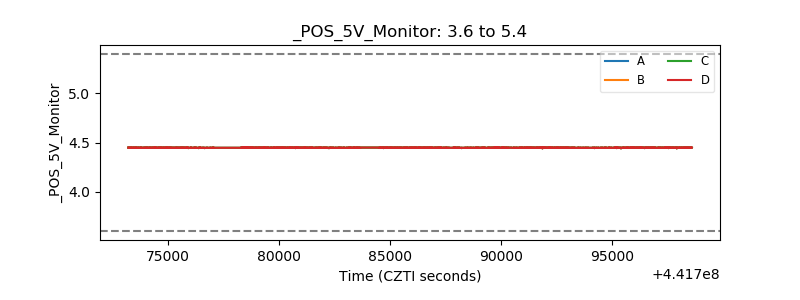 |
| _ROLL_ROT | 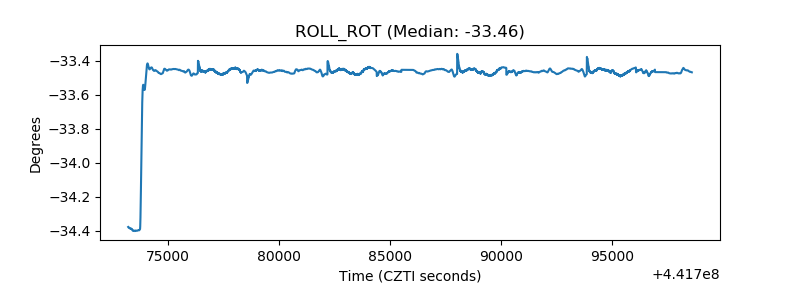 |
| _Roll_DEC | 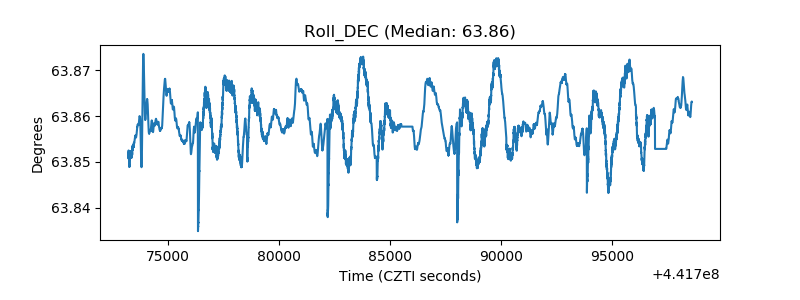 |
| _Roll_RA | 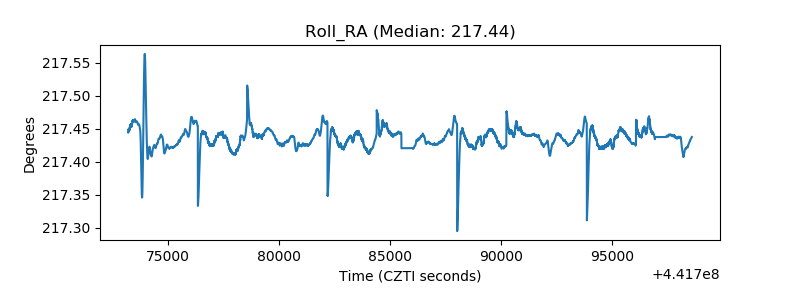 |
| Veto Counter | 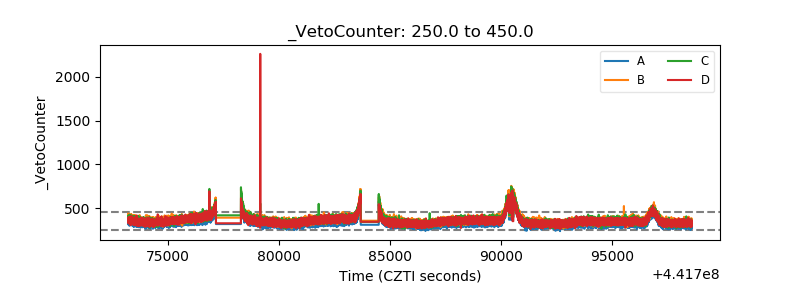 |