| Param | Original file | Final file |
|---|---|---|
| Filename | modeM0/AS1A13_072T01_9000006008_44668cztM0_level2.fits | modeM0/AS1A13_072T01_9000006008_44668cztM0_level2_quad_clean.evt |
| Size (bytes) | 548,461,440 | 116,259,840 |
| Size | 523.1 MB | 110.9 MB |
| Events in quadrant A | 5,610,591 | 787,075 |
| Events in quadrant B | 3,504,875 | 824,679 |
| Events in quadrant C | 3,361,307 | 777,418 |
| Events in quadrant D | 7,237,888 | 604,444 |
| Mode M0 | |||
|---|---|---|---|
| Quadrant | BADHDUFLAG | Total packets | Discarded packets |
| A | 0 | 23409 | 5 |
| B | 0 | 15799 | 0 |
| C | 0 | 15799 | 0 |
| D | 0 | 26868 | 0 |
| Mode SS | |||
|---|---|---|---|
| Quadrant | BADHDUFLAG | Total packets | Discarded packets |
| A | 0 | 152 | 0 |
| B | 0 | 152 | 0 |
| C | 0 | 152 | 0 |
| D | 0 | 152 | 0 |
| Quadrant | Total seconds | Saturated seconds | Saturation percentage |
|---|---|---|---|
| A | 7565 | 199 | 2.630535% |
| B | 7565 | 79 | 1.044283% |
| C | 7566 | 25 | 0.330426% |
| D | 7566 | 1291 | 17.063177% |
Noise dominated data is calculated using 1-second bins in cleaned event files. If a bin has >2000 counts, and if more than 50% of those come from <1% of pixels, then it is considered to be noise-dominated and hence unusable.
| Quadrant | # 1 sec bins | Bins with >0 counts | Bins with >2000 counts | High rate bins dominated by noise | Noise dominated (total time) | Noise dominated (detector-on time) | Marked lightcurve |
|---|---|---|---|---|---|---|---|
| A | 7565 | 7565 | 85 | 85 | 1.12% | 1.12% | 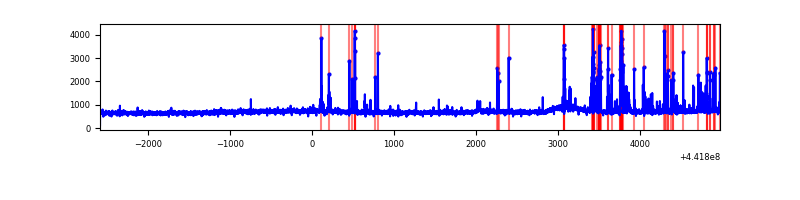 |
| B | 7565 | 7565 | 14 | 14 | 0.19% | 0.19% | 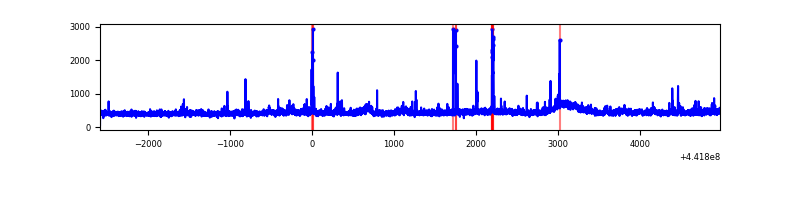 |
| C | 7566 | 7566 | 16 | 16 | 0.21% | 0.21% | 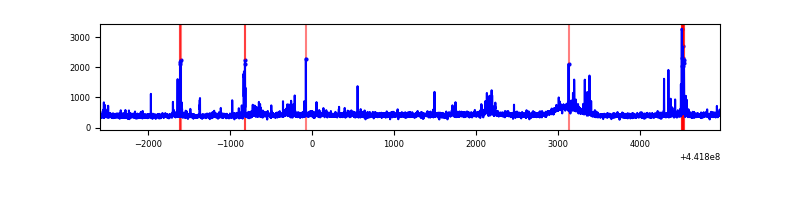 |
| D | 7566 | 7566 | 1028 | 1028 | 13.59% | 13.59% | 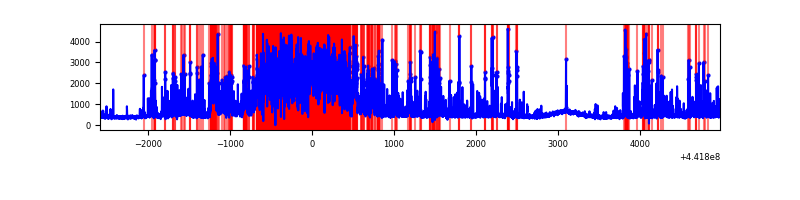 |
Top three noisy pixels from each quadrant. If the there are fewer than three noisy pixels in the level2.evt file, extra rows are filled as -1
| Pixel properties | Quadrant properties | ||||||
|---|---|---|---|---|---|---|---|
| Quadrant | DetID | PixID | Counts | Sigma | Mean | Median | Sigma |
| A | 10 | 83 | 1947298 | 11267.56 | 823 | 804 | 172.8 |
| A | 15 | 223 | 355919 | 2055.63 | 823 | 804 | 172.8 |
| A | 13 | 248 | 84173 | 482.59 | 823 | 804 | 172.8 |
| B | 0 | 183 | 104687 | 634.63 | 821 | 795 | 163.7 |
| B | 0 | 219 | 43685 | 262.0 | 821 | 795 | 163.7 |
| B | 0 | 186 | 34290 | 204.61 | 821 | 795 | 163.7 |
| C | 14 | 254 | 83096 | 441.75 | 802 | 805 | 186.3 |
| C | 3 | 233 | 80208 | 426.24 | 802 | 805 | 186.3 |
| C | 12 | 16 | 21703 | 112.18 | 802 | 805 | 186.3 |
| D | 2 | 249 | 1985965 | 10773.0 | 733 | 706 | 184.3 |
| D | 13 | 249 | 1289277 | 6992.43 | 733 | 706 | 184.3 |
| D | 1 | 52 | 500033 | 2709.6 | 733 | 706 | 184.3 |
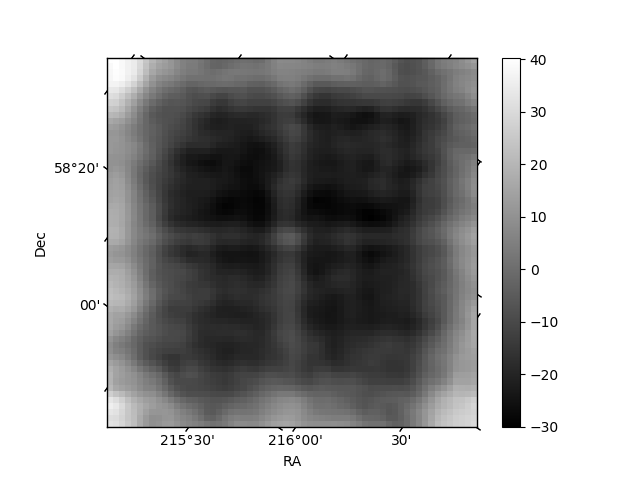
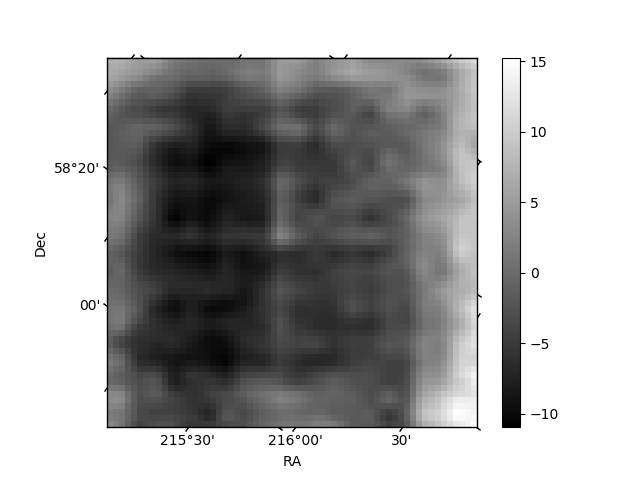
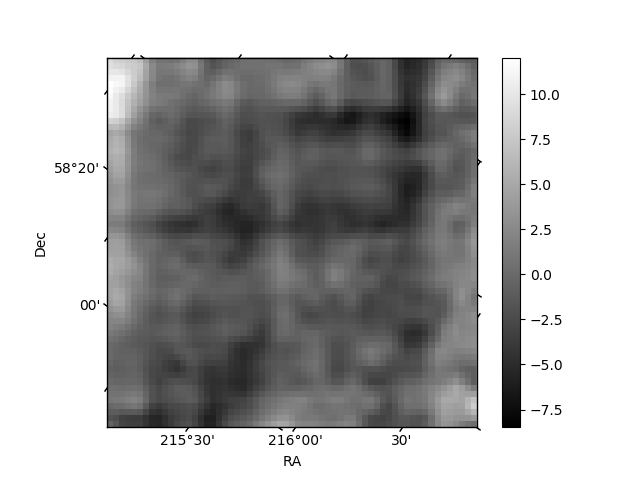
Histogram calculated using DETX and DETY for each event in the final _common_clean file
| Quadrant A | 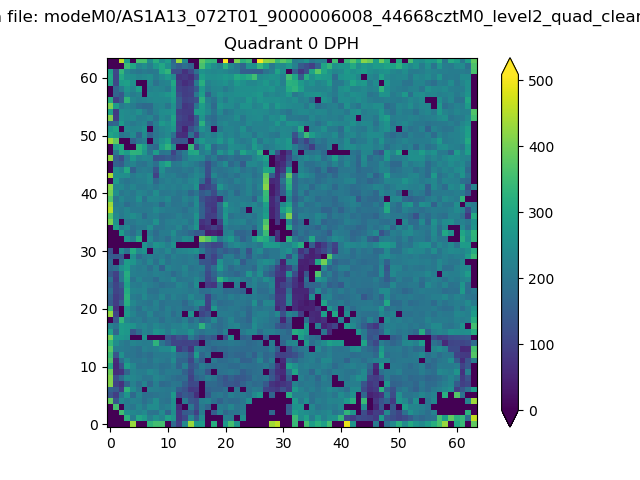 |
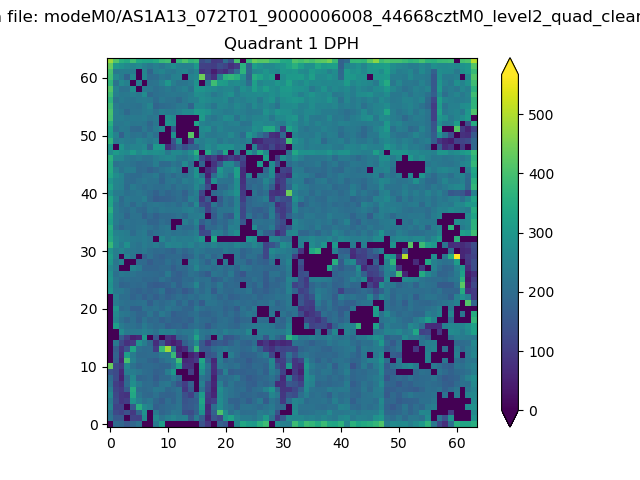 |
Quadrant B |
|---|---|---|---|
| Quadrant D | 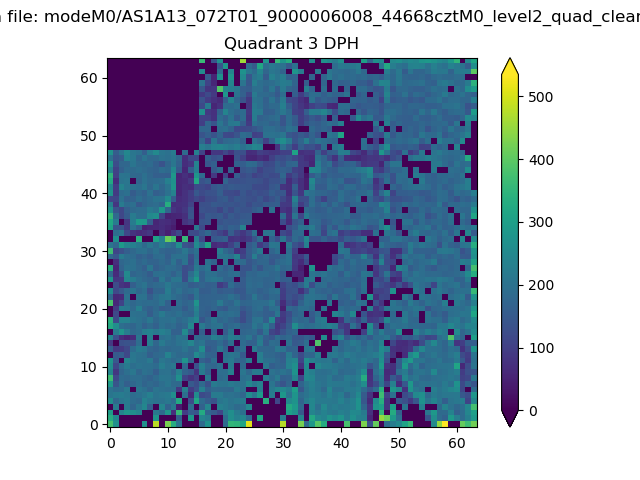 |
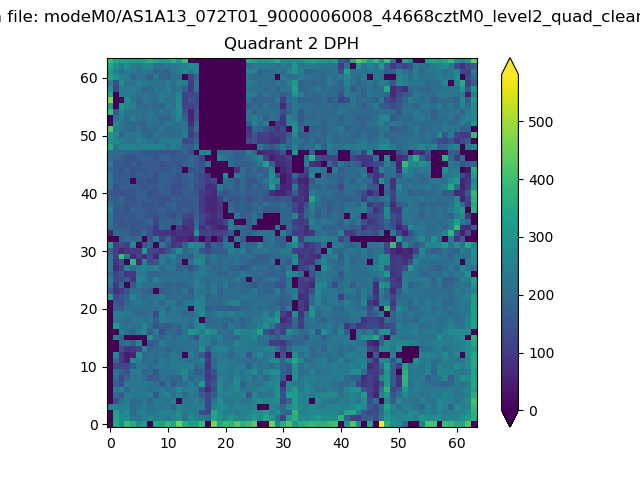 |
Quadrant C |
| Plot type | Count rate plots | Images |
|---|---|---|
| Comparison with Poisson distribution Blue bars denote a histogram of data divided into 1 sec bins. Red curve is a Poisson curve with rate = median count rate of data. |
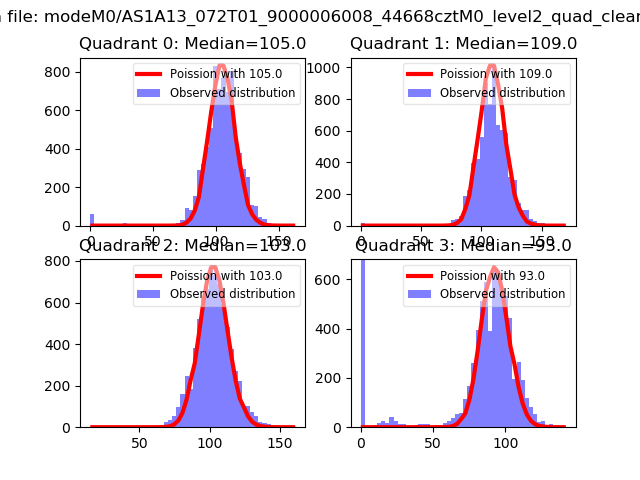 |
 |
| Quadrant-wise count rates Data is divided into 100 sec bins |
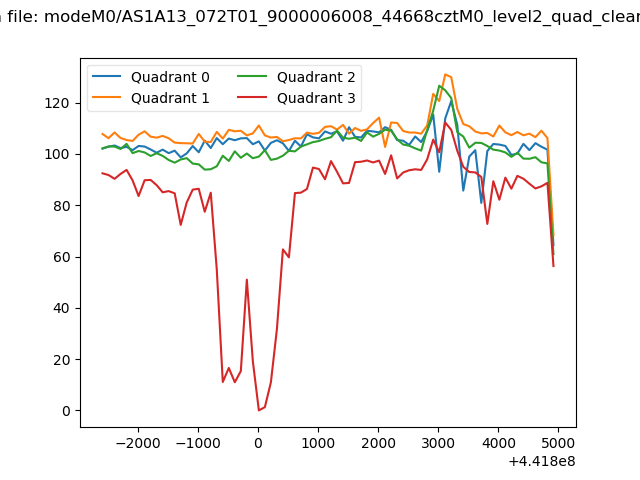 |
|
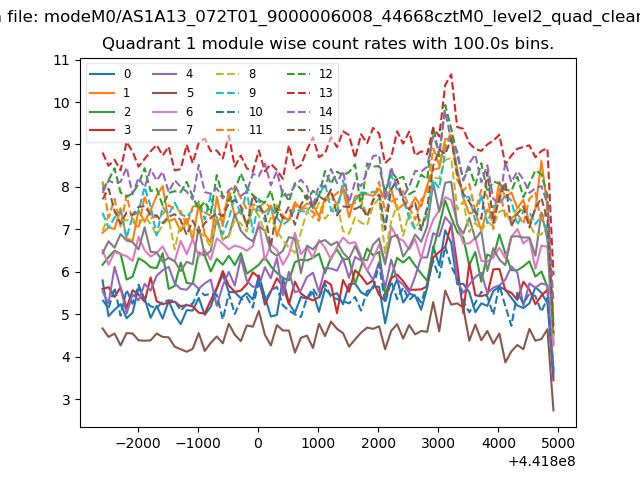
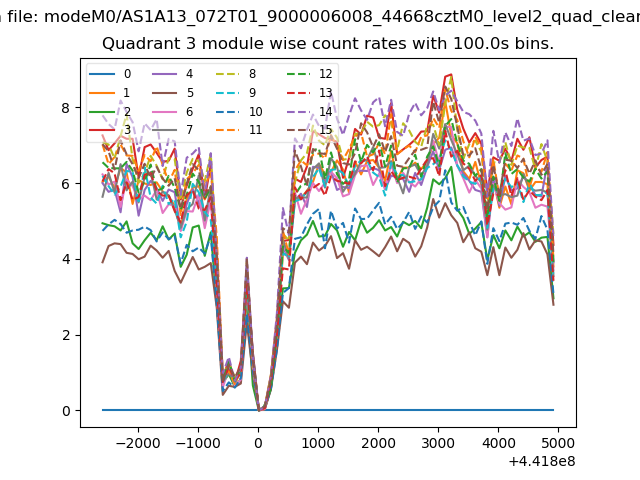
| Module-wise count rates for Quadrant A Data is divided into 100 sec bins |
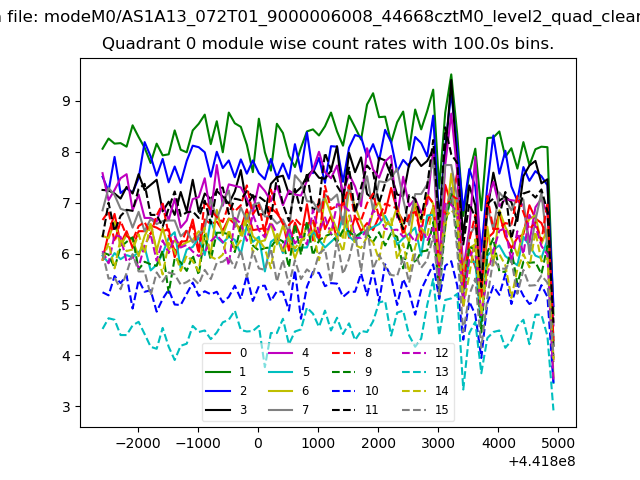 |
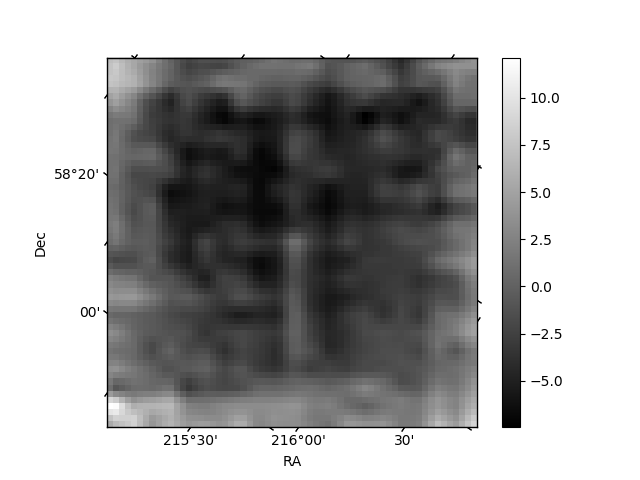 |
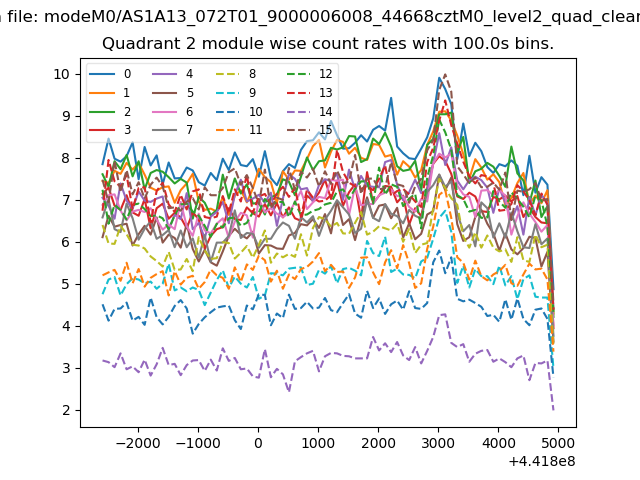
| Module-wise count rates for Quadrant B Data is divided into 100 sec bins |
 |
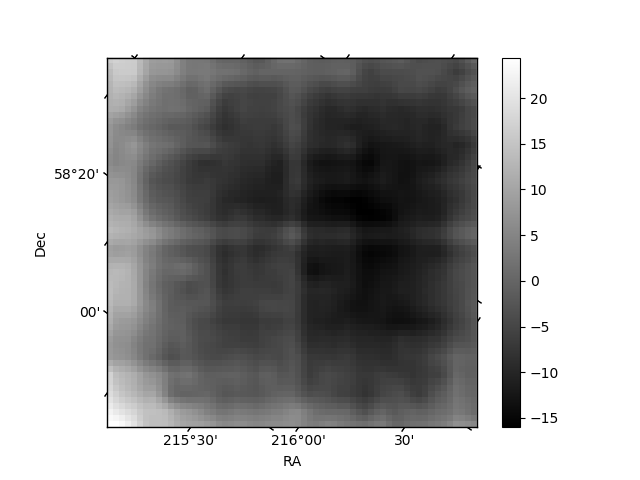 |
| Module-wise count rates for Quadrant C Data is divided into 100 sec bins |
 |
 |
| Module-wise count rates for Quadrant D Data is divided into 100 sec bins |
 |
 |
| Parameter | Plot |
|---|---|
| CZT HV Monitor | 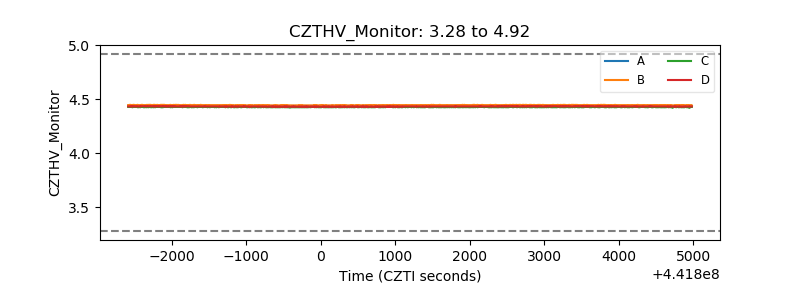 |
| D_VDD | 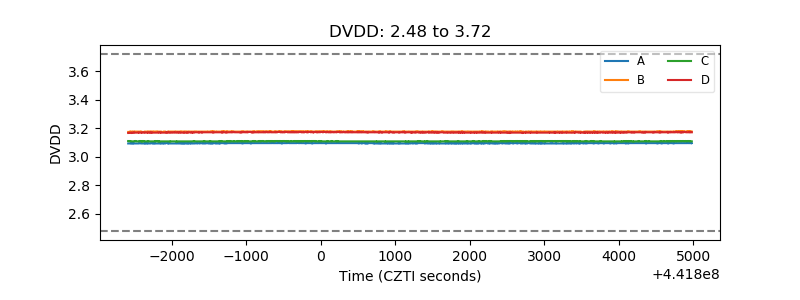 |
| Temperature 1 | 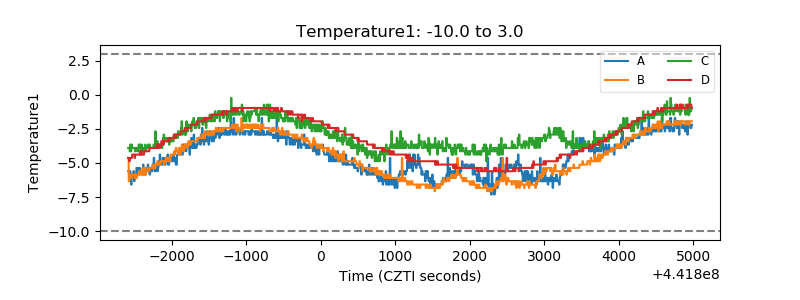 |
| Veto HV Monitor | 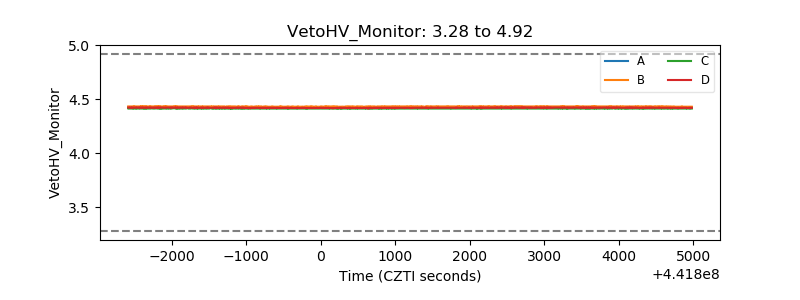 |
| Veto LLD | 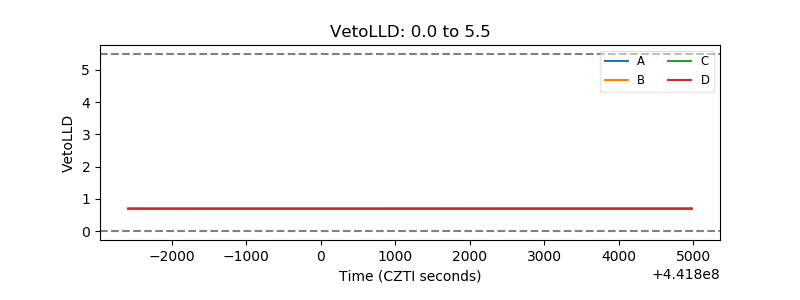 |
| Alpha Counter |  |
| _CPM_Rate | 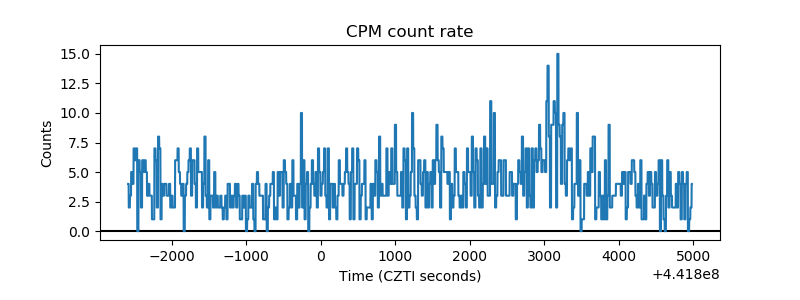 |
| CZT Counter | 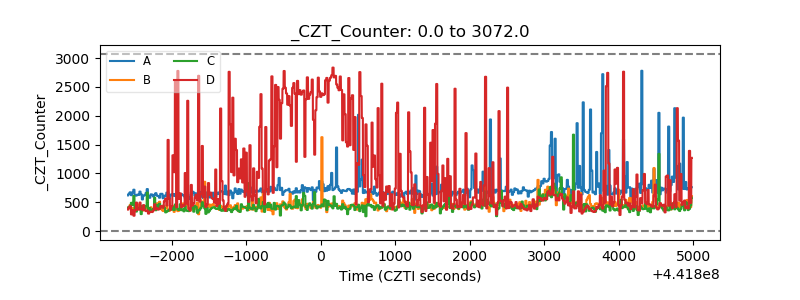 |
| +2.5 Volts monitor | 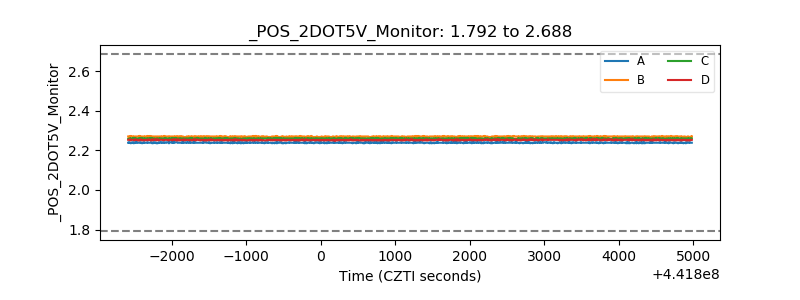 |
| +5 Volts monitor | 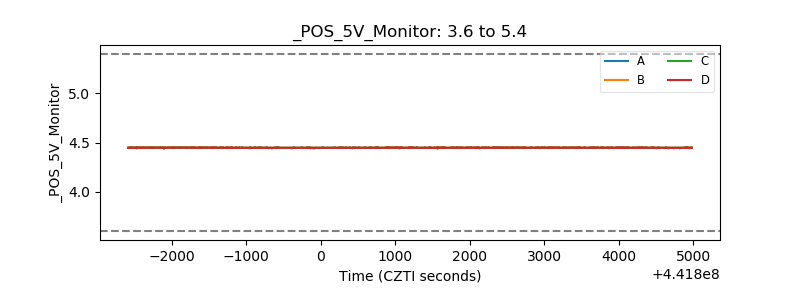 |
| _ROLL_ROT | 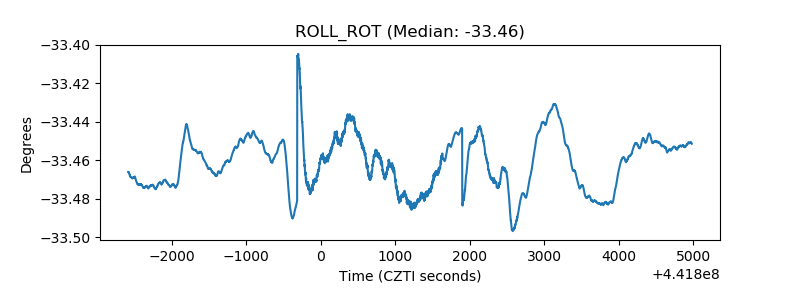 |
| _Roll_DEC | 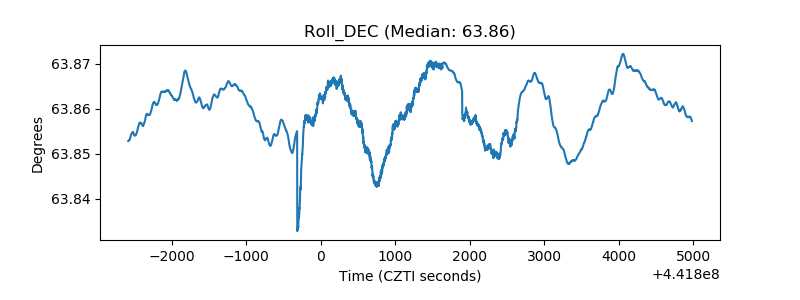 |
| _Roll_RA | 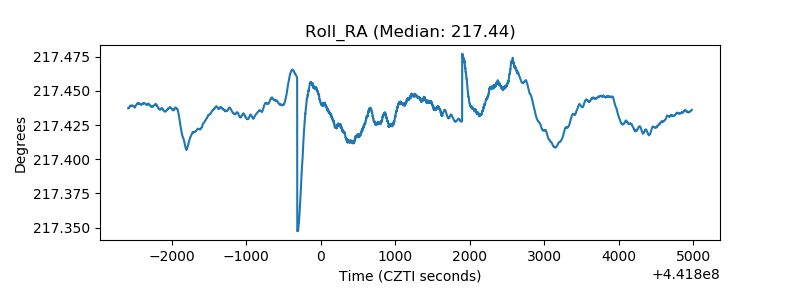 |
| Veto Counter | 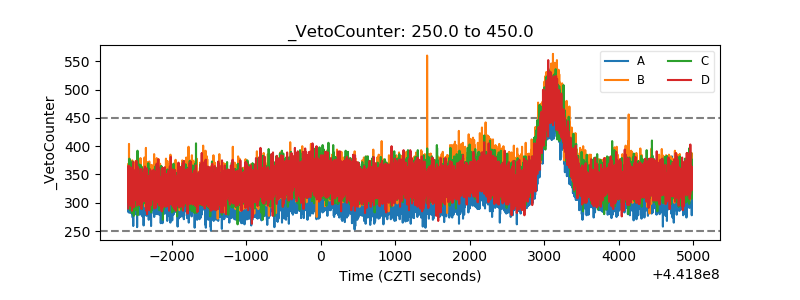 |