| Param | Original file | Final file |
|---|---|---|
| Filename | modeM0/AS1A13_072T01_9000006008_44671cztM0_level2.fits | modeM0/AS1A13_072T01_9000006008_44671cztM0_level2_quad_clean.evt |
| Size (bytes) | 1,316,211,840 | 281,566,080 |
| Size | 1.2 GB | 268.5 MB |
| Events in quadrant A | 15,261,528 | 1,817,739 |
| Events in quadrant B | 8,845,367 | 1,980,383 |
| Events in quadrant C | 8,375,681 | 1,874,769 |
| Events in quadrant D | 14,808,134 | 1,577,023 |
| Mode M0 | |||
|---|---|---|---|
| Quadrant | BADHDUFLAG | Total packets | Discarded packets |
| A | 0 | 60859 | 3 |
| B | 0 | 39342 | 3 |
| C | 0 | 38564 | 3 |
| D | 0 | 56893 | 3 |
| Mode SS | |||
|---|---|---|---|
| Quadrant | BADHDUFLAG | Total packets | Discarded packets |
| A | 0 | 376 | 0 |
| B | 0 | 376 | 0 |
| C | 0 | 376 | 0 |
| D | 0 | 376 | 0 |
| Mode M9 | |||
|---|---|---|---|
| Quadrant | BADHDUFLAG | Total packets | Discarded packets |
| A | 0 | 16 | 0 |
| B | 0 | 16 | 0 |
| C | 0 | 16 | 0 |
| D | 0 | 16 | 0 |
| Quadrant | Total seconds | Saturated seconds | Saturation percentage |
|---|---|---|---|
| A | 18500 | 1205 | 6.513514% |
| B | 18501 | 352 | 1.902600% |
| C | 18501 | 225 | 1.216150% |
| D | 18501 | 1761 | 9.518404% |
Noise dominated data is calculated using 1-second bins in cleaned event files. If a bin has >2000 counts, and if more than 50% of those come from <1% of pixels, then it is considered to be noise-dominated and hence unusable.
| Quadrant | # 1 sec bins | Bins with >0 counts | Bins with >2000 counts | High rate bins dominated by noise | Noise dominated (total time) | Noise dominated (detector-on time) | Marked lightcurve |
|---|---|---|---|---|---|---|---|
| A | 19955 | 18504 | 612 | 612 | 3.07% | 3.31% | 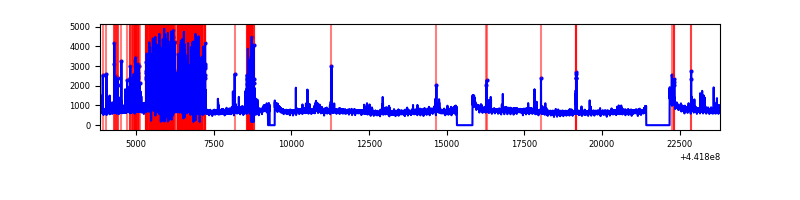 |
| B | 19956 | 18505 | 67 | 67 | 0.34% | 0.36% | 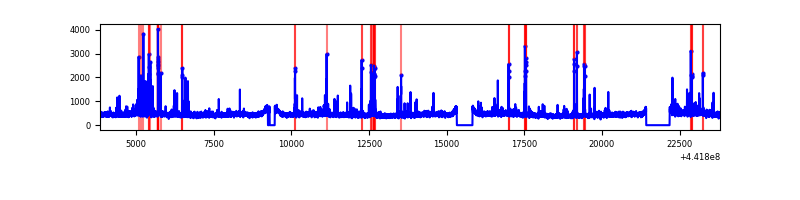 |
| C | 19956 | 18505 | 40 | 40 | 0.20% | 0.22% | 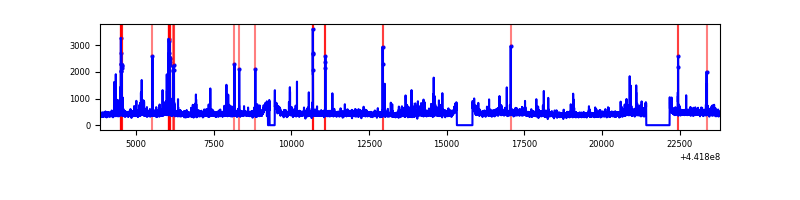 |
| D | 19956 | 18505 | 1297 | 1297 | 6.50% | 7.01% | 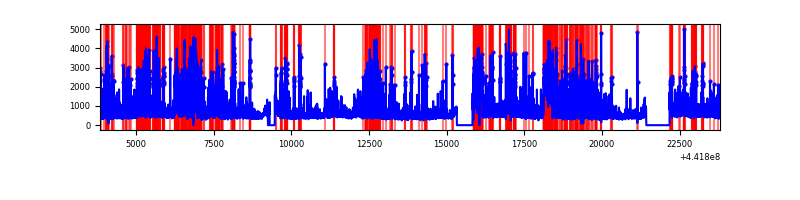 |
Top three noisy pixels from each quadrant. If the there are fewer than three noisy pixels in the level2.evt file, extra rows are filled as -1
| Pixel properties | Quadrant properties | ||||||
|---|---|---|---|---|---|---|---|
| Quadrant | DetID | PixID | Counts | Sigma | Mean | Median | Sigma |
| A | 10 | 83 | 5018730 | 12244.43 | 1990 | 1946 | 409.7 |
| A | 15 | 223 | 2320206 | 5658.16 | 1990 | 1946 | 409.7 |
| A | 7 | 3 | 119933 | 287.97 | 1990 | 1946 | 409.7 |
| B | 0 | 183 | 154261 | 386.75 | 2024 | 1957 | 393.8 |
| B | 5 | 171 | 149625 | 374.98 | 2024 | 1957 | 393.8 |
| B | 5 | 255 | 132904 | 332.52 | 2024 | 1957 | 393.8 |
| C | 14 | 254 | 163315 | 347.72 | 1990 | 1998 | 463.9 |
| C | 0 | 207 | 144992 | 308.23 | 1990 | 1998 | 463.9 |
| C | 3 | 233 | 127835 | 271.25 | 1990 | 1998 | 463.9 |
| D | 2 | 249 | 2725325 | 5694.64 | 1915 | 1853 | 478.3 |
| D | 13 | 249 | 1741733 | 3638.0 | 1915 | 1853 | 478.3 |
| D | 1 | 52 | 1553937 | 3245.33 | 1915 | 1853 | 478.3 |
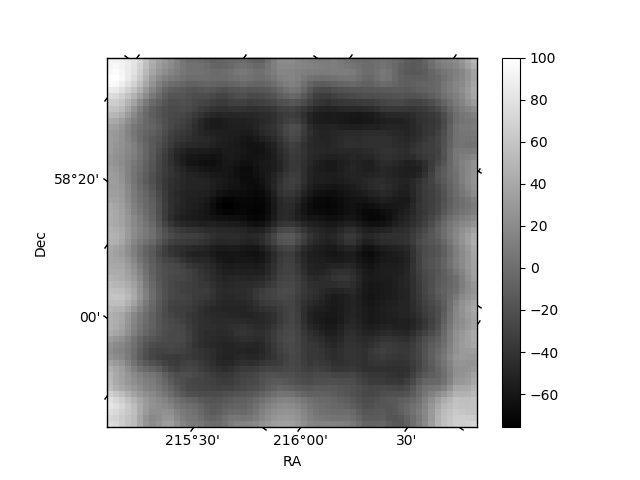
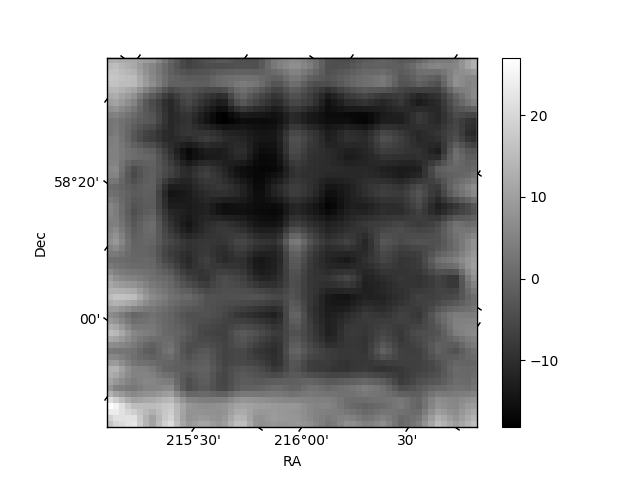
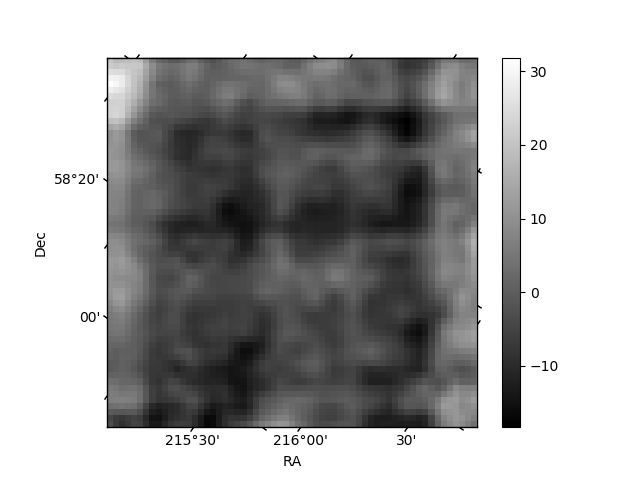
Histogram calculated using DETX and DETY for each event in the final _common_clean file
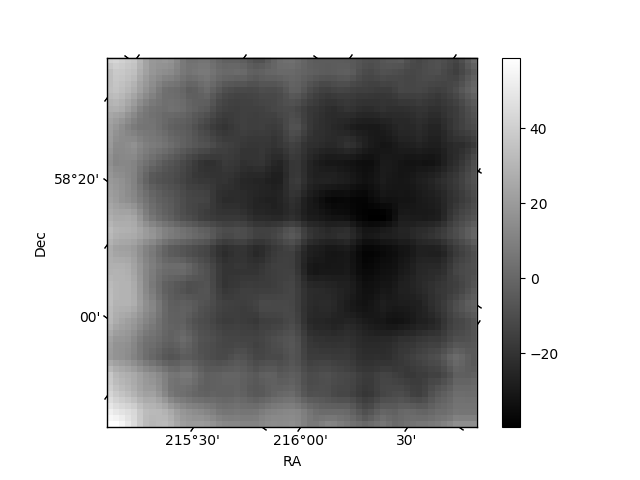
| Quadrant A | 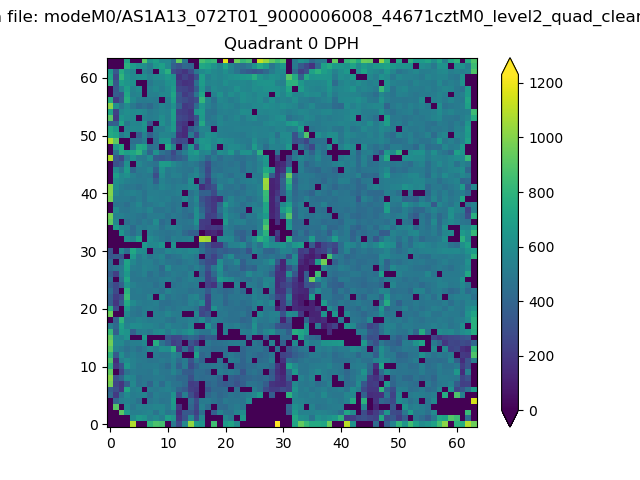 |
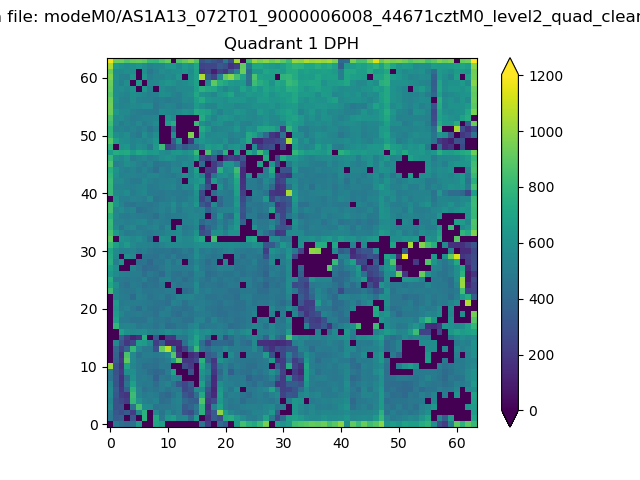 |
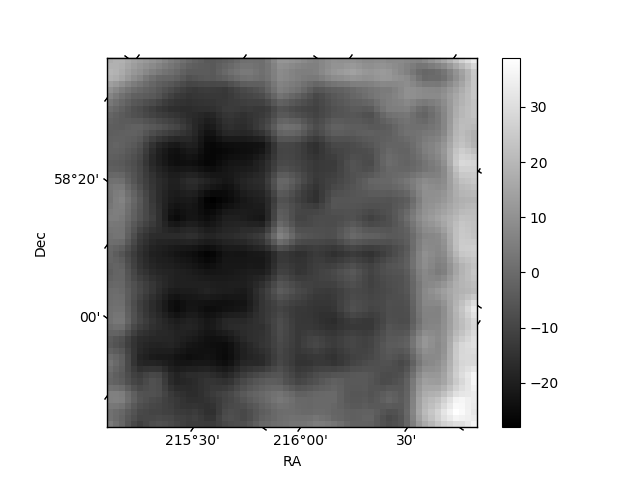
Quadrant B |
|---|---|---|---|
| Quadrant D | 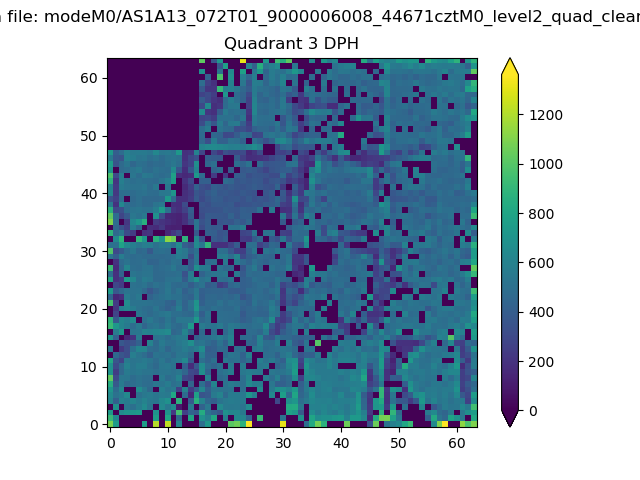 |
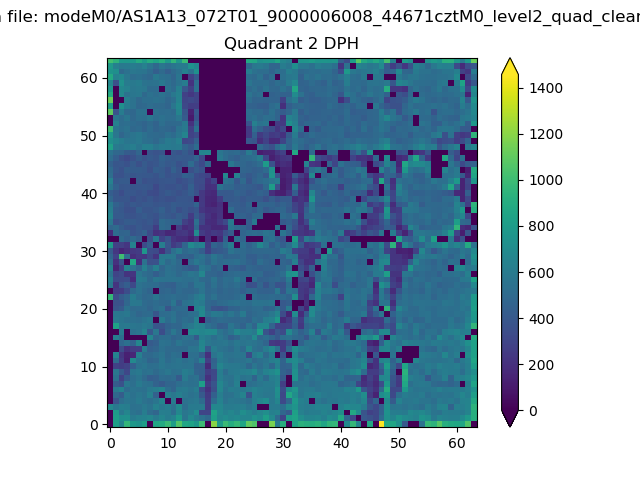 |
Quadrant C |
| Plot type | Count rate plots | Images |
|---|---|---|
| Comparison with Poisson distribution Blue bars denote a histogram of data divided into 1 sec bins. Red curve is a Poisson curve with rate = median count rate of data. |
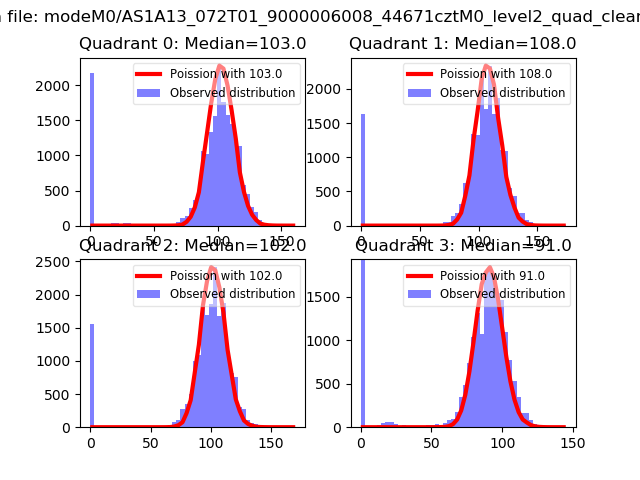 |
 |
| Quadrant-wise count rates Data is divided into 100 sec bins |
 |
|
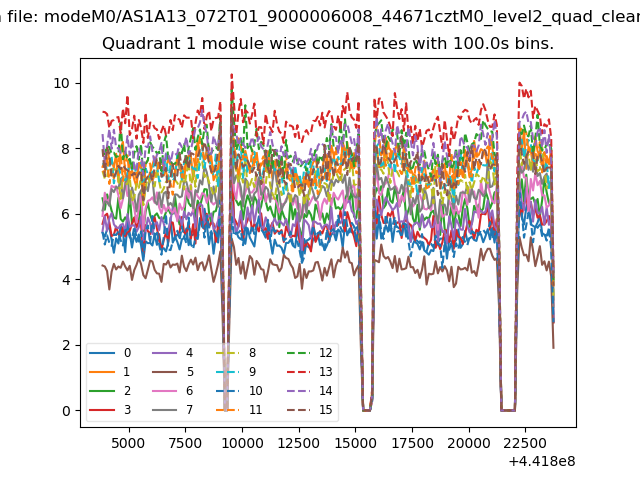
| Module-wise count rates for Quadrant A Data is divided into 100 sec bins |
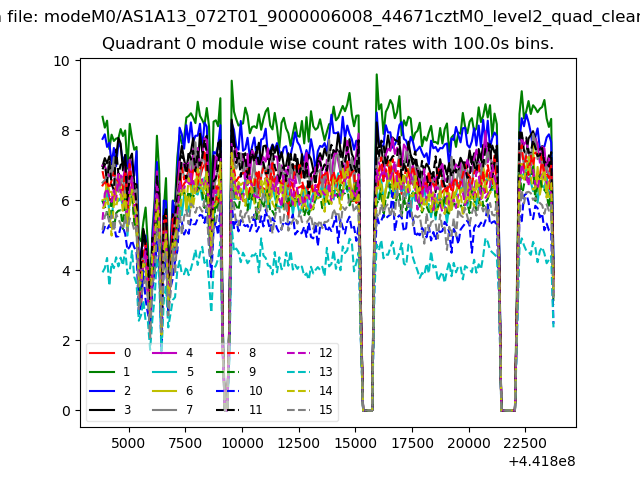 |
 |
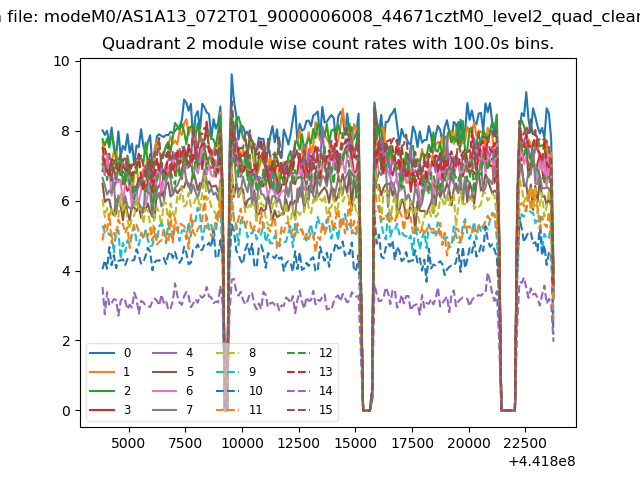
| Module-wise count rates for Quadrant B Data is divided into 100 sec bins |
 |
 |
| Module-wise count rates for Quadrant C Data is divided into 100 sec bins |
 |
 |
| Module-wise count rates for Quadrant D Data is divided into 100 sec bins |
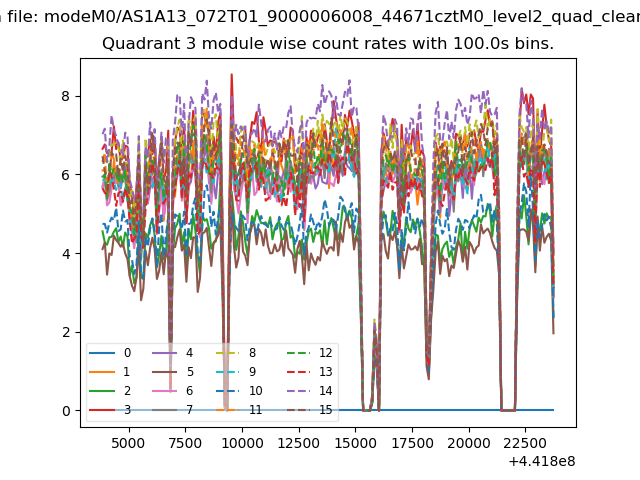 |
 |
| Parameter | Plot |
|---|---|
| CZT HV Monitor | 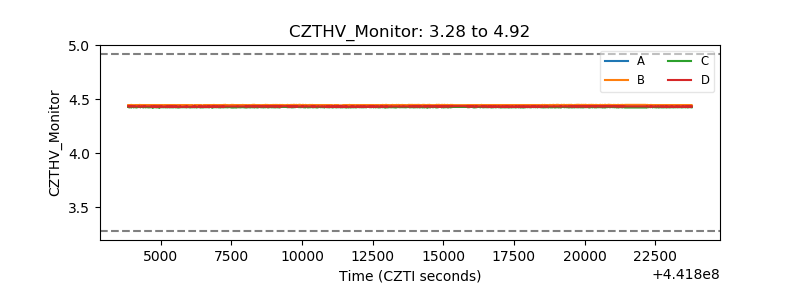 |
| D_VDD | 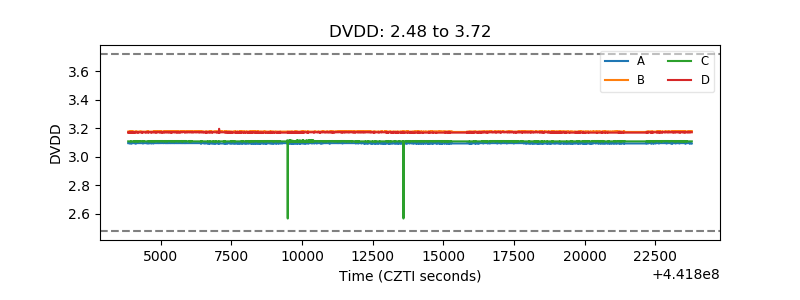 |
| Temperature 1 | 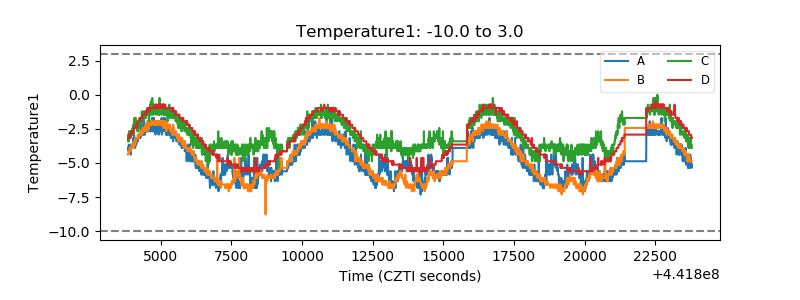 |
| Veto HV Monitor | 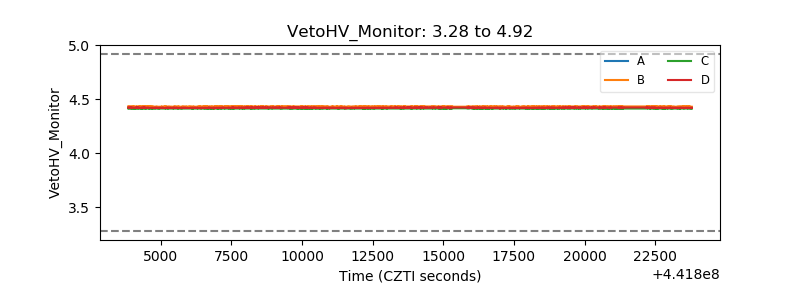 |
| Veto LLD |  |
| Alpha Counter | 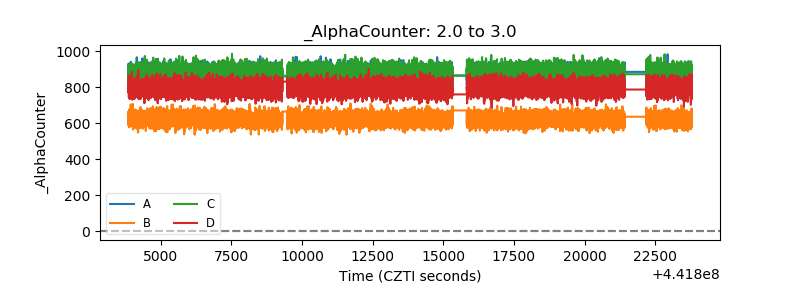 |
| _CPM_Rate | 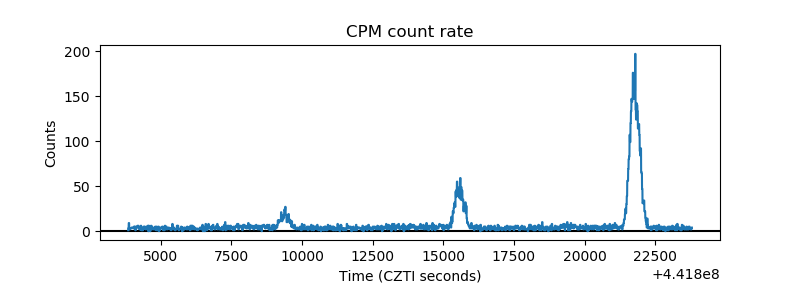 |
| CZT Counter | 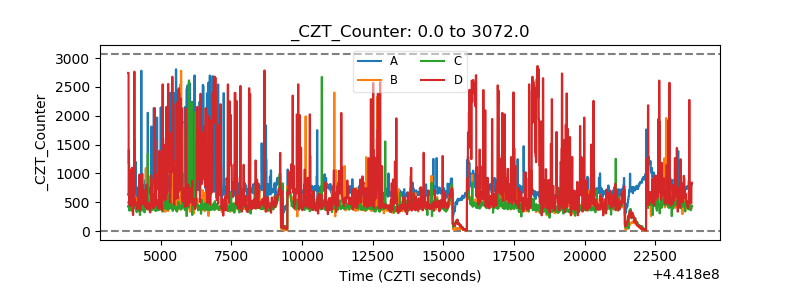 |
| +2.5 Volts monitor | 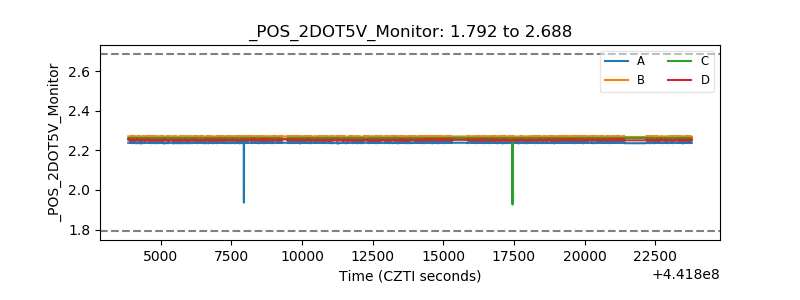 |
| +5 Volts monitor | 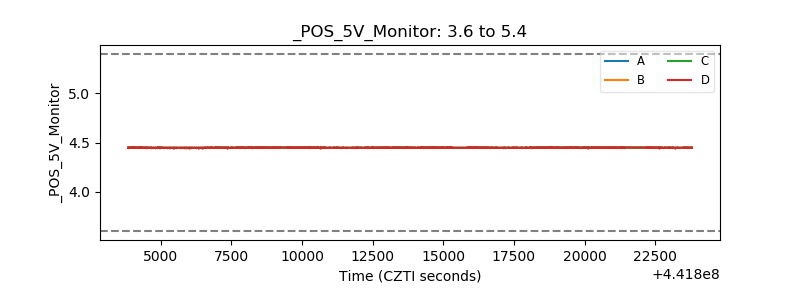 |
| _ROLL_ROT | 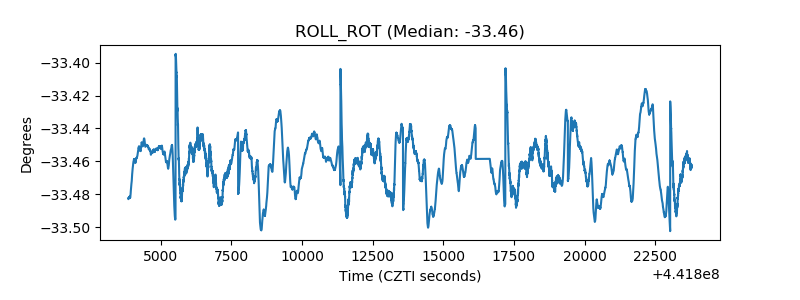 |
| _Roll_DEC | 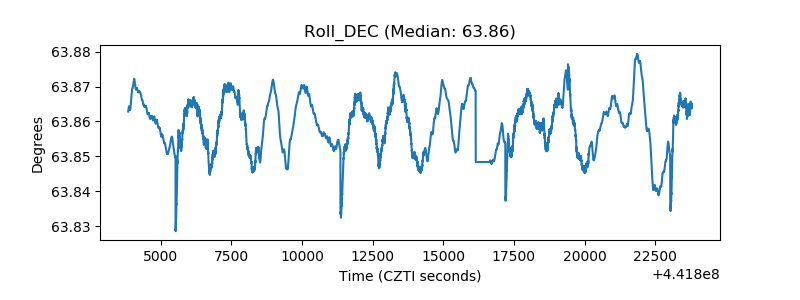 |
| _Roll_RA | 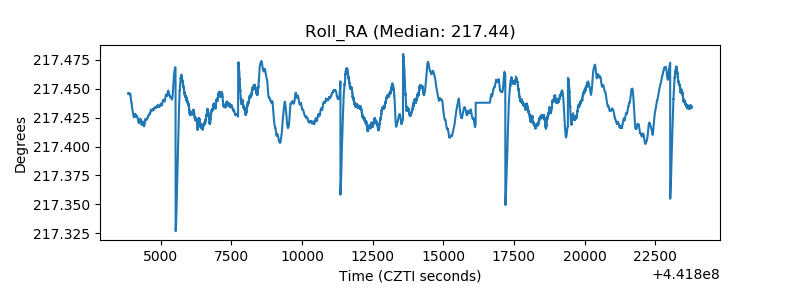 |
| Veto Counter | 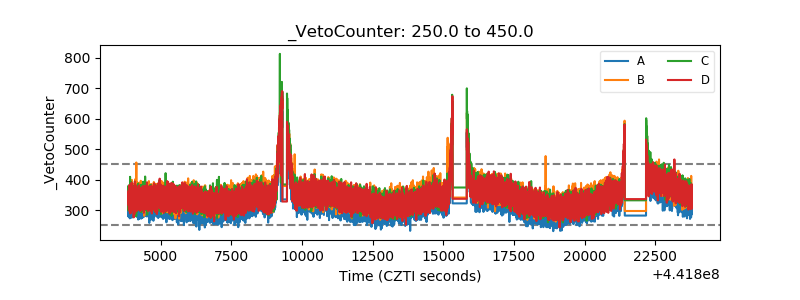 |