| Param | Original file | Final file |
|---|---|---|
| Filename | modeM0/AS1A13_072T01_9000006008_44672cztM0_level2.fits | modeM0/AS1A13_072T01_9000006008_44672cztM0_level2_quad_clean.evt |
| Size (bytes) | 488,465,280 | 108,489,600 |
| Size | 465.8 MB | 103.5 MB |
| Events in quadrant A | 5,164,386 | 728,405 |
| Events in quadrant B | 4,465,055 | 719,883 |
| Events in quadrant C | 3,074,654 | 717,761 |
| Events in quadrant D | 4,847,267 | 643,088 |
| Mode M0 | |||
|---|---|---|---|
| Quadrant | BADHDUFLAG | Total packets | Discarded packets |
| A | 0 | 20989 | 2 |
| B | 0 | 18009 | 2 |
| C | 0 | 14022 | 2 |
| D | 0 | 19167 | 2 |
| Mode SS | |||
|---|---|---|---|
| Quadrant | BADHDUFLAG | Total packets | Discarded packets |
| A | 0 | 138 | 0 |
| B | 0 | 138 | 0 |
| C | 0 | 138 | 0 |
| D | 0 | 138 | 0 |
| Mode M9 | |||
|---|---|---|---|
| Quadrant | BADHDUFLAG | Total packets | Discarded packets |
| A | 0 | 9 | 0 |
| B | 0 | 10 | 0 |
| C | 0 | 10 | 0 |
| D | 0 | 10 | 0 |
| Quadrant | Total seconds | Saturated seconds | Saturation percentage |
|---|---|---|---|
| A | 6827 | 162 | 2.372931% |
| B | 6827 | 455 | 6.664714% |
| C | 6827 | 50 | 0.732386% |
| D | 6827 | 299 | 4.379669% |
Noise dominated data is calculated using 1-second bins in cleaned event files. If a bin has >2000 counts, and if more than 50% of those come from <1% of pixels, then it is considered to be noise-dominated and hence unusable.
| Quadrant | # 1 sec bins | Bins with >0 counts | Bins with >2000 counts | High rate bins dominated by noise | Noise dominated (total time) | Noise dominated (detector-on time) | Marked lightcurve |
|---|---|---|---|---|---|---|---|
| A | 7727 | 6828 | 11 | 11 | 0.14% | 0.16% | 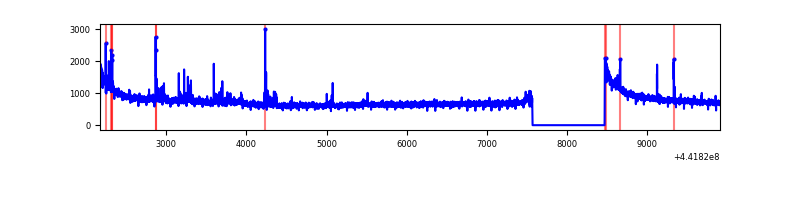 |
| B | 7727 | 6828 | 280 | 280 | 3.62% | 4.10% | 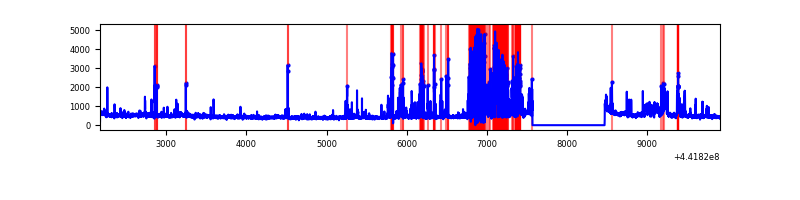 |
| C | 7727 | 6828 | 5 | 5 | 0.06% | 0.07% | 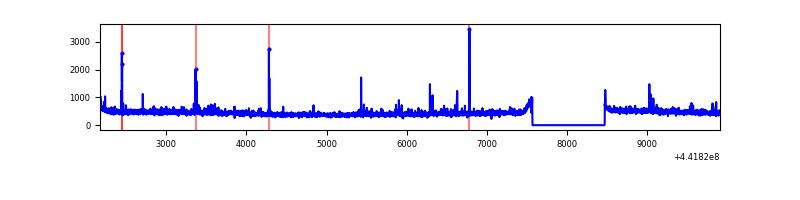 |
| D | 7727 | 6828 | 183 | 183 | 2.37% | 2.68% | 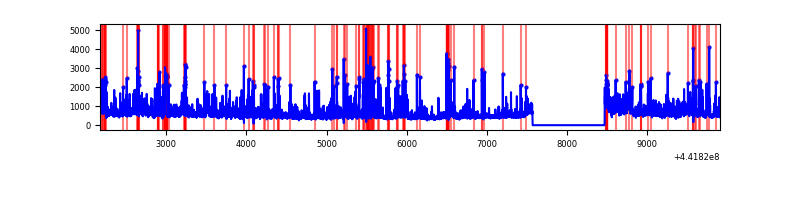 |
Top three noisy pixels from each quadrant. If the there are fewer than three noisy pixels in the level2.evt file, extra rows are filled as -1
| Pixel properties | Quadrant properties | ||||||
|---|---|---|---|---|---|---|---|
| Quadrant | DetID | PixID | Counts | Sigma | Mean | Median | Sigma |
| A | 10 | 83 | 2092668 | 13215.54 | 763 | 747 | 158.3 |
| A | 13 | 248 | 71933 | 449.71 | 763 | 747 | 158.3 |
| A | 15 | 223 | 27717 | 170.38 | 763 | 747 | 158.3 |
| B | 0 | 189 | 1190294 | 8116.43 | 743 | 721 | 146.6 |
| B | 0 | 183 | 118566 | 804.05 | 743 | 721 | 146.6 |
| B | 0 | 186 | 72582 | 490.31 | 743 | 721 | 146.6 |
| C | 14 | 254 | 47479 | 265.14 | 753 | 759 | 176.2 |
| C | 3 | 233 | 31939 | 176.95 | 753 | 759 | 176.2 |
| C | 2 | 14 | 26610 | 146.71 | 753 | 759 | 176.2 |
| D | 1 | 52 | 892956 | 4733.44 | 744 | 721 | 188.5 |
| D | 13 | 249 | 387340 | 2051.07 | 744 | 721 | 188.5 |
| D | 2 | 249 | 241105 | 1275.27 | 744 | 721 | 188.5 |
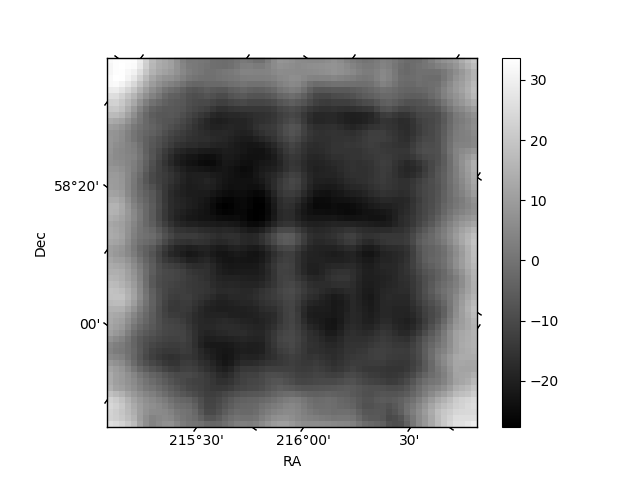
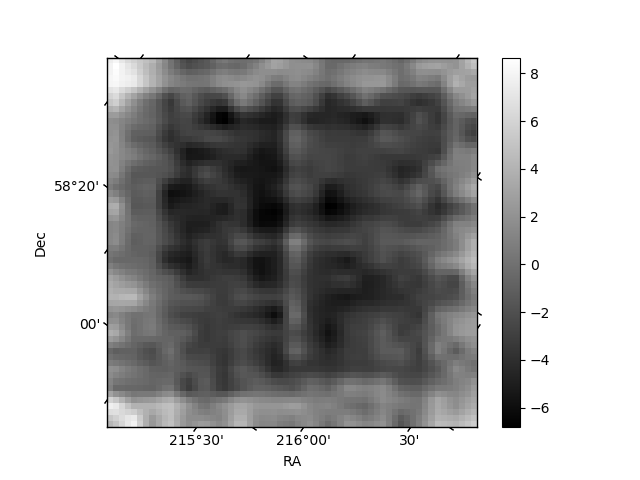
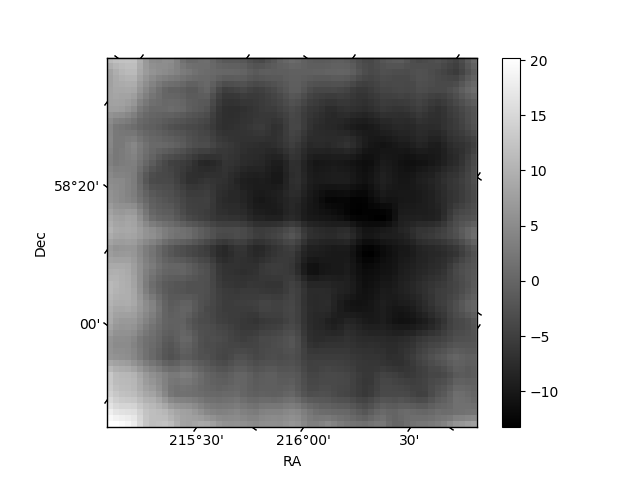
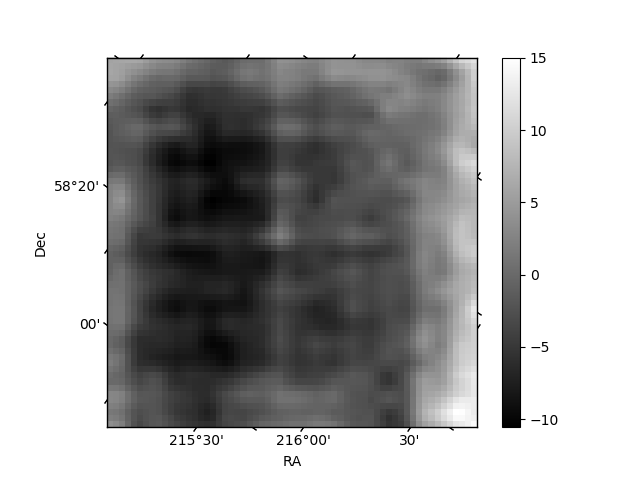
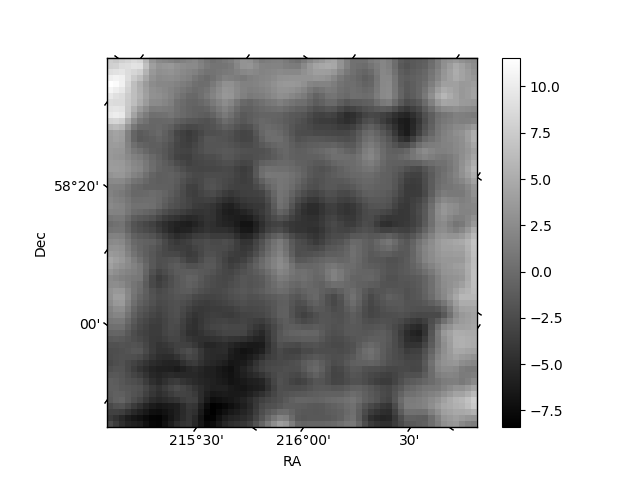
Histogram calculated using DETX and DETY for each event in the final _common_clean file
| Quadrant A | 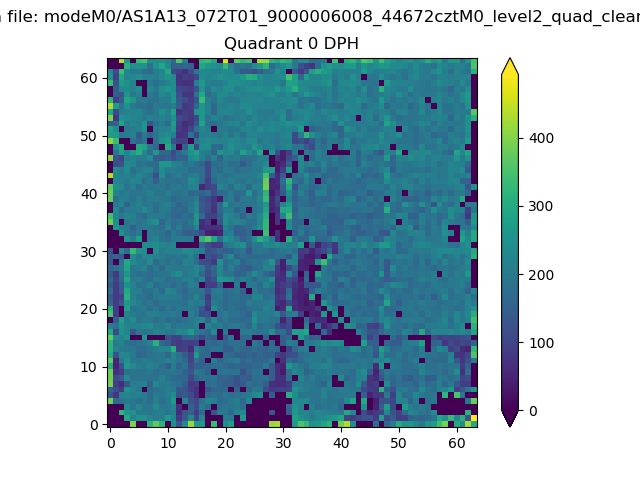 |
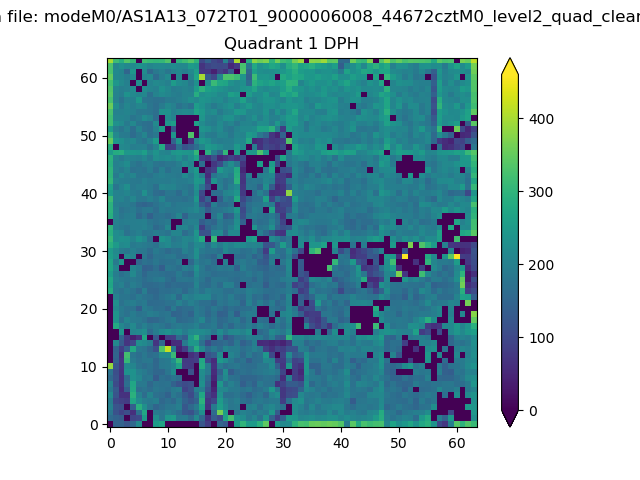 |
Quadrant B |
|---|---|---|---|
| Quadrant D | 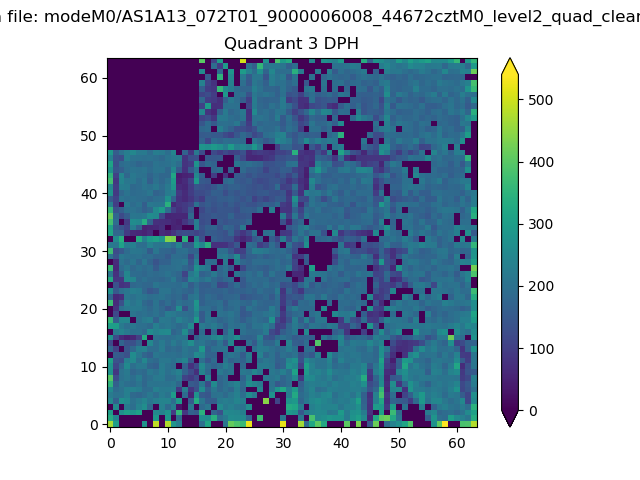 |
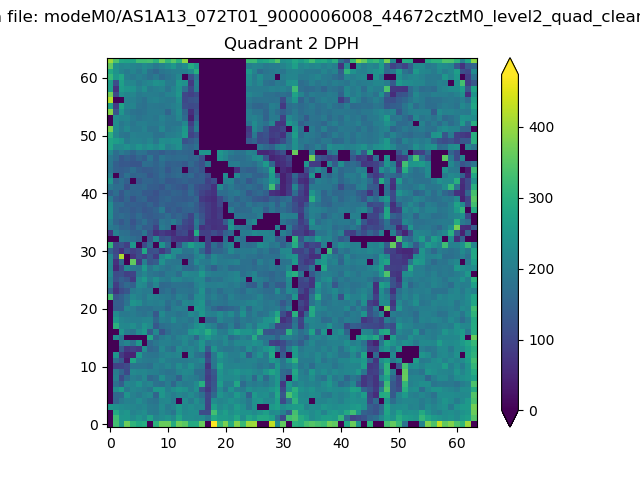 |
Quadrant C |
| Plot type | Count rate plots | Images |
|---|---|---|
| Comparison with Poisson distribution Blue bars denote a histogram of data divided into 1 sec bins. Red curve is a Poisson curve with rate = median count rate of data. |
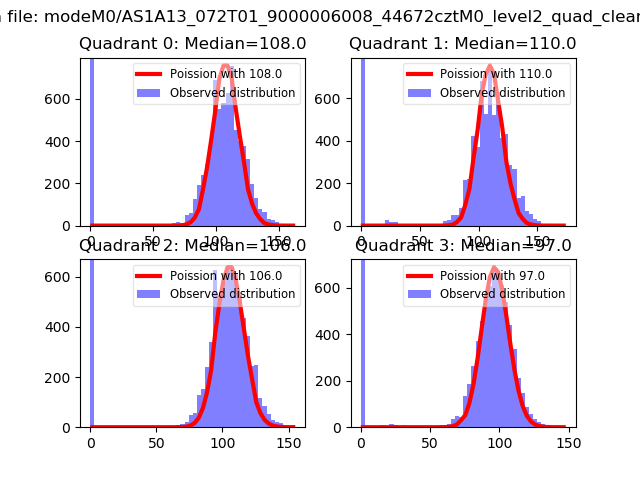 |
 |
| Quadrant-wise count rates Data is divided into 100 sec bins |
 |
|
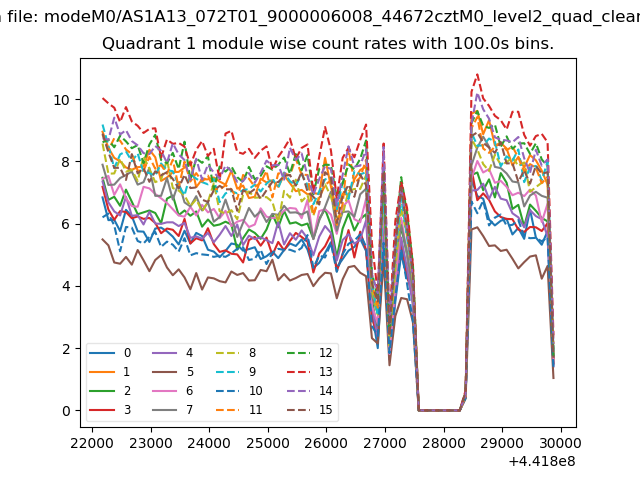
| Module-wise count rates for Quadrant A Data is divided into 100 sec bins |
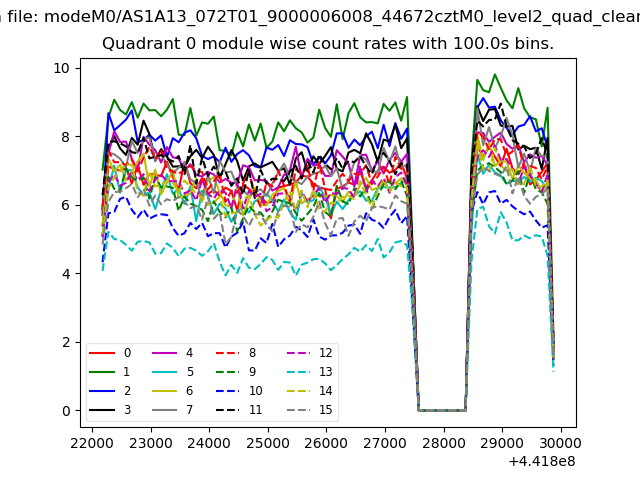 |
 |
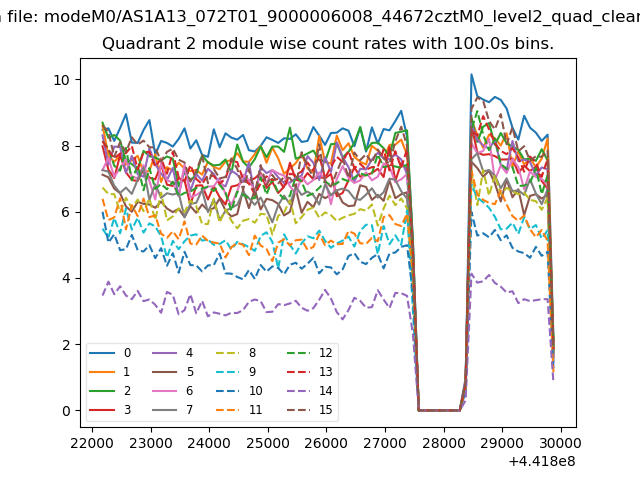
| Module-wise count rates for Quadrant B Data is divided into 100 sec bins |
 |
 |
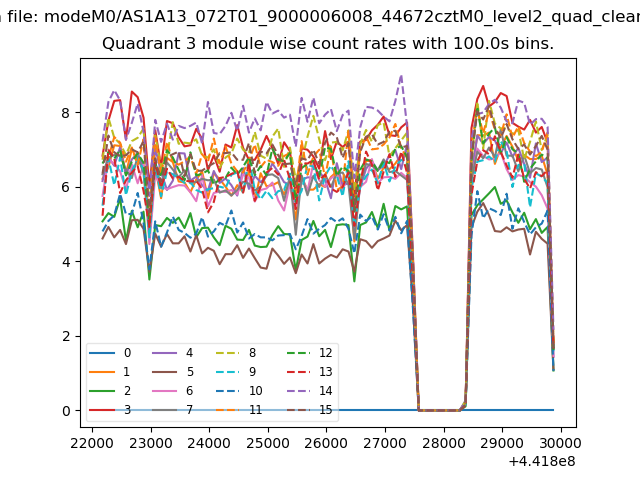
| Module-wise count rates for Quadrant C Data is divided into 100 sec bins |
 |
 |
| Module-wise count rates for Quadrant D Data is divided into 100 sec bins |
 |
 |
| Parameter | Plot |
|---|---|
| CZT HV Monitor | 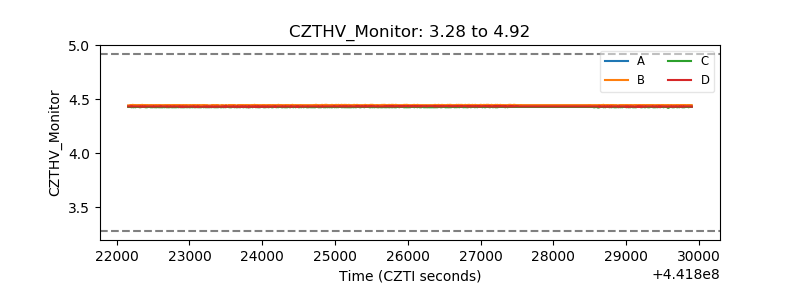 |
| D_VDD | 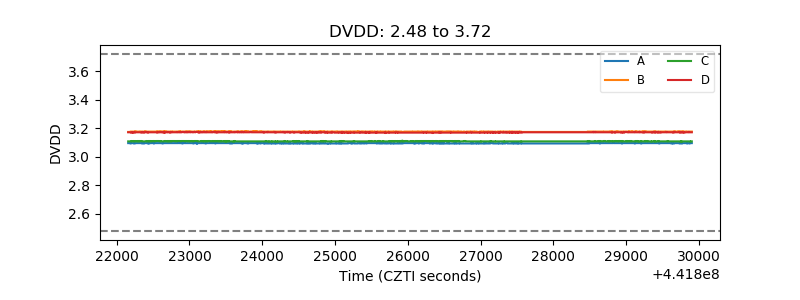 |
| Temperature 1 | 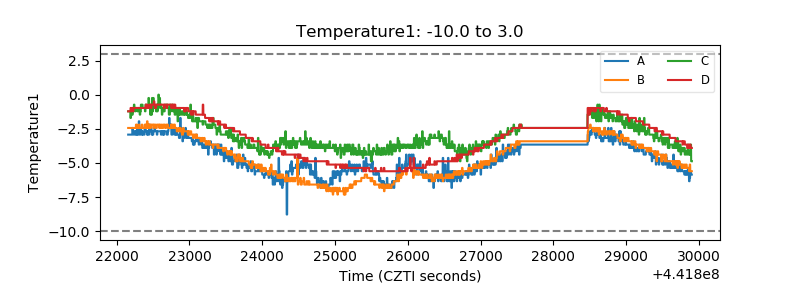 |
| Veto HV Monitor | 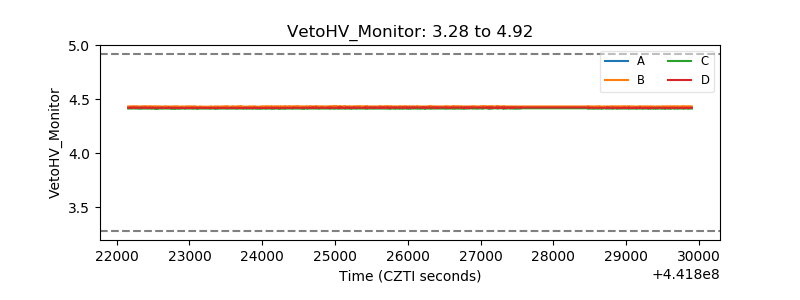 |
| Veto LLD |  |
| Alpha Counter | 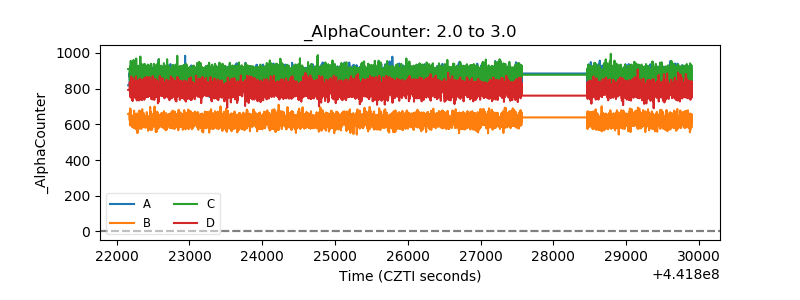 |
| _CPM_Rate | 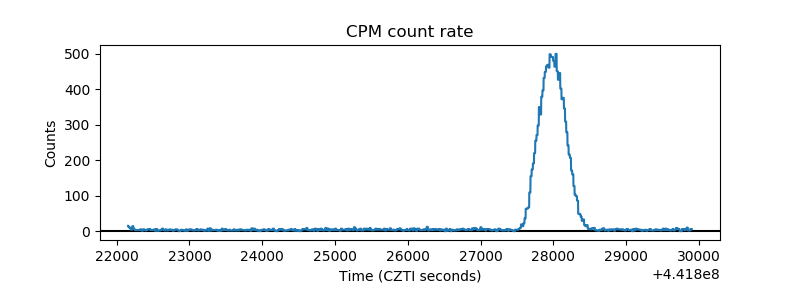 |
| CZT Counter | 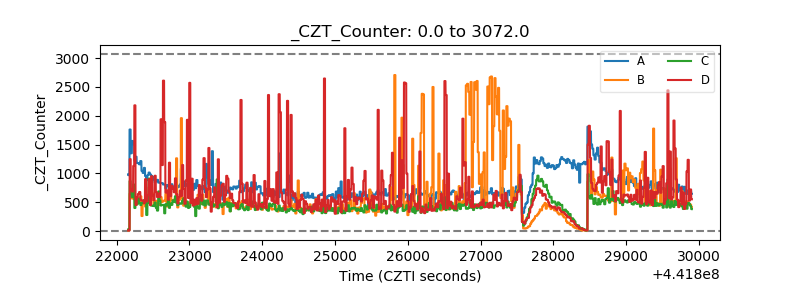 |
| +2.5 Volts monitor | 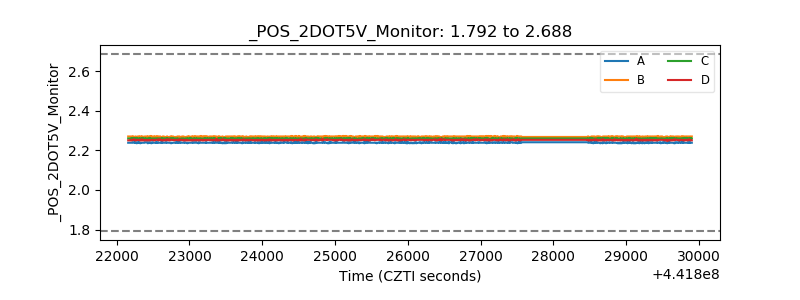 |
| +5 Volts monitor |  |
| _ROLL_ROT | 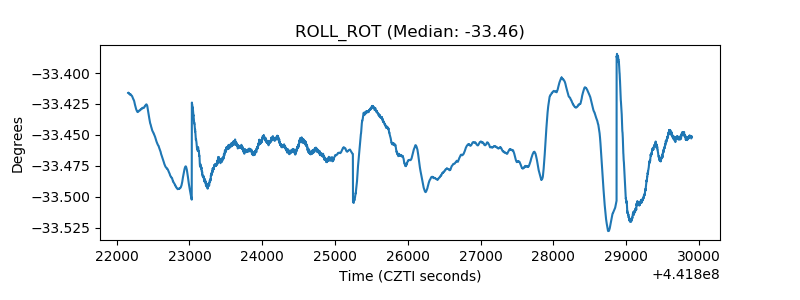 |
| _Roll_DEC | 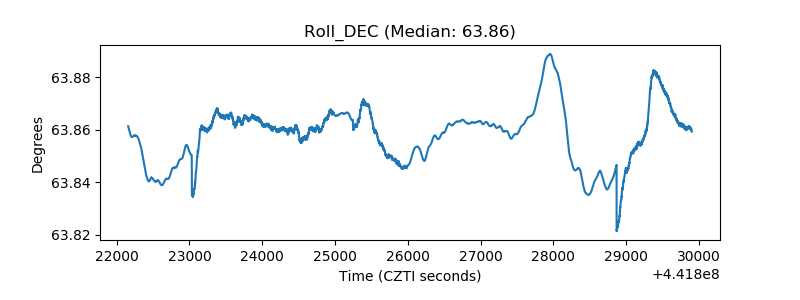 |
| _Roll_RA | 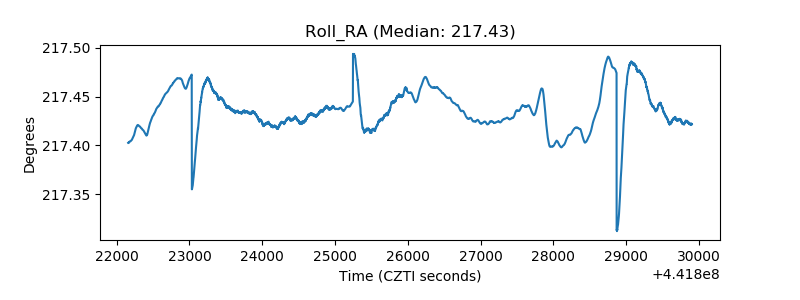 |
| Veto Counter | 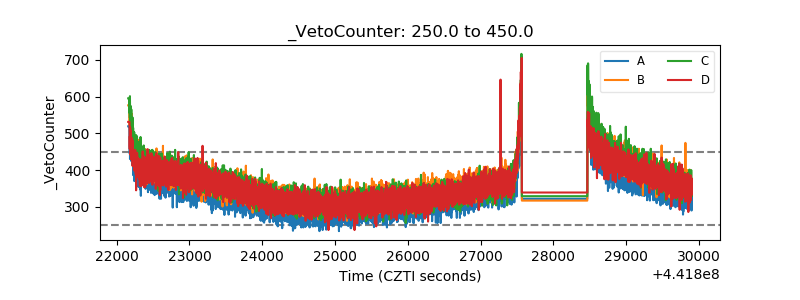 |