| Param | Original file | Final file |
|---|---|---|
| Filename | modeM0/AS1A13_072T01_9000006008_44674cztM0_level2.fits | modeM0/AS1A13_072T01_9000006008_44674cztM0_level2_quad_clean.evt |
| Size (bytes) | 441,092,160 | 108,624,960 |
| Size | 420.7 MB | 103.6 MB |
| Events in quadrant A | 4,995,137 | 721,536 |
| Events in quadrant B | 3,566,585 | 743,273 |
| Events in quadrant C | 3,015,444 | 715,889 |
| Events in quadrant D | 4,237,781 | 648,196 |
| Mode M0 | |||
|---|---|---|---|
| Quadrant | BADHDUFLAG | Total packets | Discarded packets |
| A | 0 | 20266 | 4 |
| B | 0 | 15232 | 2 |
| C | 0 | 13714 | 2 |
| D | 0 | 17374 | 2 |
| Mode SS | |||
|---|---|---|---|
| Quadrant | BADHDUFLAG | Total packets | Discarded packets |
| A | 0 | 134 | 0 |
| B | 0 | 134 | 0 |
| C | 0 | 134 | 0 |
| D | 0 | 134 | 0 |
| Mode M9 | |||
|---|---|---|---|
| Quadrant | BADHDUFLAG | Total packets | Discarded packets |
| A | 0 | 15 | 0 |
| B | 0 | 15 | 0 |
| C | 0 | 16 | 0 |
| D | 0 | 16 | 0 |
| Quadrant | Total seconds | Saturated seconds | Saturation percentage |
|---|---|---|---|
| A | 6601 | 164 | 2.484472% |
| B | 6601 | 160 | 2.423875% |
| C | 6601 | 45 | 0.681715% |
| D | 6601 | 178 | 2.696561% |
Noise dominated data is calculated using 1-second bins in cleaned event files. If a bin has >2000 counts, and if more than 50% of those come from <1% of pixels, then it is considered to be noise-dominated and hence unusable.
| Quadrant | # 1 sec bins | Bins with >0 counts | Bins with >2000 counts | High rate bins dominated by noise | Noise dominated (total time) | Noise dominated (detector-on time) | Marked lightcurve |
|---|---|---|---|---|---|---|---|
| A | 7651 | 6602 | 17 | 17 | 0.22% | 0.26% | 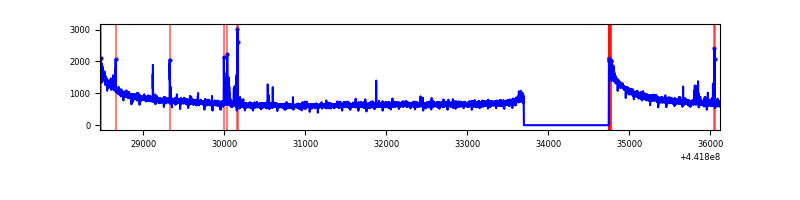 |
| B | 7651 | 6602 | 68 | 68 | 0.89% | 1.03% | 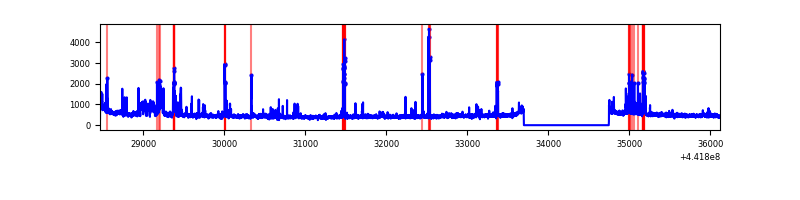 |
| C | 7651 | 6602 | 7 | 7 | 0.09% | 0.11% | 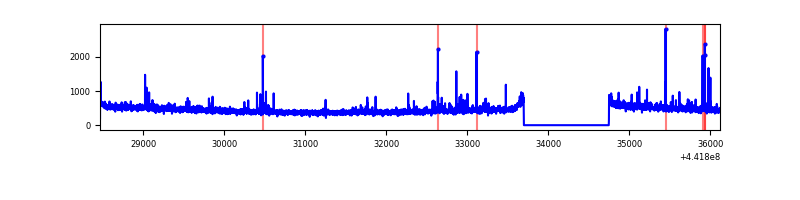 |
| D | 7651 | 6602 | 99 | 99 | 1.29% | 1.50% | 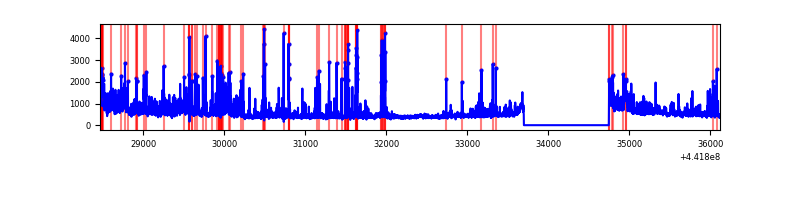 |
Top three noisy pixels from each quadrant. If the there are fewer than three noisy pixels in the level2.evt file, extra rows are filled as -1
| Pixel properties | Quadrant properties | ||||||
|---|---|---|---|---|---|---|---|
| Quadrant | DetID | PixID | Counts | Sigma | Mean | Median | Sigma |
| A | 10 | 83 | 2031241 | 13228.58 | 741 | 724 | 153.5 |
| A | 13 | 248 | 67049 | 432.1 | 741 | 724 | 153.5 |
| A | 15 | 223 | 18018 | 112.67 | 741 | 724 | 153.5 |
| B | 0 | 189 | 226894 | 1556.79 | 739 | 716 | 145.3 |
| B | 0 | 183 | 115980 | 793.37 | 739 | 716 | 145.3 |
| B | 0 | 186 | 85091 | 580.75 | 739 | 716 | 145.3 |
| C | 3 | 233 | 69096 | 397.78 | 735 | 738 | 171.8 |
| C | 14 | 254 | 61643 | 354.41 | 735 | 738 | 171.8 |
| C | 2 | 14 | 5443 | 27.38 | 735 | 738 | 171.8 |
| D | 1 | 52 | 694339 | 3801.97 | 727 | 704 | 182.4 |
| D | 13 | 249 | 298952 | 1634.76 | 727 | 704 | 182.4 |
| D | 2 | 249 | 110240 | 600.39 | 727 | 704 | 182.4 |
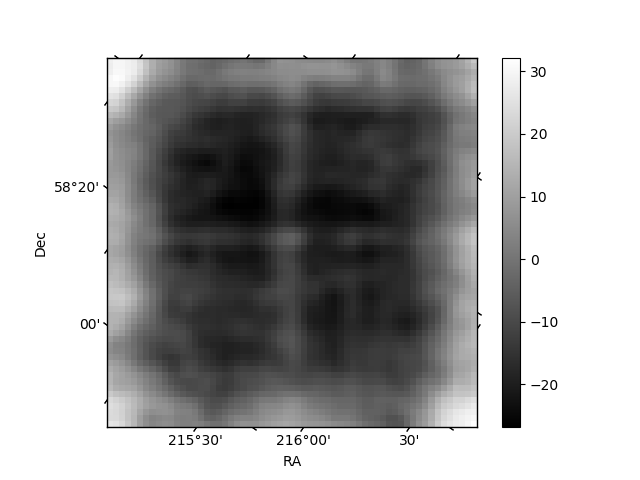
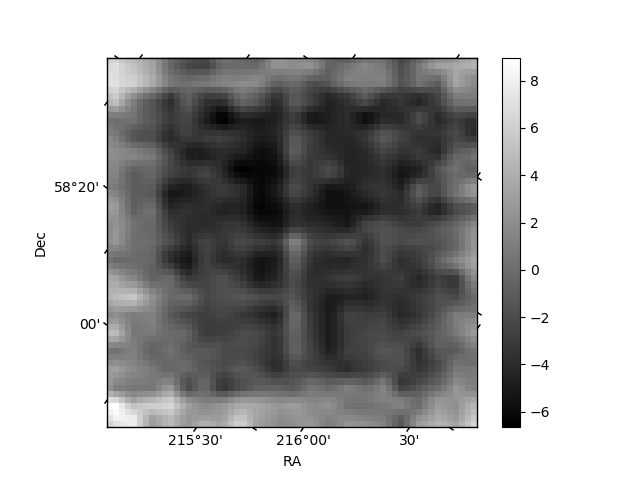
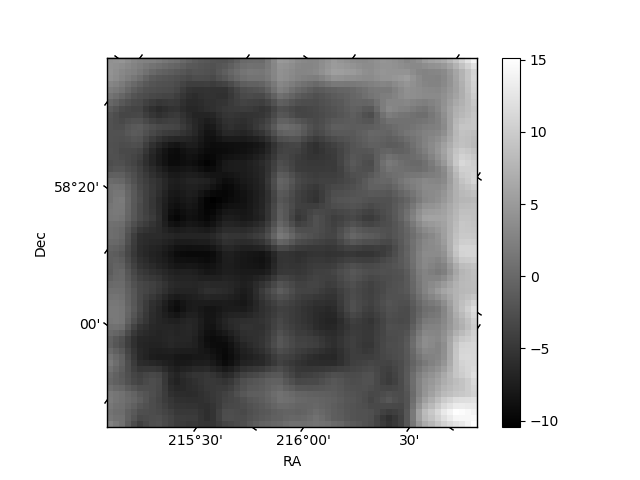
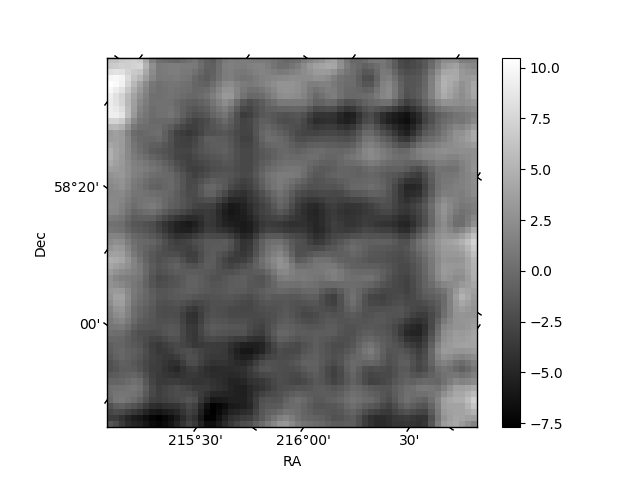
Histogram calculated using DETX and DETY for each event in the final _common_clean file
| Quadrant A | 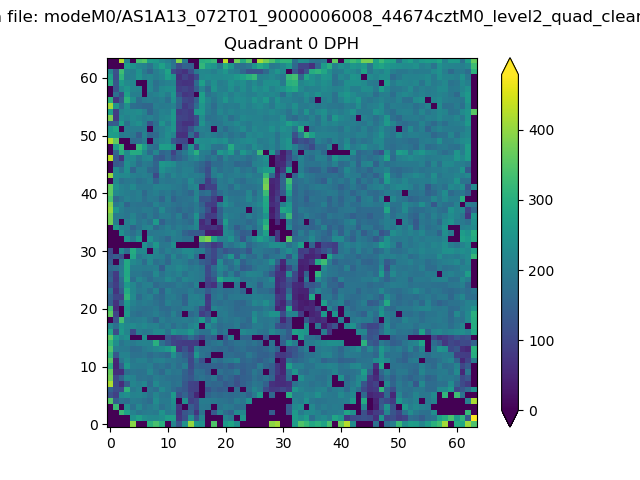 |
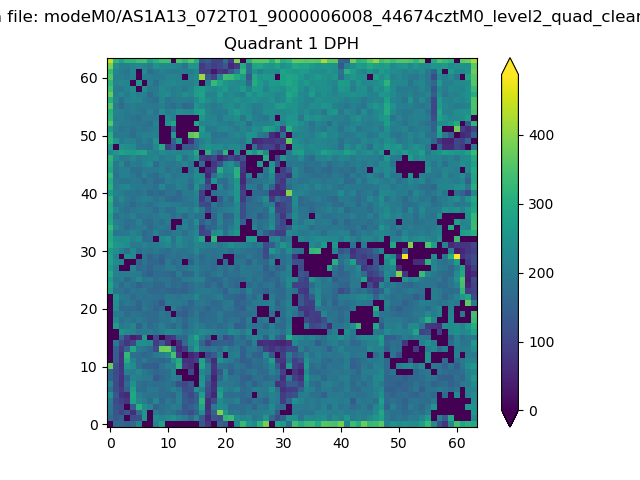 |
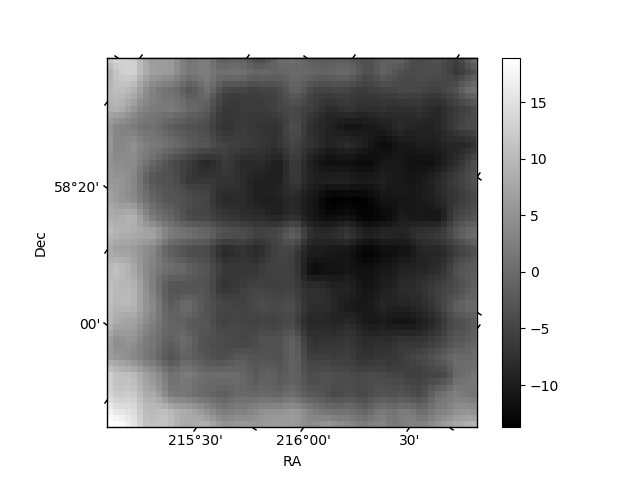
Quadrant B |
|---|---|---|---|
| Quadrant D | 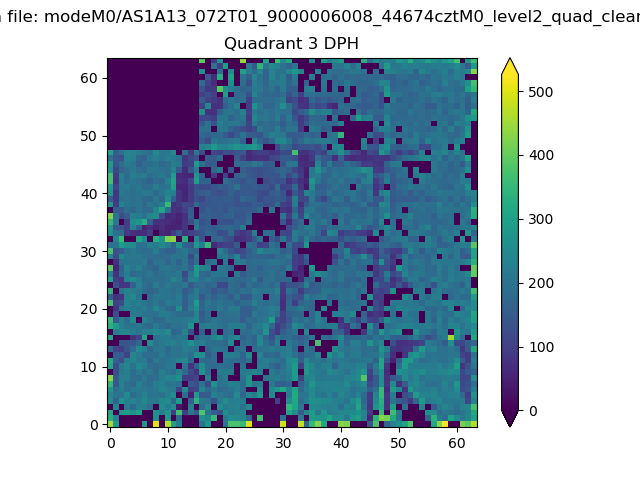 |
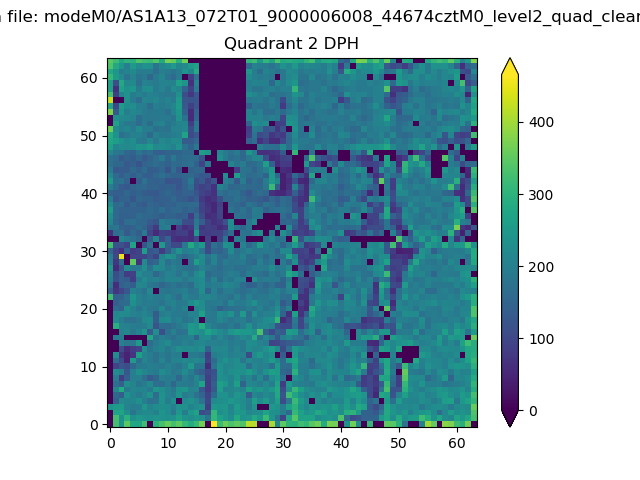 |
Quadrant C |
| Plot type | Count rate plots | Images |
|---|---|---|
| Comparison with Poisson distribution Blue bars denote a histogram of data divided into 1 sec bins. Red curve is a Poisson curve with rate = median count rate of data. |
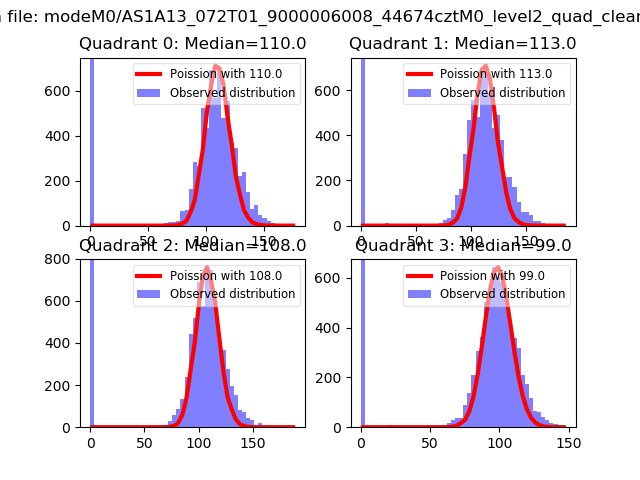 |
 |
| Quadrant-wise count rates Data is divided into 100 sec bins |
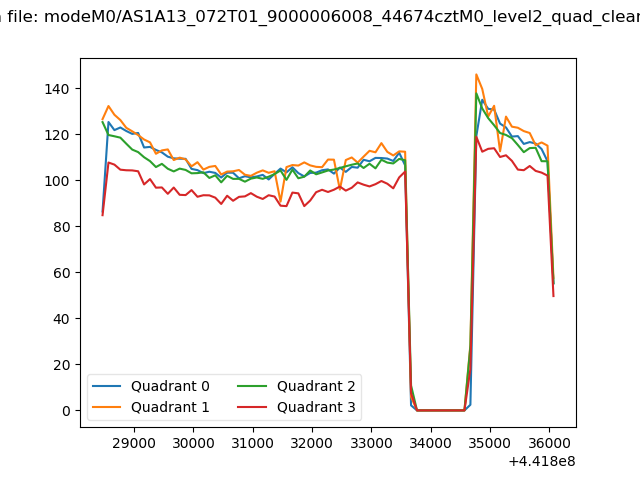 |
|
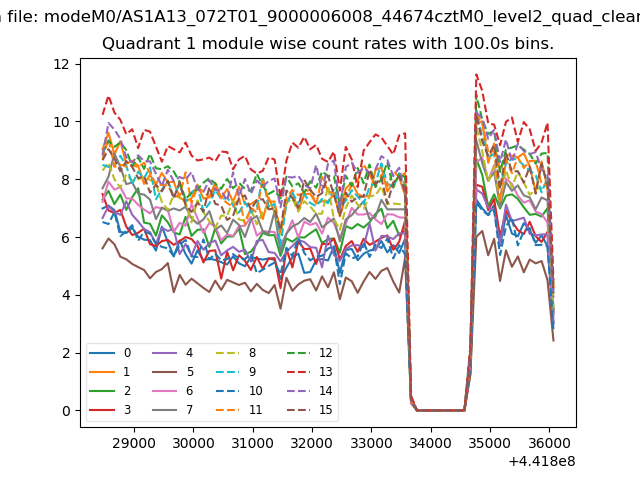
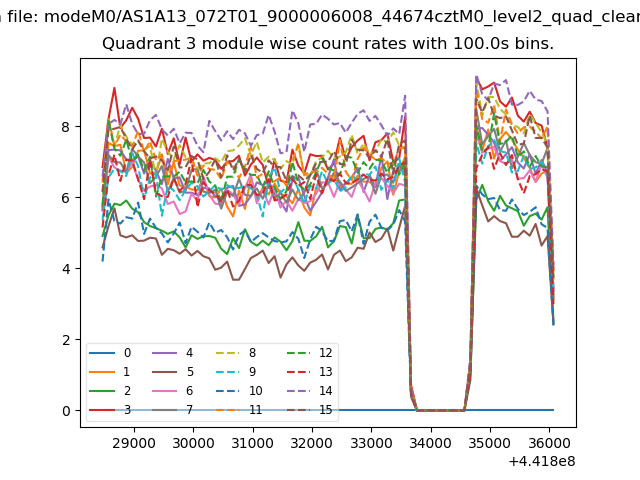
| Module-wise count rates for Quadrant A Data is divided into 100 sec bins |
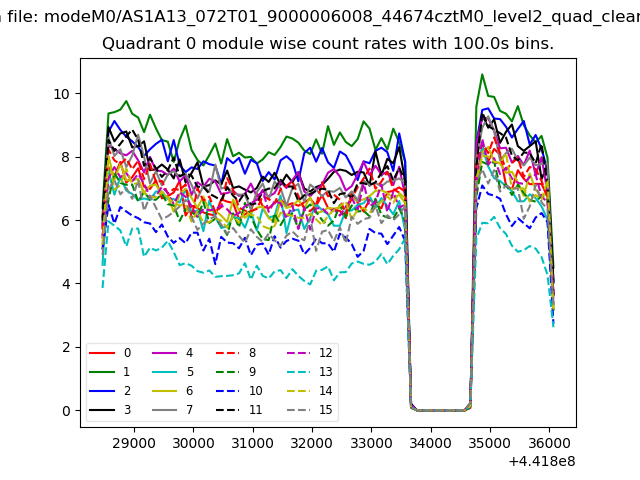 |
 |
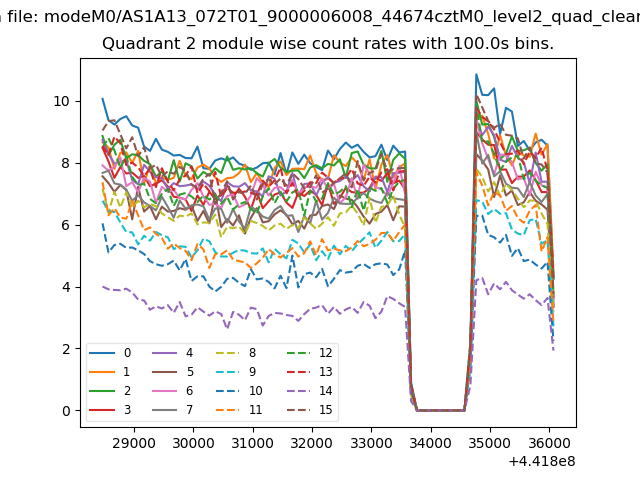
| Module-wise count rates for Quadrant B Data is divided into 100 sec bins |
 |
 |
| Module-wise count rates for Quadrant C Data is divided into 100 sec bins |
 |
 |
| Module-wise count rates for Quadrant D Data is divided into 100 sec bins |
 |
 |
| Parameter | Plot |
|---|---|
| CZT HV Monitor | 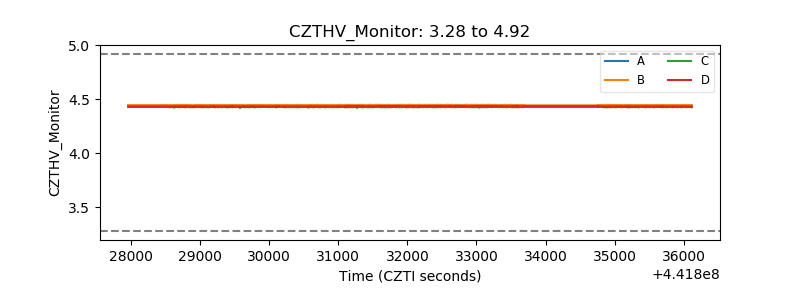 |
| D_VDD | 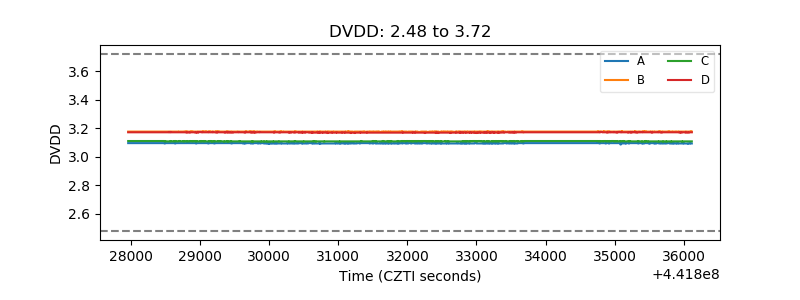 |
| Temperature 1 | 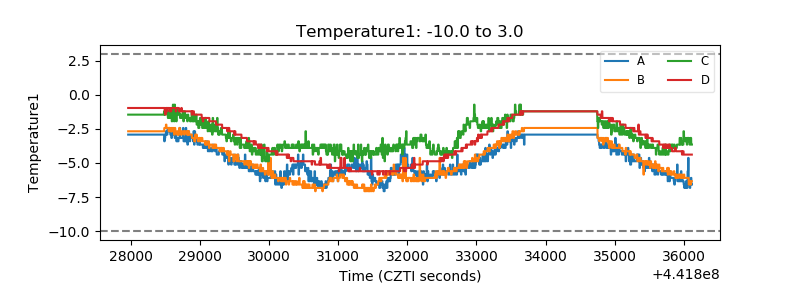 |
| Veto HV Monitor | 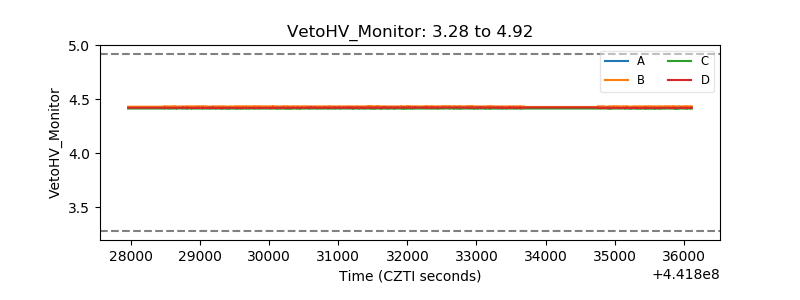 |
| Veto LLD | 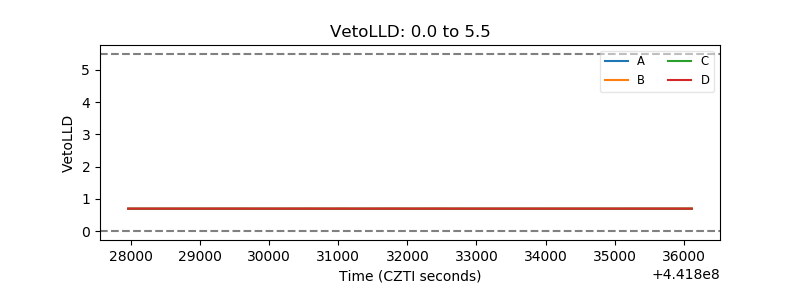 |
| Alpha Counter | 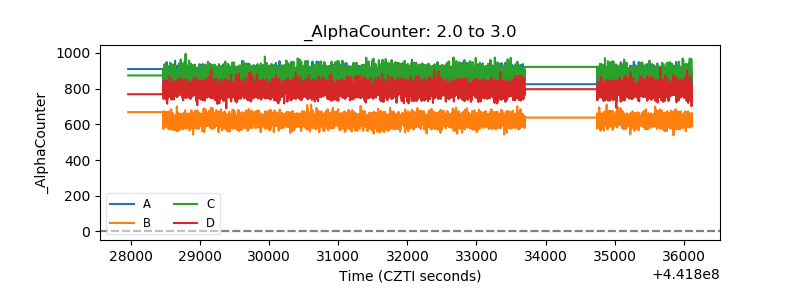 |
| _CPM_Rate |  |
| CZT Counter | 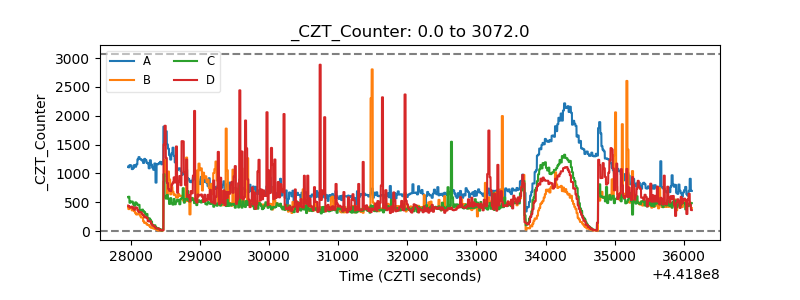 |
| +2.5 Volts monitor | 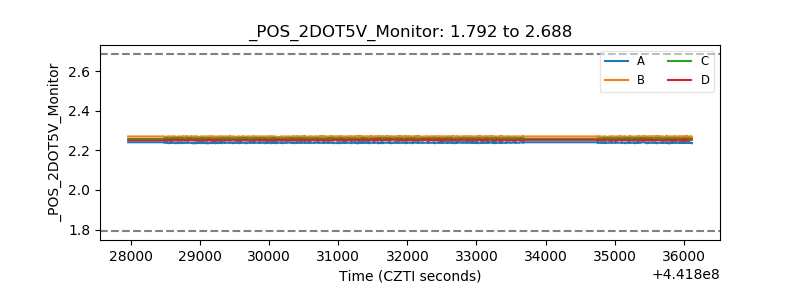 |
| +5 Volts monitor | 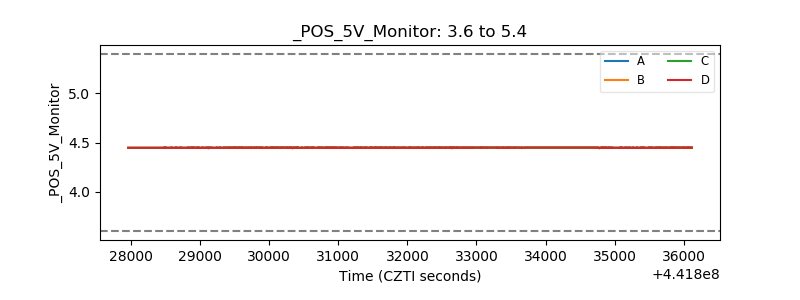 |
| _ROLL_ROT | 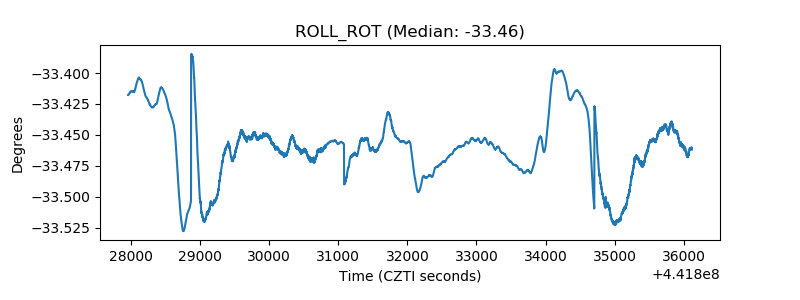 |
| _Roll_DEC | 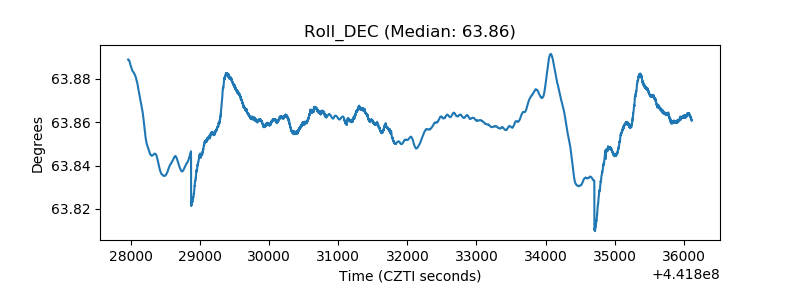 |
| _Roll_RA | 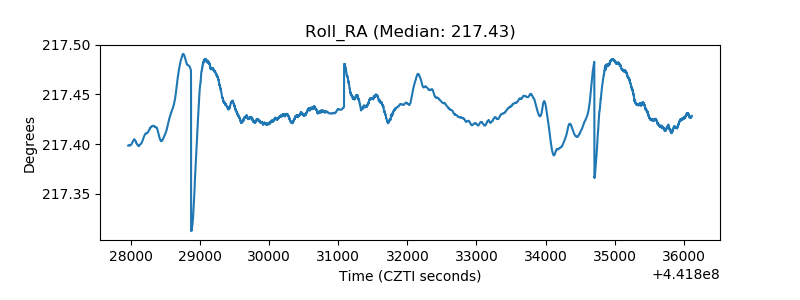 |
| Veto Counter | 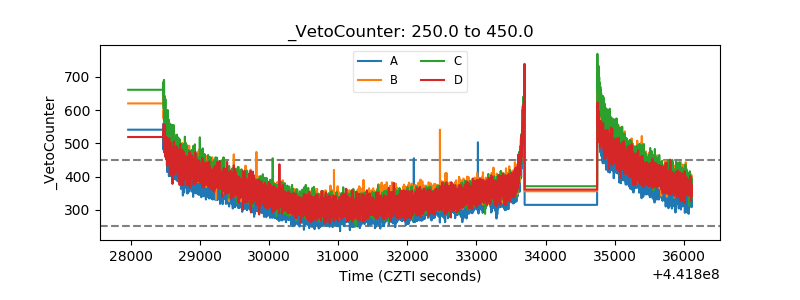 |