| Param | Original file | Final file |
|---|---|---|
| Filename | modeM0/AS1A13_072T01_9000006008_44677cztM0_level2.fits | modeM0/AS1A13_072T01_9000006008_44677cztM0_level2_quad_clean.evt |
| Size (bytes) | 427,919,040 | 110,145,600 |
| Size | 408.1 MB | 105.0 MB |
| Events in quadrant A | 4,812,840 | 736,585 |
| Events in quadrant B | 3,111,040 | 778,257 |
| Events in quadrant C | 2,846,079 | 738,992 |
| Events in quadrant D | 4,576,735 | 638,623 |
| Mode M0 | |||
|---|---|---|---|
| Quadrant | BADHDUFLAG | Total packets | Discarded packets |
| A | 0 | 19641 | 2 |
| B | 0 | 13617 | 2 |
| C | 0 | 13074 | 2 |
| D | 0 | 18167 | 2 |
| Mode SS | |||
|---|---|---|---|
| Quadrant | BADHDUFLAG | Total packets | Discarded packets |
| A | 0 | 128 | 0 |
| B | 0 | 128 | 0 |
| C | 0 | 128 | 0 |
| D | 0 | 128 | 0 |
| Mode M9 | |||
|---|---|---|---|
| Quadrant | BADHDUFLAG | Total packets | Discarded packets |
| A | 0 | 14 | 0 |
| B | 0 | 15 | 0 |
| C | 0 | 15 | 0 |
| D | 0 | 15 | 0 |
| Quadrant | Total seconds | Saturated seconds | Saturation percentage |
|---|---|---|---|
| A | 6351 | 124 | 1.952448% |
| B | 6351 | 52 | 0.818769% |
| C | 6351 | 13 | 0.204692% |
| D | 6351 | 328 | 5.164541% |
Noise dominated data is calculated using 1-second bins in cleaned event files. If a bin has >2000 counts, and if more than 50% of those come from <1% of pixels, then it is considered to be noise-dominated and hence unusable.
| Quadrant | # 1 sec bins | Bins with >0 counts | Bins with >2000 counts | High rate bins dominated by noise | Noise dominated (total time) | Noise dominated (detector-on time) | Marked lightcurve |
|---|---|---|---|---|---|---|---|
| A | 7591 | 6352 | 16 | 16 | 0.21% | 0.25% | 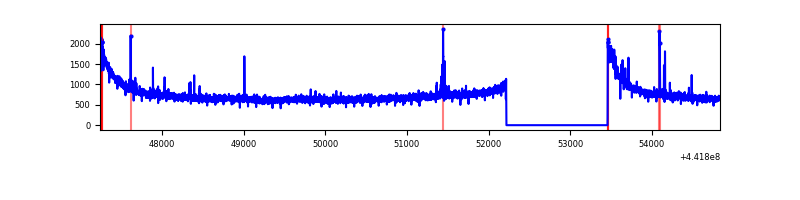 |
| B | 7591 | 6352 | 16 | 16 | 0.21% | 0.25% | 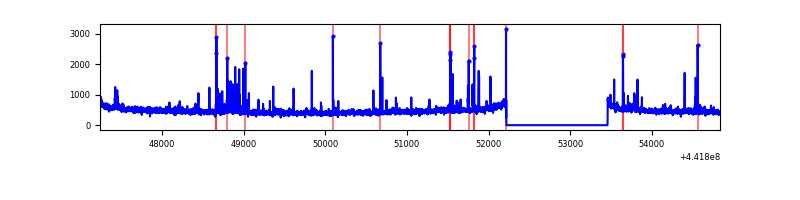 |
| C | 7591 | 6352 | 1 | 1 | 0.01% | 0.02% | 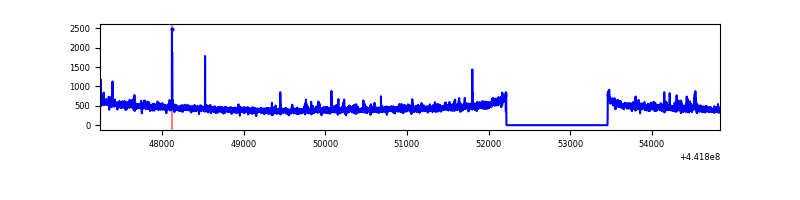 |
| D | 7591 | 6352 | 223 | 223 | 2.94% | 3.51% | 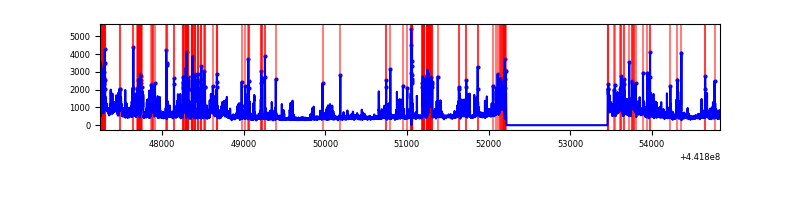 |
Top three noisy pixels from each quadrant. If the there are fewer than three noisy pixels in the level2.evt file, extra rows are filled as -1
| Pixel properties | Quadrant properties | ||||||
|---|---|---|---|---|---|---|---|
| Quadrant | DetID | PixID | Counts | Sigma | Mean | Median | Sigma |
| A | 10 | 83 | 1948453 | 13150.9 | 718 | 705 | 148.1 |
| A | 13 | 248 | 55776 | 371.83 | 718 | 705 | 148.1 |
| A | 0 | 243 | 15652 | 100.92 | 718 | 705 | 148.1 |
| B | 5 | 255 | 124271 | 878.69 | 726 | 705 | 140.6 |
| B | 0 | 219 | 24997 | 172.74 | 726 | 705 | 140.6 |
| B | 0 | 183 | 21144 | 145.34 | 726 | 705 | 140.6 |
| C | 2 | 14 | 25103 | 145.89 | 712 | 716 | 167.2 |
| C | 14 | 254 | 23813 | 138.18 | 712 | 716 | 167.2 |
| C | 3 | 233 | 13405 | 75.91 | 712 | 716 | 167.2 |
| D | 1 | 52 | 854667 | 4983.69 | 687 | 666 | 171.4 |
| D | 13 | 249 | 284682 | 1657.43 | 687 | 666 | 171.4 |
| D | 2 | 249 | 280852 | 1635.08 | 687 | 666 | 171.4 |
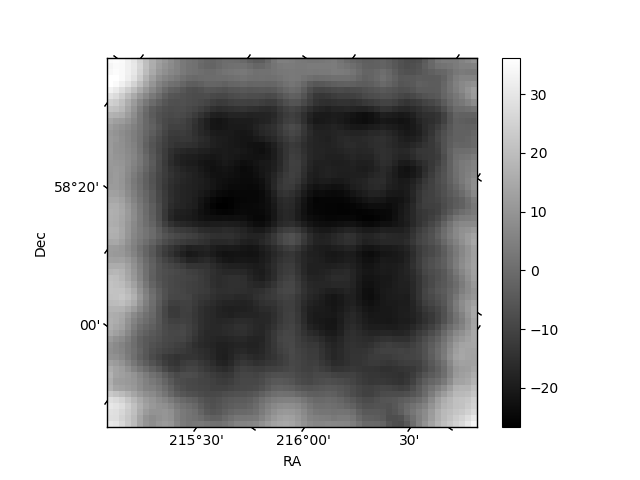
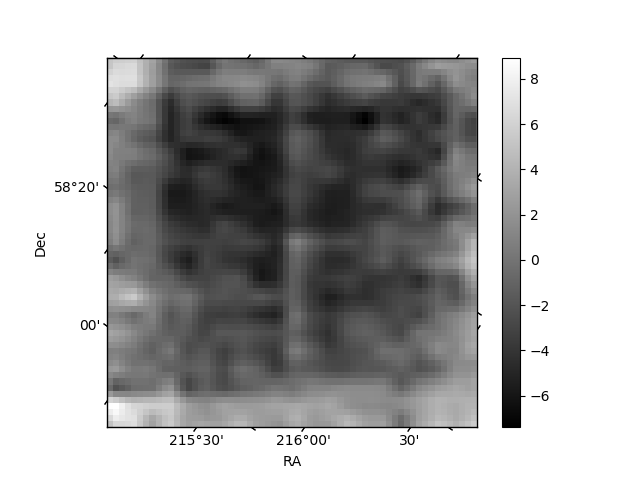
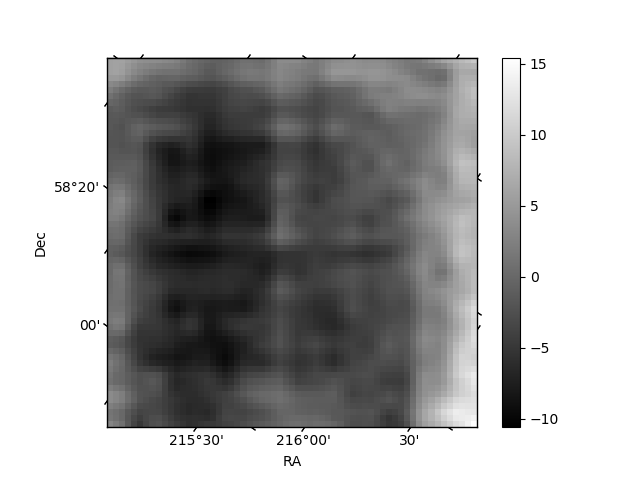
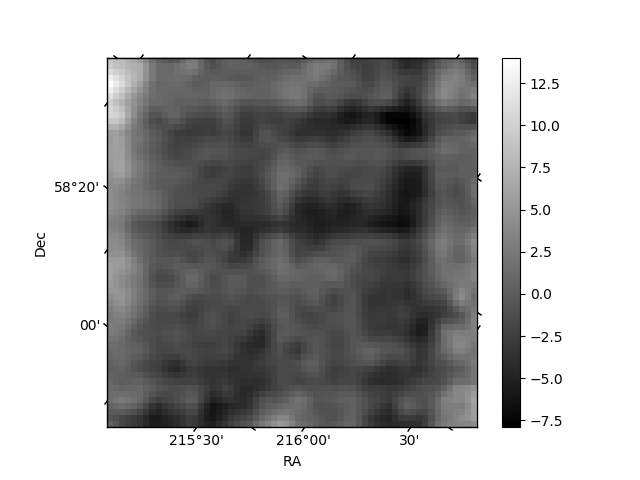
Histogram calculated using DETX and DETY for each event in the final _common_clean file
| Quadrant A | 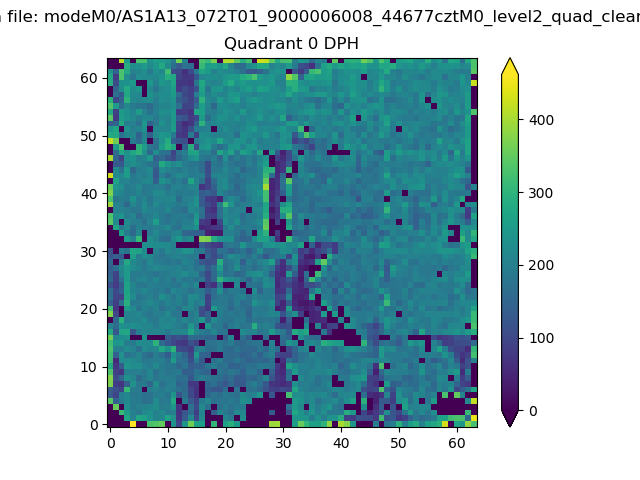 |
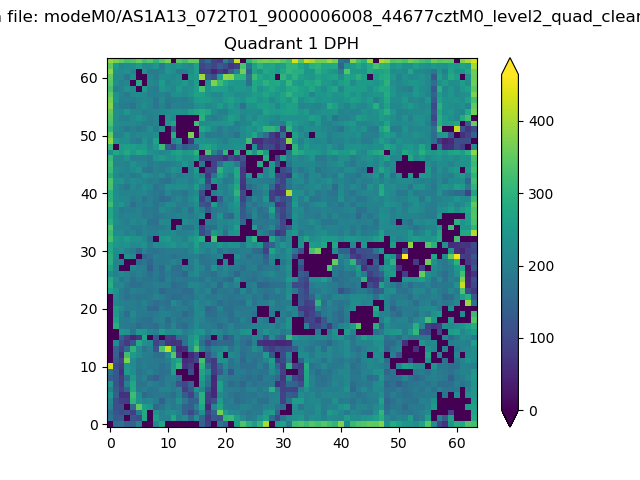 |
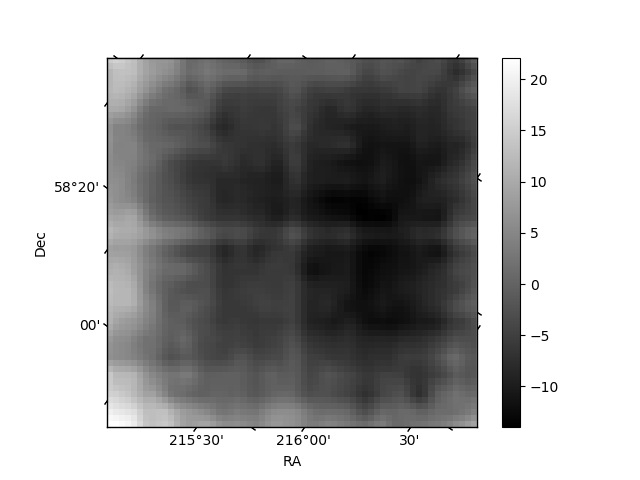
Quadrant B |
|---|---|---|---|
| Quadrant D | 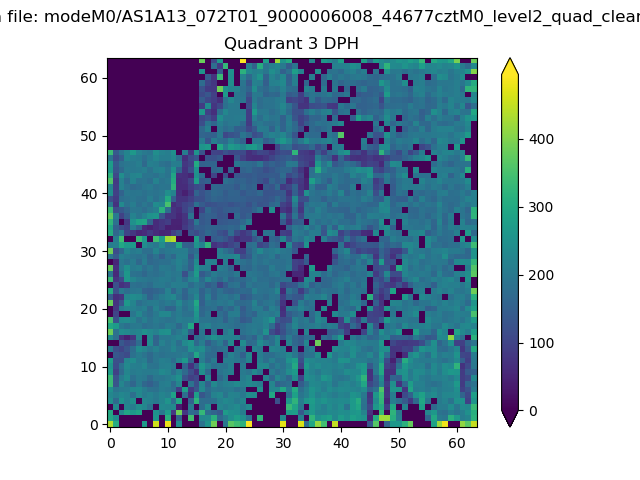 |
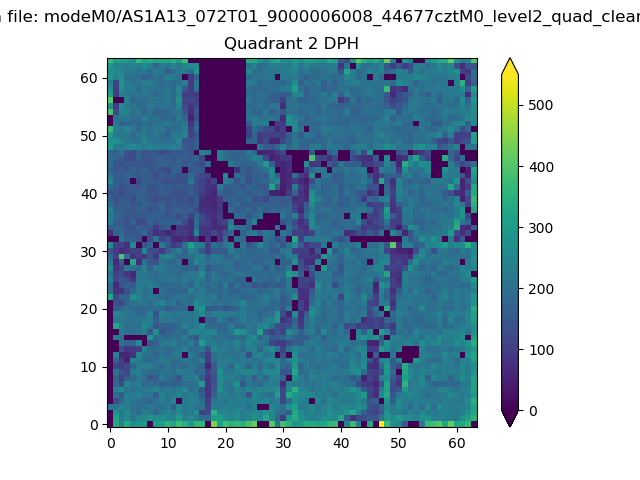 |
Quadrant C |
| Plot type | Count rate plots | Images |
|---|---|---|
| Comparison with Poisson distribution Blue bars denote a histogram of data divided into 1 sec bins. Red curve is a Poisson curve with rate = median count rate of data. |
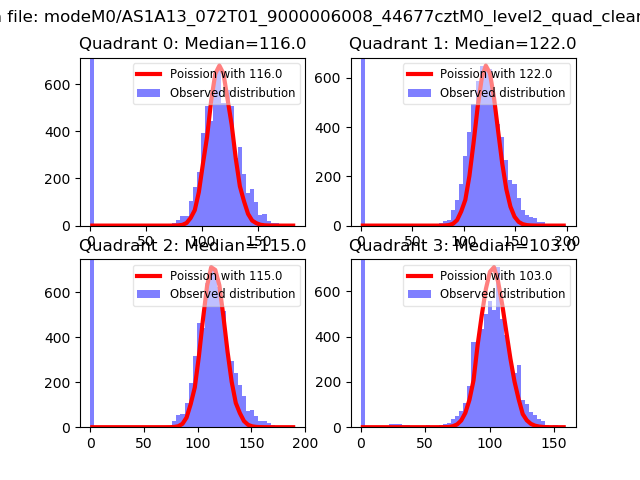 |
 |
| Quadrant-wise count rates Data is divided into 100 sec bins |
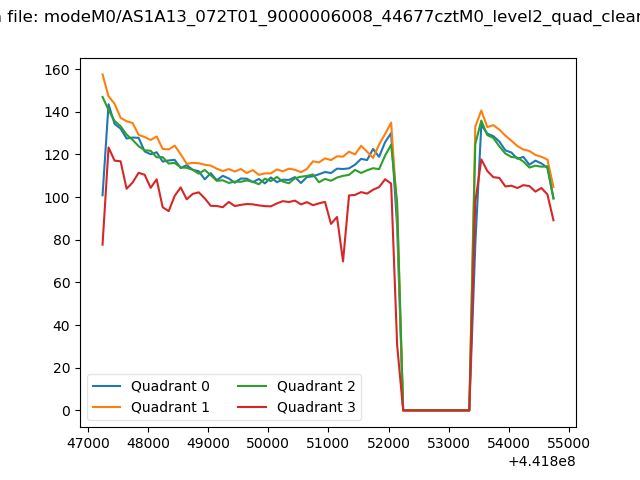 |
|
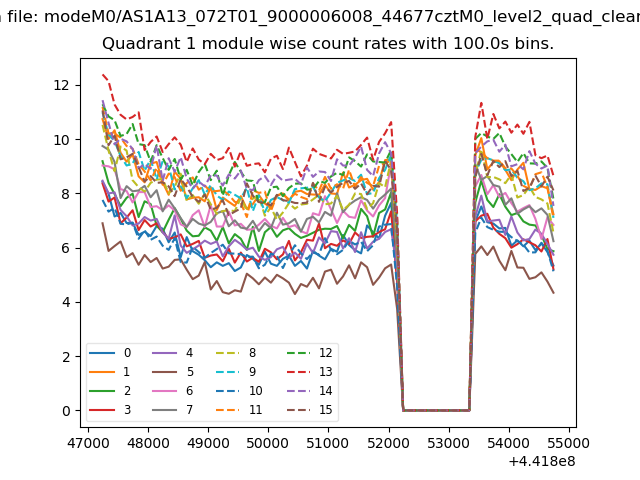
| Module-wise count rates for Quadrant A Data is divided into 100 sec bins |
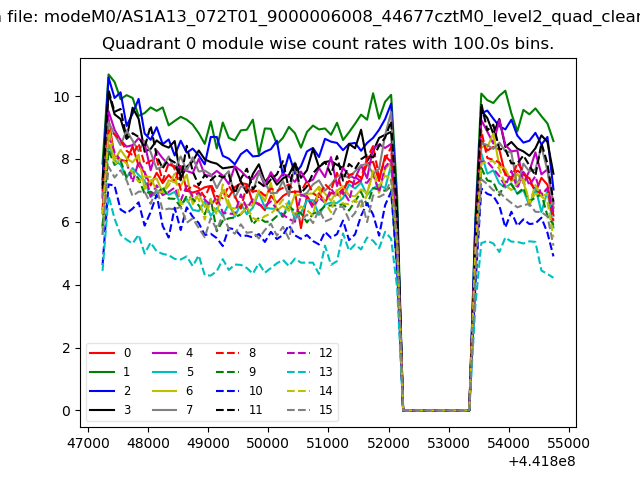 |
 |
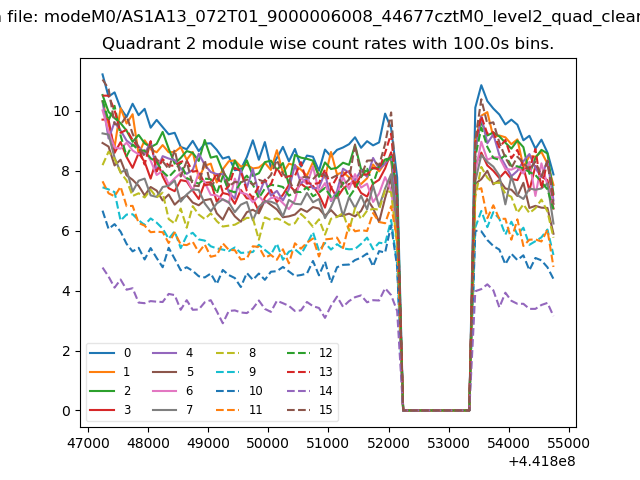
| Module-wise count rates for Quadrant B Data is divided into 100 sec bins |
 |
 |
| Module-wise count rates for Quadrant C Data is divided into 100 sec bins |
 |
 |
| Module-wise count rates for Quadrant D Data is divided into 100 sec bins |
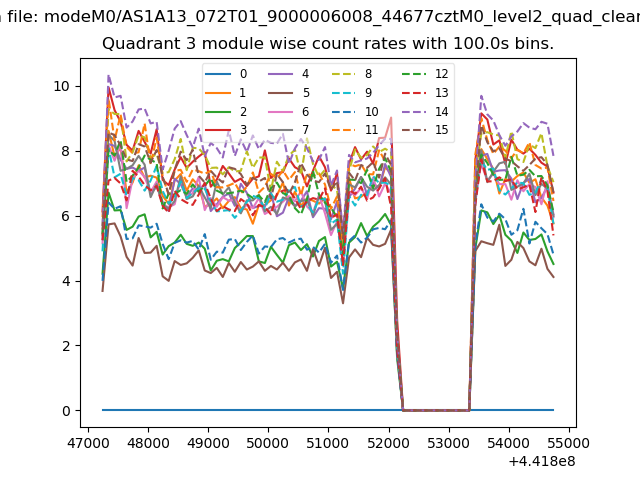 |
 |
| Parameter | Plot |
|---|---|
| CZT HV Monitor | 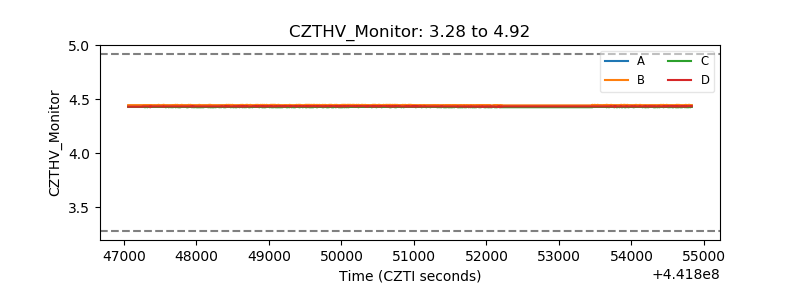 |
| D_VDD | 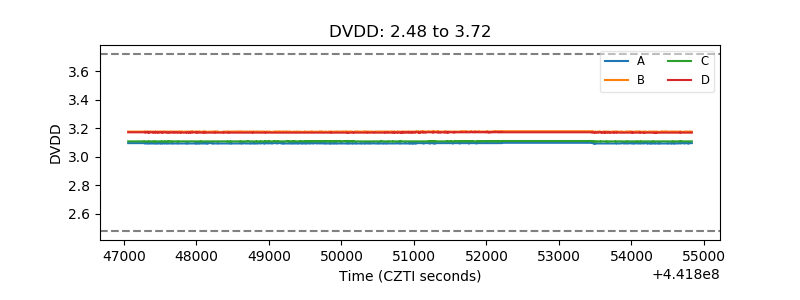 |
| Temperature 1 | 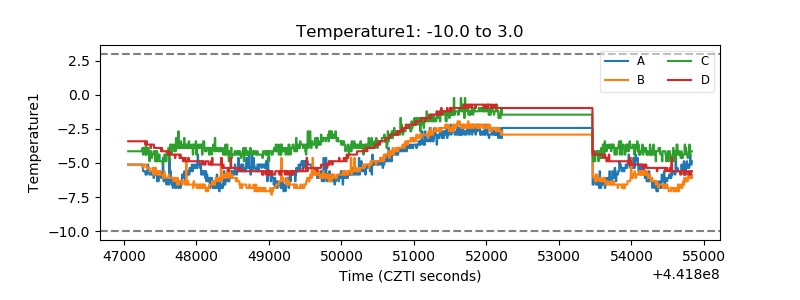 |
| Veto HV Monitor | 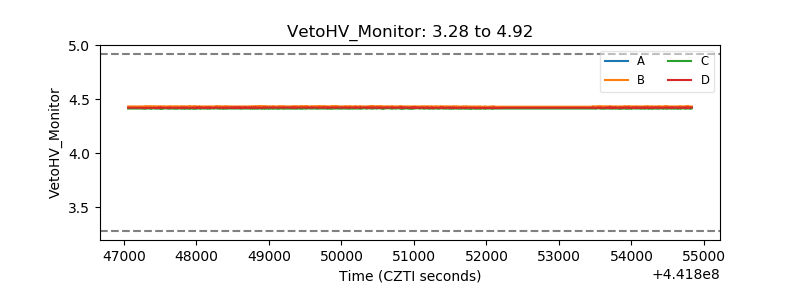 |
| Veto LLD | 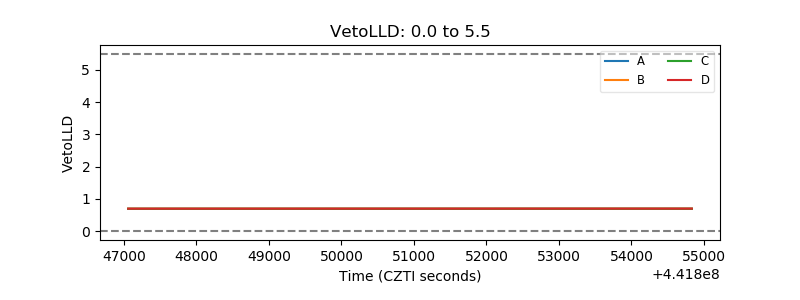 |
| Alpha Counter | 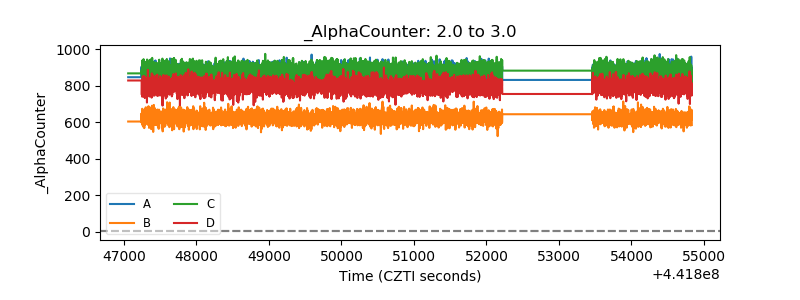 |
| _CPM_Rate | 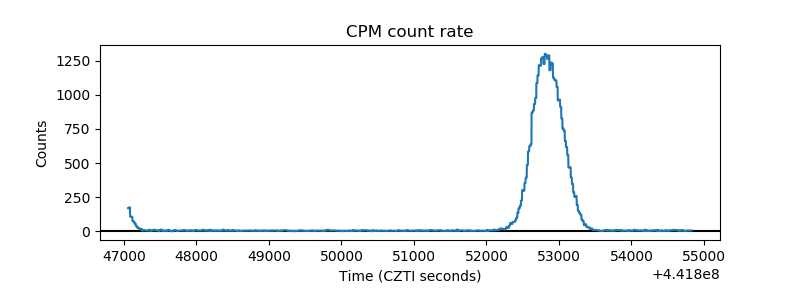 |
| CZT Counter | 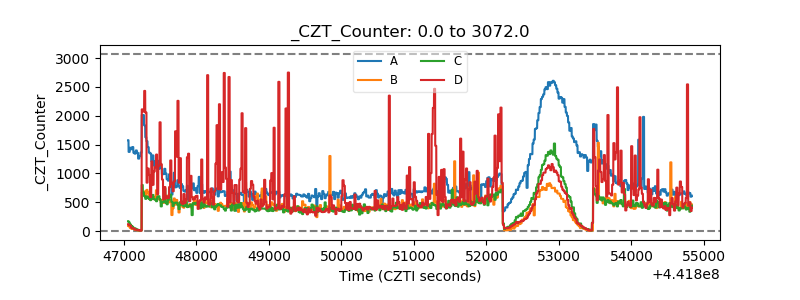 |
| +2.5 Volts monitor | 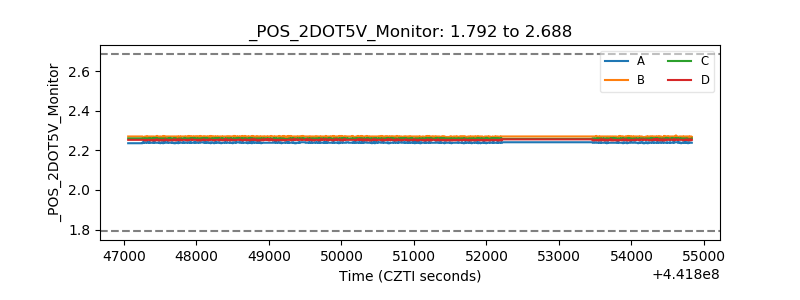 |
| +5 Volts monitor | 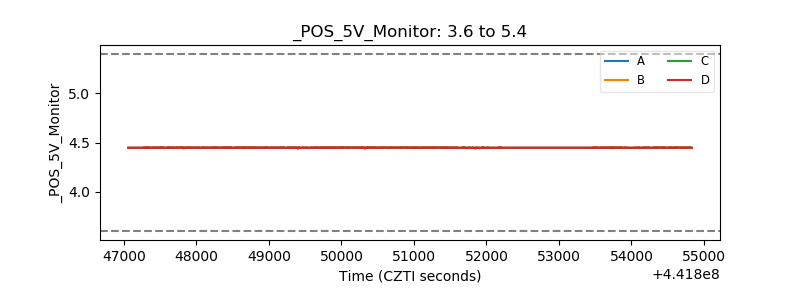 |
| _ROLL_ROT | 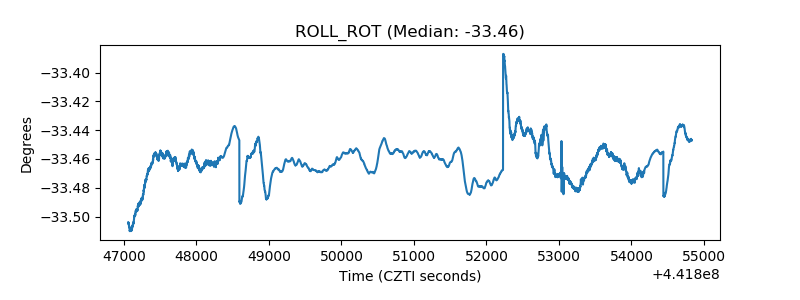 |
| _Roll_DEC | 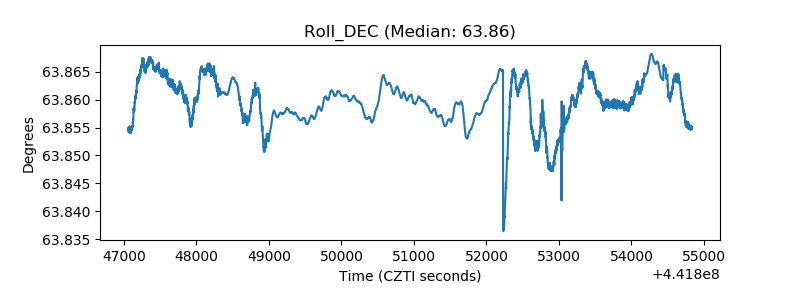 |
| _Roll_RA | 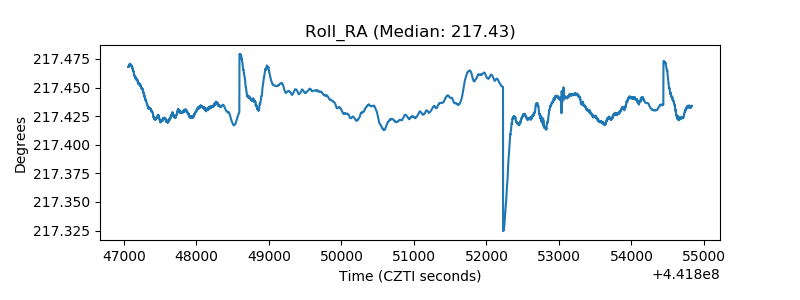 |
| Veto Counter | 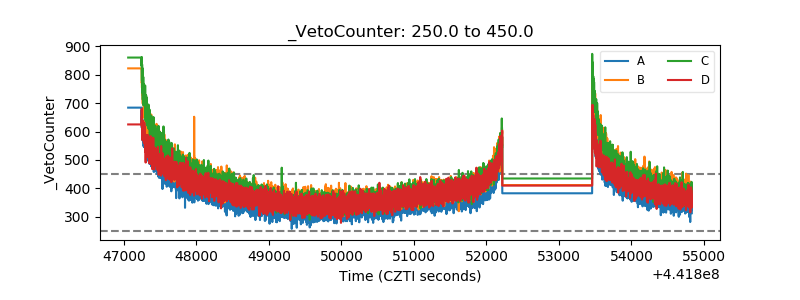 |