| Param | Original file | Final file |
|---|---|---|
| Filename | modeM0/AS1A13_072T01_9000006008_44680cztM0_level2.fits | modeM0/AS1A13_072T01_9000006008_44680cztM0_level2_quad_clean.evt |
| Size (bytes) | 500,345,280 | 107,303,040 |
| Size | 477.2 MB | 102.3 MB |
| Events in quadrant A | 4,877,883 | 718,556 |
| Events in quadrant B | 3,202,883 | 749,937 |
| Events in quadrant C | 3,011,210 | 714,452 |
| Events in quadrant D | 6,901,691 | 592,665 |
| Mode M0 | |||
|---|---|---|---|
| Quadrant | BADHDUFLAG | Total packets | Discarded packets |
| A | 0 | 20276 | 1 |
| B | 0 | 14486 | 1 |
| C | 0 | 14139 | 1 |
| D | 0 | 25267 | 3 |
| Mode SS | |||
|---|---|---|---|
| Quadrant | BADHDUFLAG | Total packets | Discarded packets |
| A | 0 | 138 | 0 |
| B | 0 | 138 | 0 |
| C | 0 | 138 | 0 |
| D | 0 | 138 | 0 |
| Mode M9 | |||
|---|---|---|---|
| Quadrant | BADHDUFLAG | Total packets | Discarded packets |
| A | 0 | 5 | 0 |
| B | 0 | 5 | 0 |
| C | 0 | 5 | 0 |
| D | 0 | 5 | 0 |
| Quadrant | Total seconds | Saturated seconds | Saturation percentage |
|---|---|---|---|
| A | 6791 | 177 | 2.606391% |
| B | 6792 | 108 | 1.590106% |
| C | 6792 | 28 | 0.412250% |
| D | 6791 | 891 | 13.120306% |
Noise dominated data is calculated using 1-second bins in cleaned event files. If a bin has >2000 counts, and if more than 50% of those come from <1% of pixels, then it is considered to be noise-dominated and hence unusable.
| Quadrant | # 1 sec bins | Bins with >0 counts | Bins with >2000 counts | High rate bins dominated by noise | Noise dominated (total time) | Noise dominated (detector-on time) | Marked lightcurve |
|---|---|---|---|---|---|---|---|
| A | 7306 | 6792 | 15 | 15 | 0.21% | 0.22% | 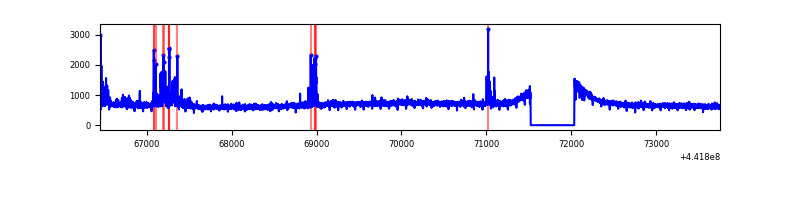 |
| B | 7307 | 6793 | 4 | 4 | 0.05% | 0.06% | 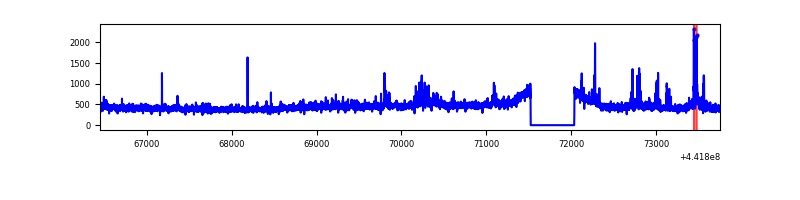 |
| C | 7307 | 6793 | 4 | 4 | 0.05% | 0.06% | 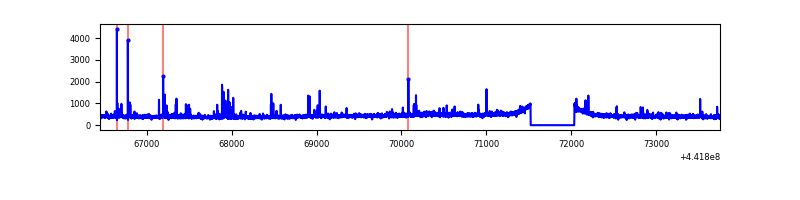 |
| D | 7306 | 6792 | 821 | 821 | 11.24% | 12.09% | 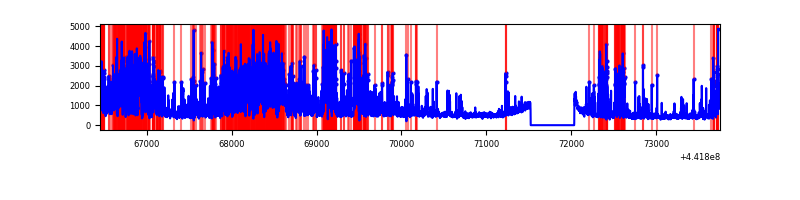 |
Top three noisy pixels from each quadrant. If the there are fewer than three noisy pixels in the level2.evt file, extra rows are filled as -1
| Pixel properties | Quadrant properties | ||||||
|---|---|---|---|---|---|---|---|
| Quadrant | DetID | PixID | Counts | Sigma | Mean | Median | Sigma |
| A | 10 | 83 | 1798898 | 11702.75 | 745 | 729 | 153.7 |
| A | 13 | 248 | 191642 | 1242.49 | 745 | 729 | 153.7 |
| A | 13 | 254 | 8886 | 53.09 | 745 | 729 | 153.7 |
| B | 4 | 171 | 119971 | 811.09 | 743 | 721 | 147.0 |
| B | 0 | 246 | 55131 | 370.08 | 743 | 721 | 147.0 |
| B | 0 | 183 | 26939 | 178.32 | 743 | 721 | 147.0 |
| C | 14 | 254 | 95585 | 556.48 | 725 | 728 | 170.5 |
| C | 3 | 233 | 33569 | 192.66 | 725 | 728 | 170.5 |
| C | 0 | 207 | 26854 | 153.27 | 725 | 728 | 170.5 |
| D | 1 | 52 | 3484693 | 20174.22 | 690 | 667 | 172.7 |
| D | 2 | 249 | 208576 | 1203.9 | 690 | 667 | 172.7 |
| D | 13 | 249 | 203761 | 1176.01 | 690 | 667 | 172.7 |
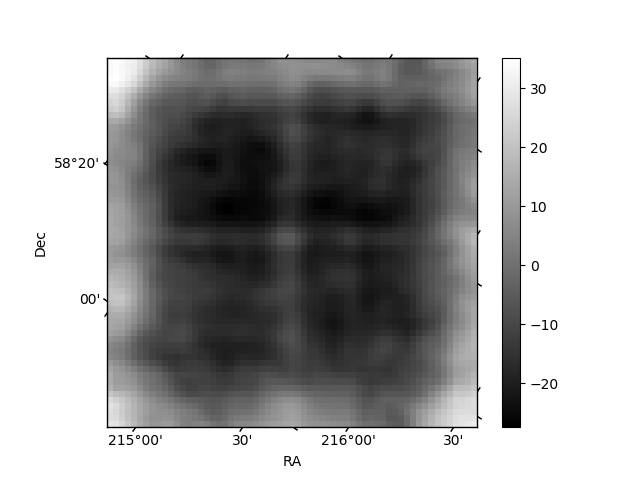
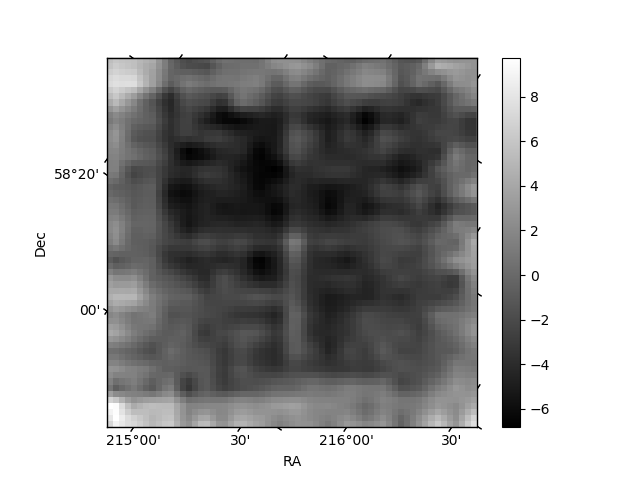
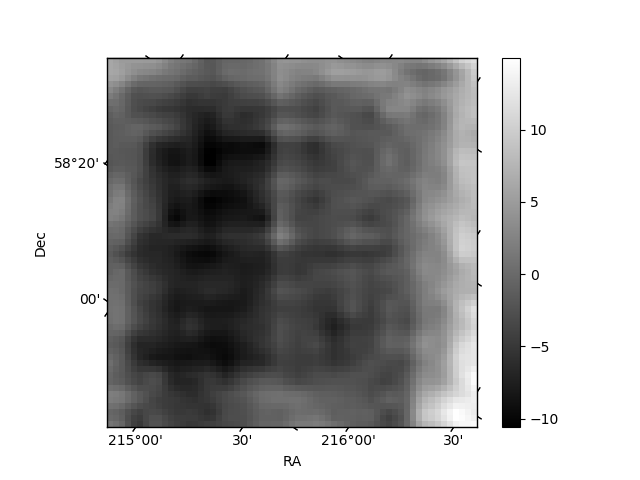
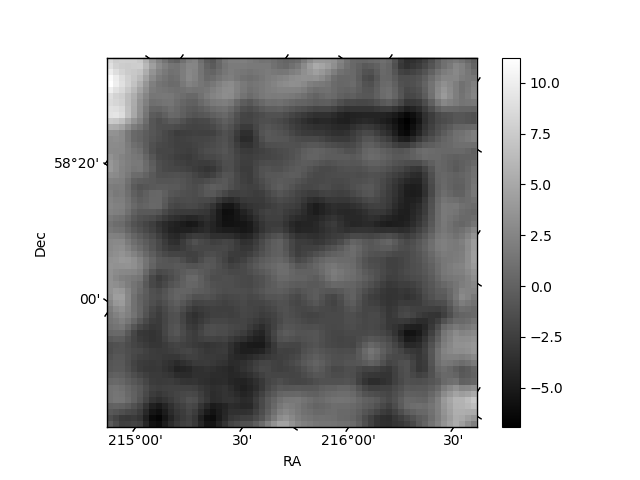
Histogram calculated using DETX and DETY for each event in the final _common_clean file
| Quadrant A | 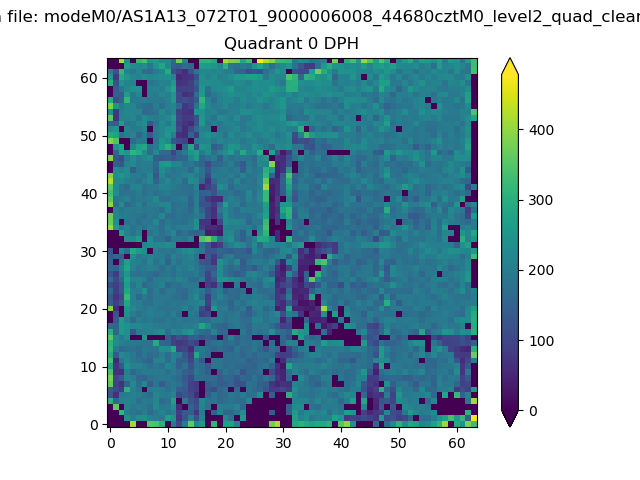 |
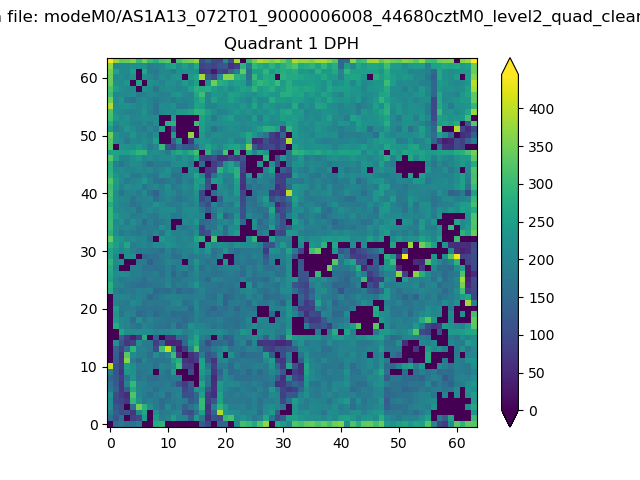 |
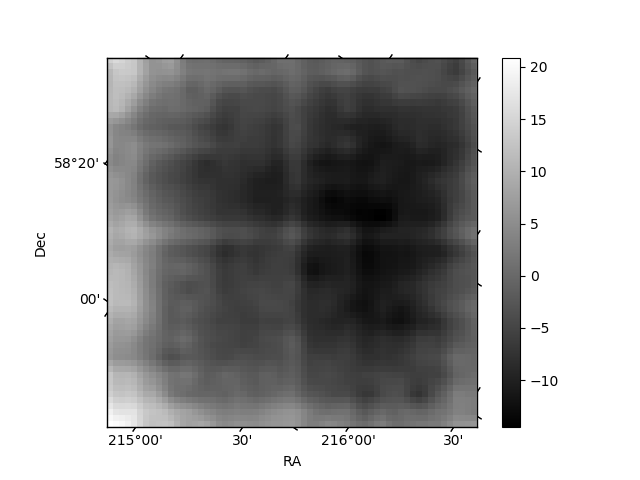
Quadrant B |
|---|---|---|---|
| Quadrant D | 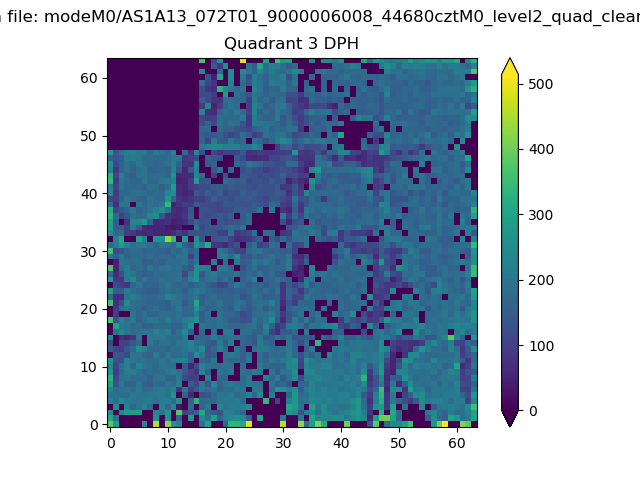 |
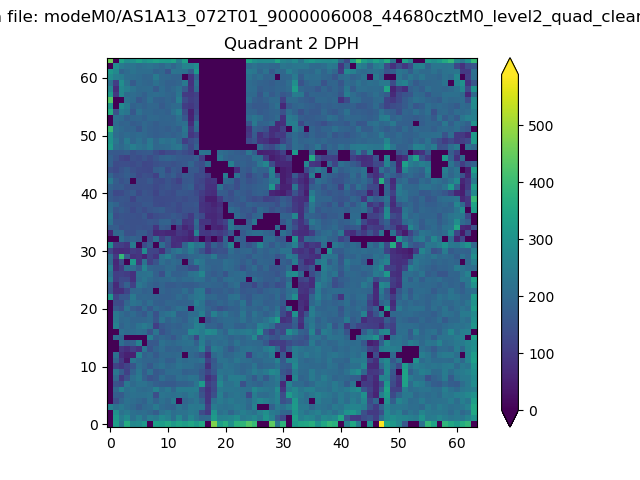 |
Quadrant C |
| Plot type | Count rate plots | Images |
|---|---|---|
| Comparison with Poisson distribution Blue bars denote a histogram of data divided into 1 sec bins. Red curve is a Poisson curve with rate = median count rate of data. |
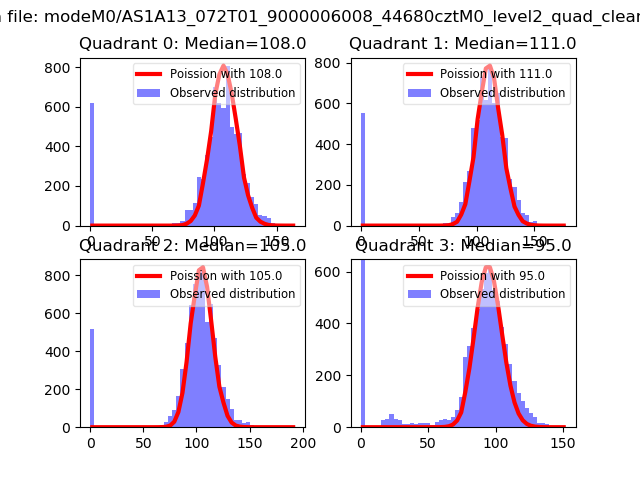 |
 |
| Quadrant-wise count rates Data is divided into 100 sec bins |
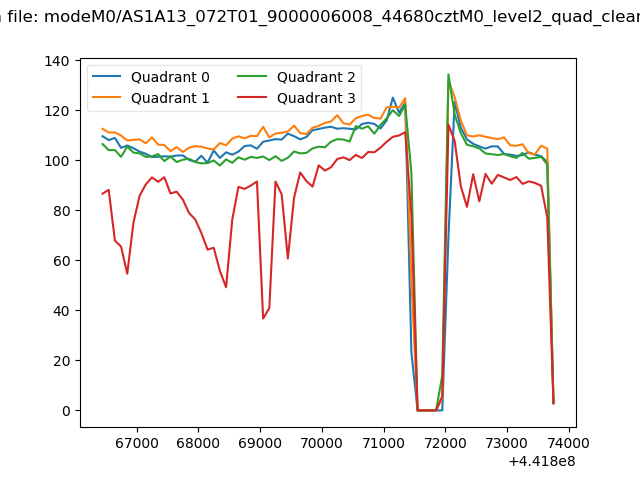 |
|
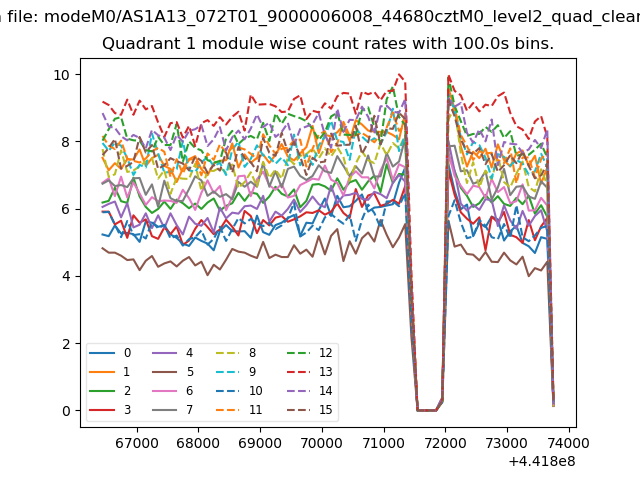
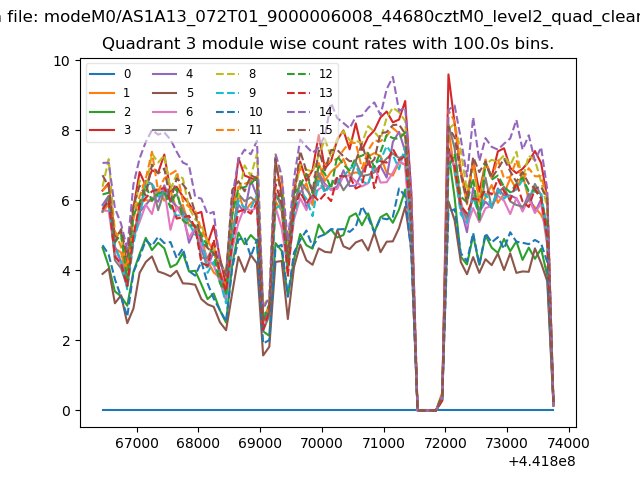
| Module-wise count rates for Quadrant A Data is divided into 100 sec bins |
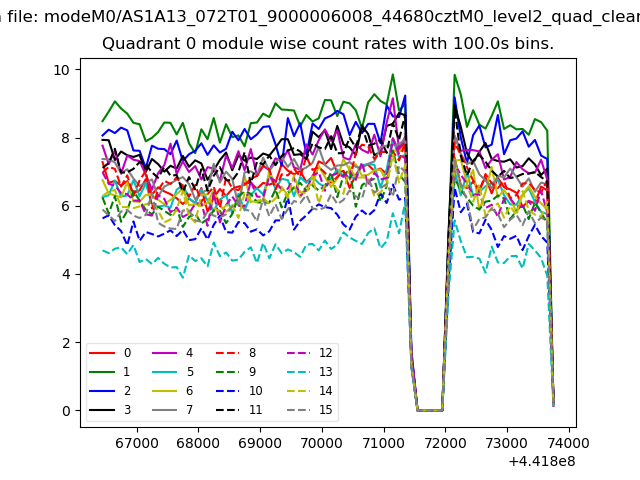 |
 |
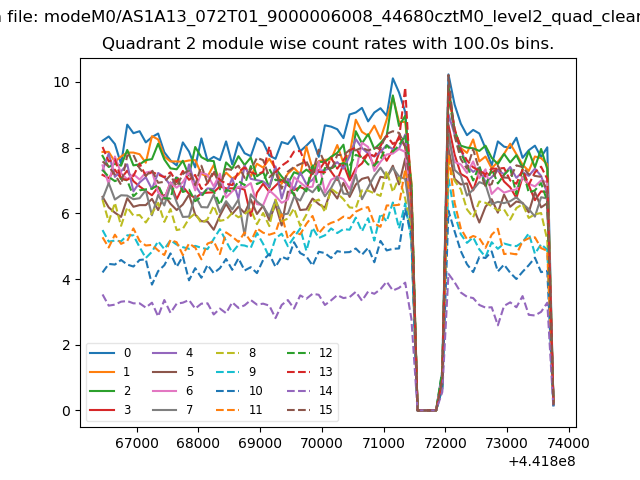
| Module-wise count rates for Quadrant B Data is divided into 100 sec bins |
 |
 |
| Module-wise count rates for Quadrant C Data is divided into 100 sec bins |
 |
 |
| Module-wise count rates for Quadrant D Data is divided into 100 sec bins |
 |
 |
| Parameter | Plot |
|---|---|
| CZT HV Monitor | 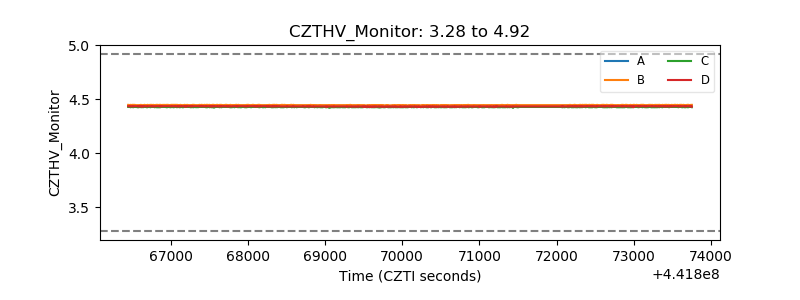 |
| D_VDD | 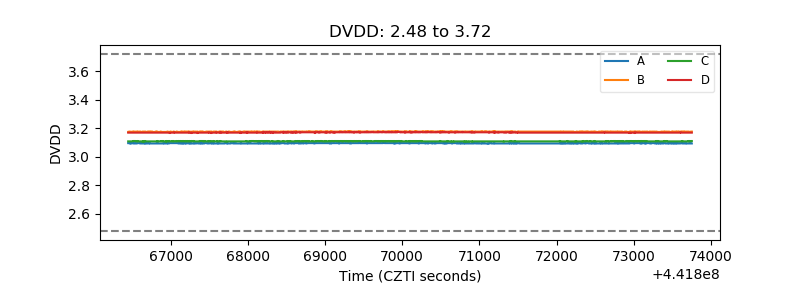 |
| Temperature 1 | 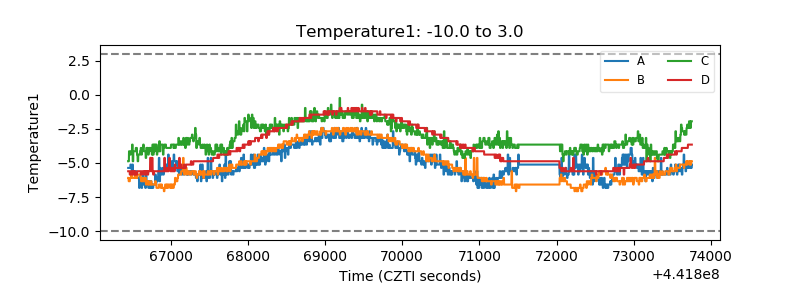 |
| Veto HV Monitor | 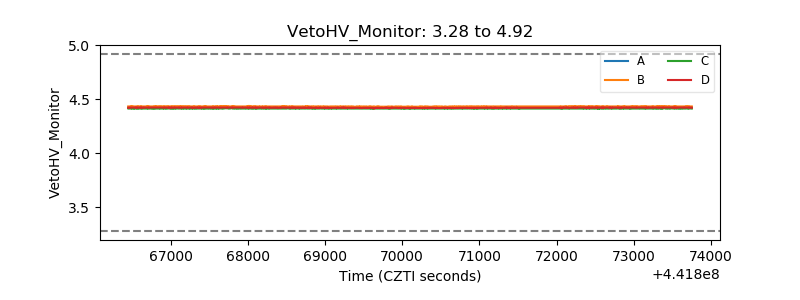 |
| Veto LLD | 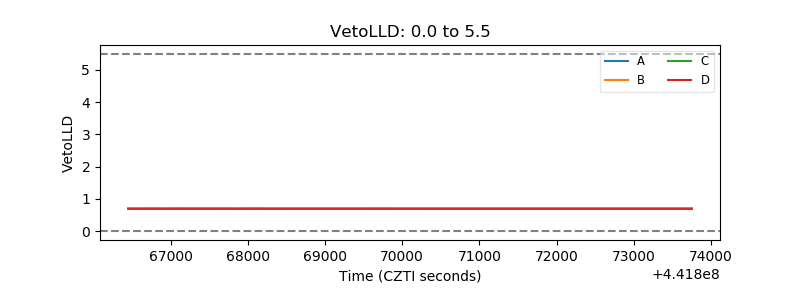 |
| Alpha Counter | 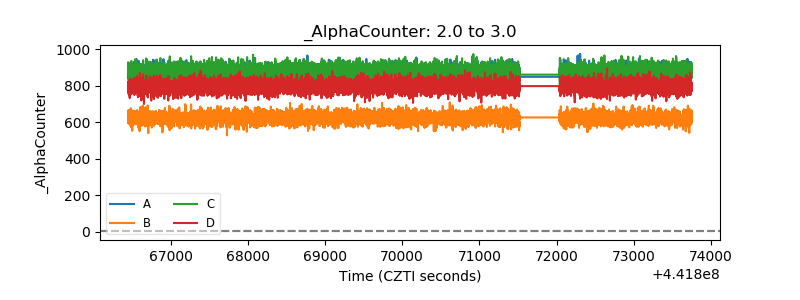 |
| _CPM_Rate | 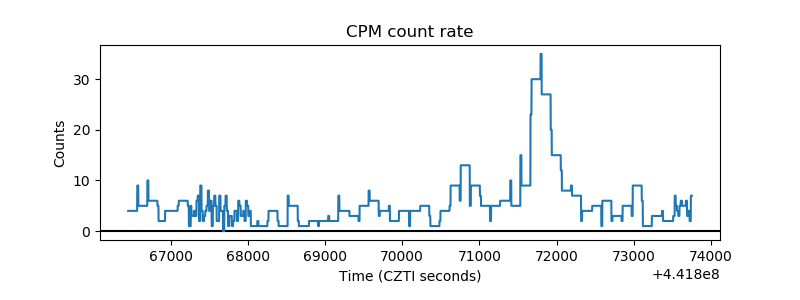 |
| CZT Counter | 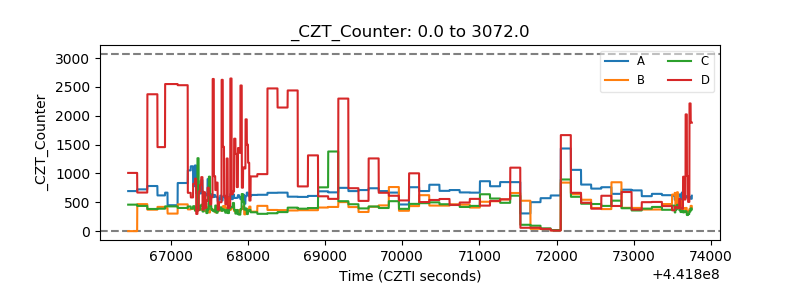 |
| +2.5 Volts monitor | 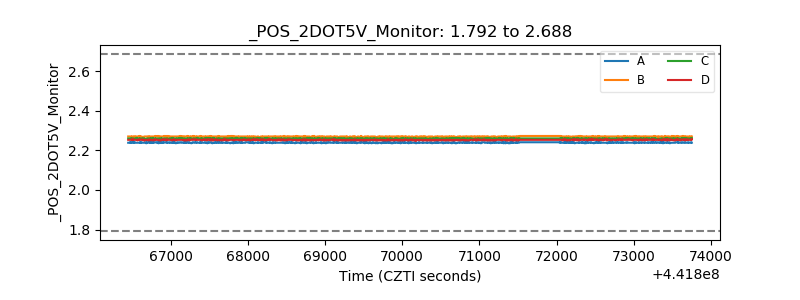 |
| +5 Volts monitor | 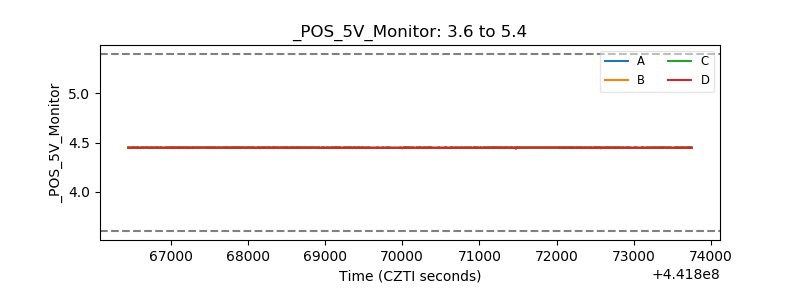 |
| _ROLL_ROT | 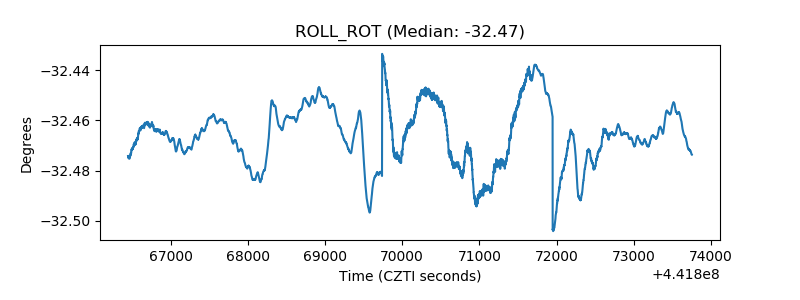 |
| _Roll_DEC | 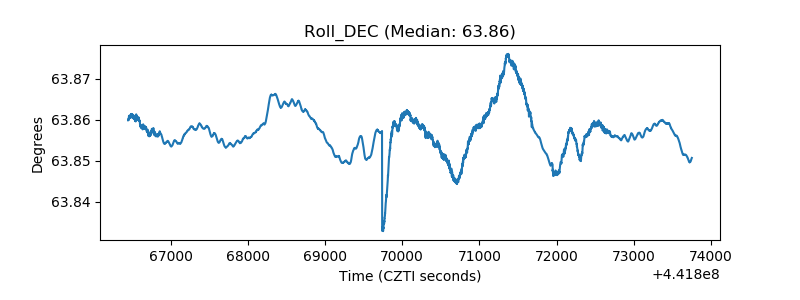 |
| _Roll_RA | 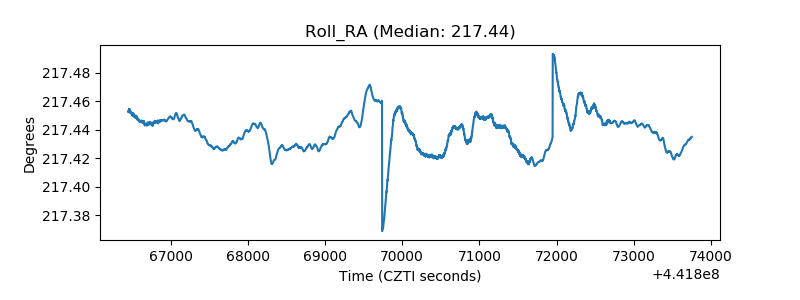 |
| Veto Counter | 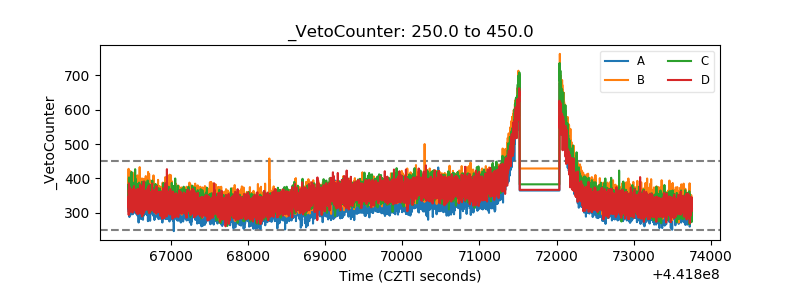 |