| Param | Original file | Final file |
|---|---|---|
| Filename | modeM0/AS1A13_072T01_9000006008_44686cztM0_level2.fits | modeM0/AS1A13_072T01_9000006008_44686cztM0_level2_quad_clean.evt |
| Size (bytes) | 1,178,516,160 | 252,092,160 |
| Size | 1.1 GB | 240.4 MB |
| Events in quadrant A | 12,301,728 | 1,691,900 |
| Events in quadrant B | 8,262,348 | 1,730,686 |
| Events in quadrant C | 7,104,845 | 1,661,771 |
| Events in quadrant D | 14,700,491 | 1,427,440 |
| Mode M0 | |||
|---|---|---|---|
| Quadrant | BADHDUFLAG | Total packets | Discarded packets |
| A | 0 | 50190 | 3 |
| B | 0 | 35633 | 3 |
| C | 0 | 33292 | 3 |
| D | 0 | 55016 | 3 |
| Mode SS | |||
|---|---|---|---|
| Quadrant | BADHDUFLAG | Total packets | Discarded packets |
| A | 0 | 332 | 0 |
| B | 0 | 332 | 0 |
| C | 0 | 332 | 0 |
| D | 0 | 332 | 0 |
| Mode M9 | |||
|---|---|---|---|
| Quadrant | BADHDUFLAG | Total packets | Discarded packets |
| A | 0 | 18 | 0 |
| B | 0 | 18 | 0 |
| C | 0 | 18 | 0 |
| D | 0 | 18 | 0 |
| Quadrant | Total seconds | Saturated seconds | Saturation percentage |
|---|---|---|---|
| A | 16238 | 417 | 2.568050% |
| B | 16238 | 385 | 2.370982% |
| C | 16237 | 136 | 0.837593% |
| D | 16238 | 1459 | 8.985097% |
Noise dominated data is calculated using 1-second bins in cleaned event files. If a bin has >2000 counts, and if more than 50% of those come from <1% of pixels, then it is considered to be noise-dominated and hence unusable.
| Quadrant | # 1 sec bins | Bins with >0 counts | Bins with >2000 counts | High rate bins dominated by noise | Noise dominated (total time) | Noise dominated (detector-on time) | Marked lightcurve |
|---|---|---|---|---|---|---|---|
| A | 18093 | 16241 | 97 | 97 | 0.54% | 0.60% | 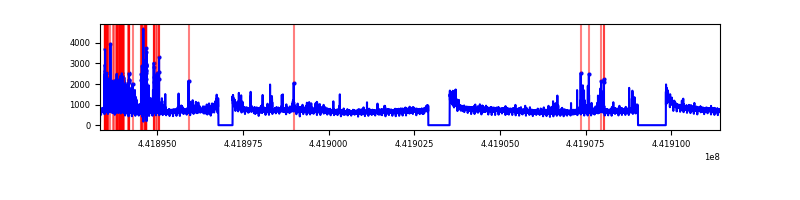 |
| B | 18093 | 16241 | 141 | 141 | 0.78% | 0.87% | 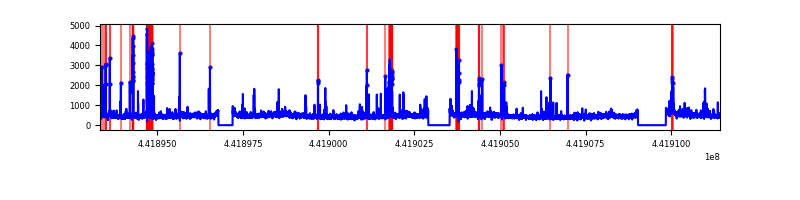 |
| C | 18092 | 16240 | 9 | 9 | 0.05% | 0.06% | 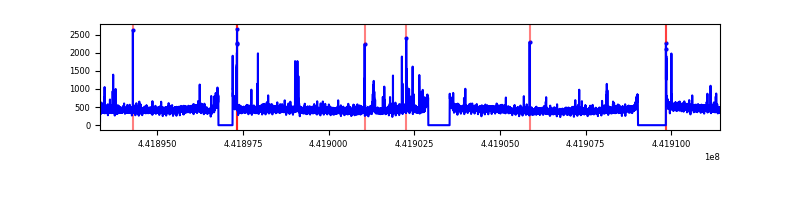 |
| D | 18093 | 16241 | 1091 | 1091 | 6.03% | 6.72% | 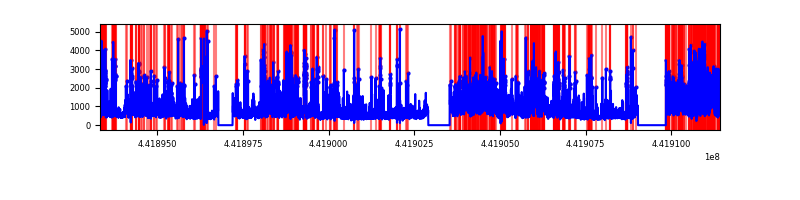 |
Top three noisy pixels from each quadrant. If the there are fewer than three noisy pixels in the level2.evt file, extra rows are filled as -1
| Pixel properties | Quadrant properties | ||||||
|---|---|---|---|---|---|---|---|
| Quadrant | DetID | PixID | Counts | Sigma | Mean | Median | Sigma |
| A | 10 | 83 | 4566520 | 12310.12 | 1785 | 1742 | 370.8 |
| A | 15 | 223 | 675900 | 1818.04 | 1785 | 1742 | 370.8 |
| A | 13 | 248 | 82175 | 216.91 | 1785 | 1742 | 370.8 |
| B | 4 | 171 | 324887 | 929.84 | 1774 | 1718 | 347.6 |
| B | 0 | 183 | 226544 | 646.88 | 1774 | 1718 | 347.6 |
| B | 0 | 186 | 151041 | 429.64 | 1774 | 1718 | 347.6 |
| C | 14 | 254 | 141190 | 338.38 | 1756 | 1766 | 412.0 |
| C | 3 | 233 | 60532 | 142.62 | 1756 | 1766 | 412.0 |
| C | 2 | 14 | 39095 | 90.6 | 1756 | 1766 | 412.0 |
| D | 1 | 52 | 4232003 | 10050.43 | 1688 | 1635 | 420.9 |
| D | 2 | 249 | 1237680 | 2936.57 | 1688 | 1635 | 420.9 |
| D | 13 | 249 | 1182326 | 2805.06 | 1688 | 1635 | 420.9 |
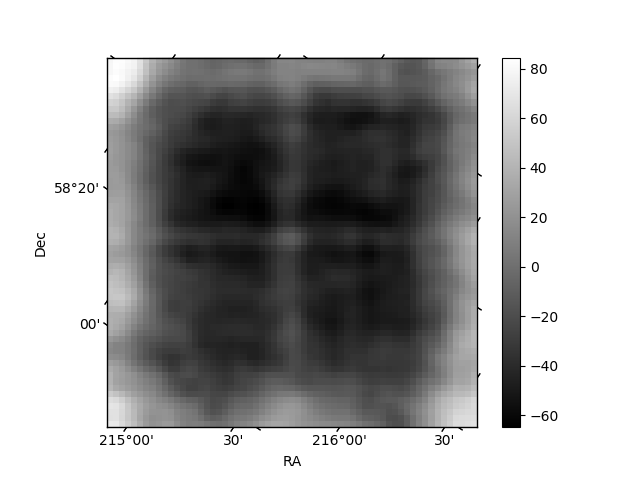
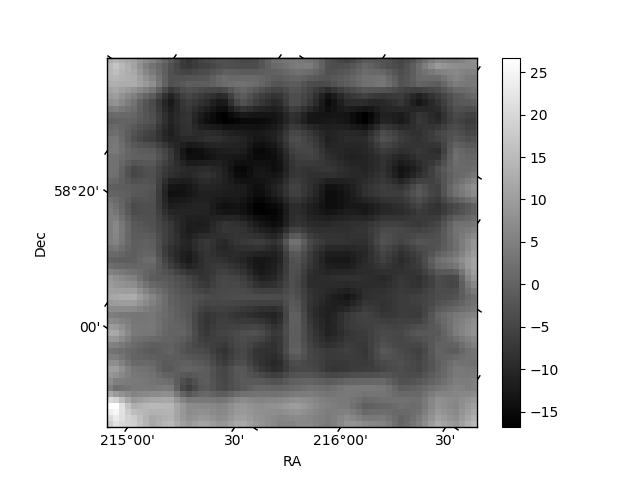
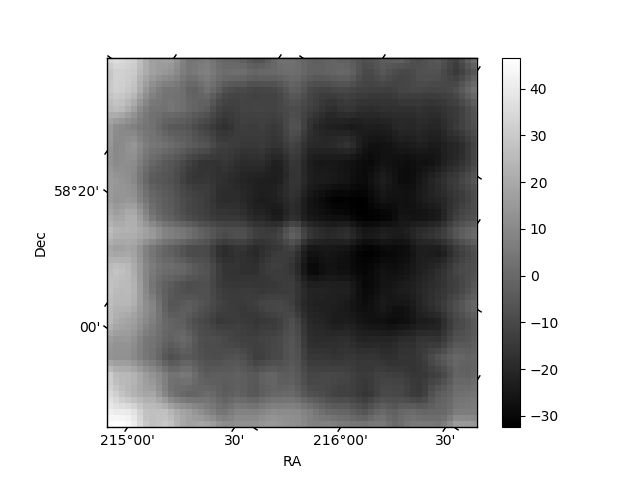
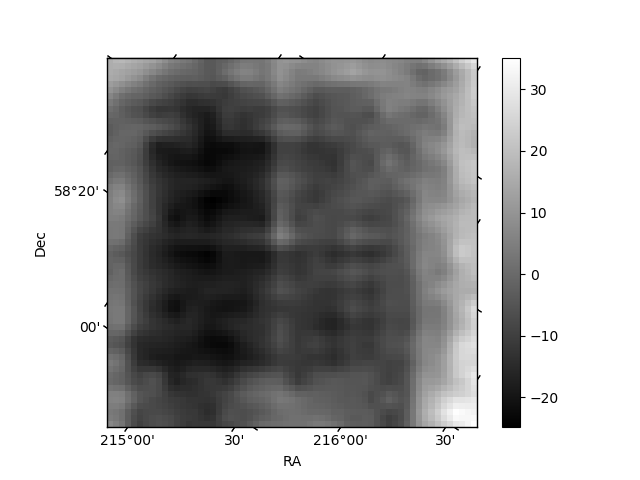
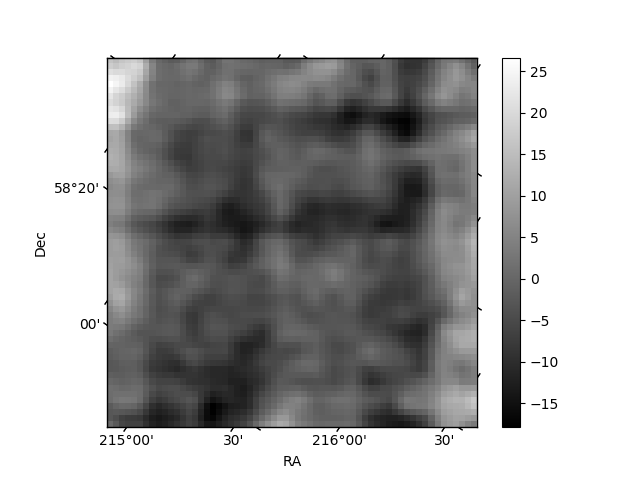
Histogram calculated using DETX and DETY for each event in the final _common_clean file
| Quadrant A | 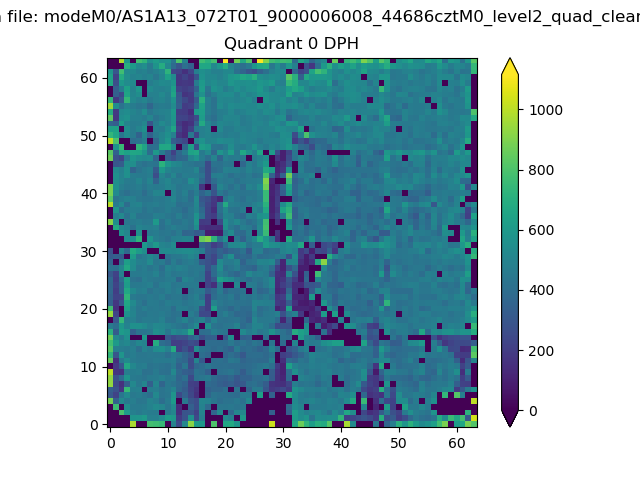 |
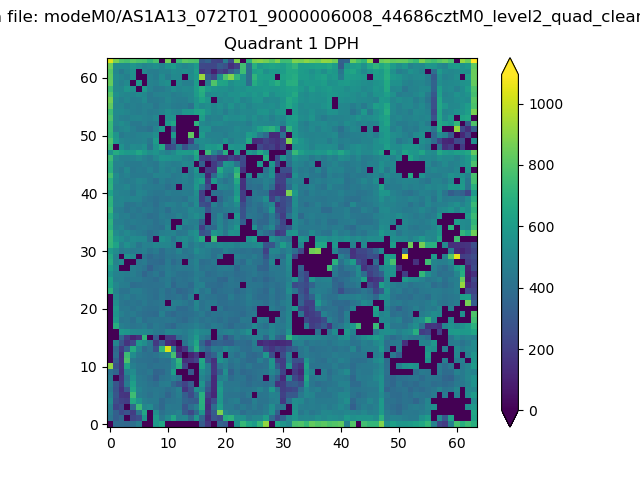 |
Quadrant B |
|---|---|---|---|
| Quadrant D | 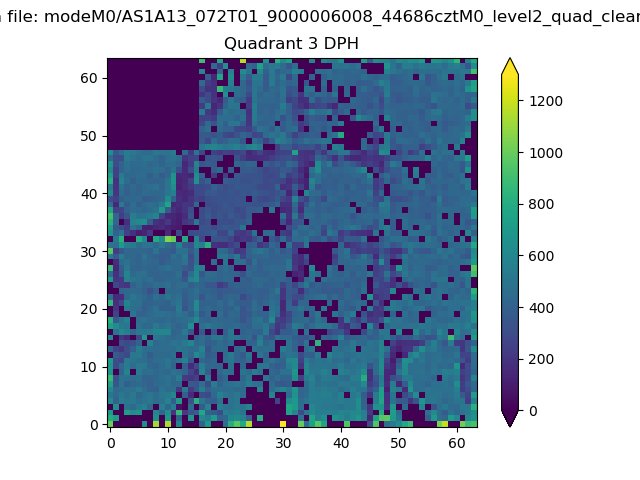 |
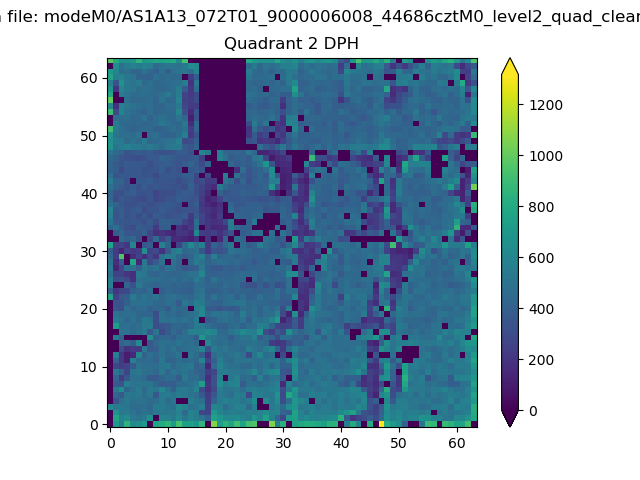 |
Quadrant C |
| Plot type | Count rate plots | Images |
|---|---|---|
| Comparison with Poisson distribution Blue bars denote a histogram of data divided into 1 sec bins. Red curve is a Poisson curve with rate = median count rate of data. |
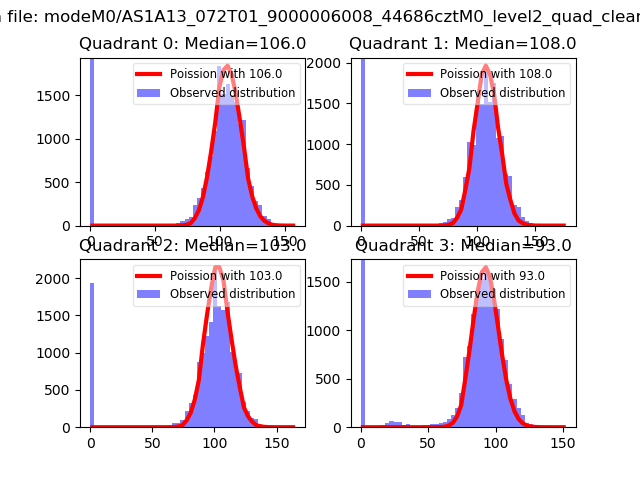 |
 |
| Quadrant-wise count rates Data is divided into 100 sec bins |
 |
|
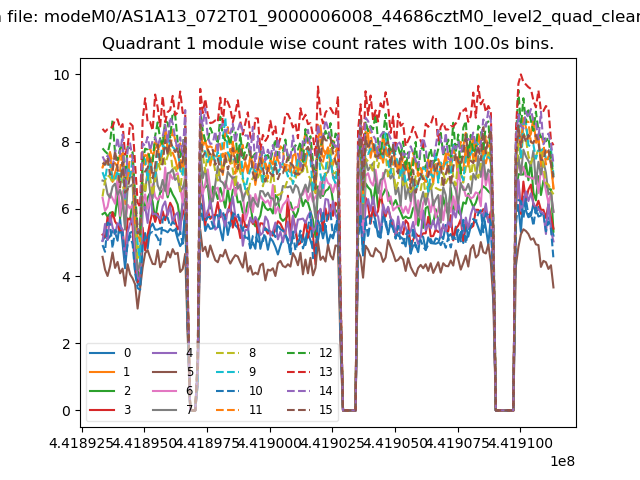
| Module-wise count rates for Quadrant A Data is divided into 100 sec bins |
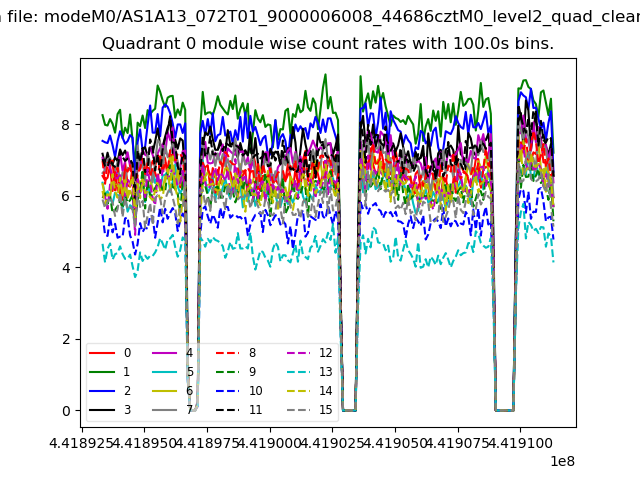 |
 |
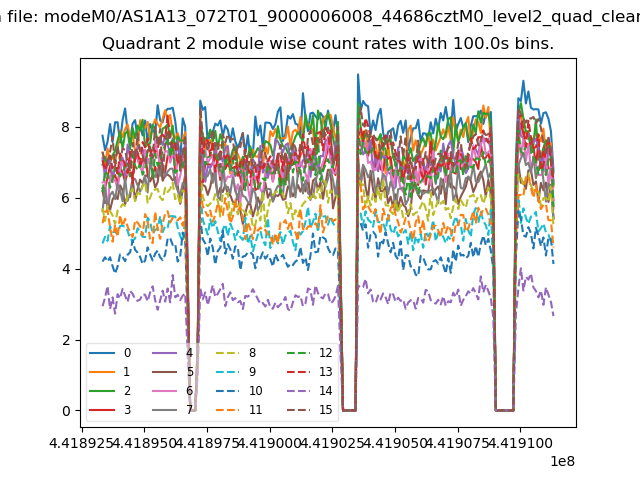
| Module-wise count rates for Quadrant B Data is divided into 100 sec bins |
 |
 |
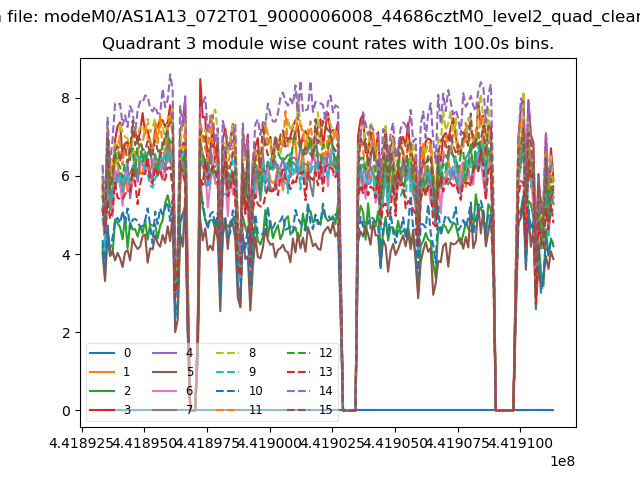
| Module-wise count rates for Quadrant C Data is divided into 100 sec bins |
 |
 |
| Module-wise count rates for Quadrant D Data is divided into 100 sec bins |
 |
 |
| Parameter | Plot |
|---|---|
| CZT HV Monitor | 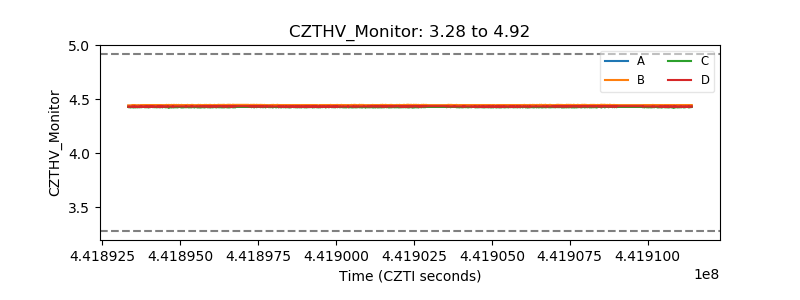 |
| D_VDD | 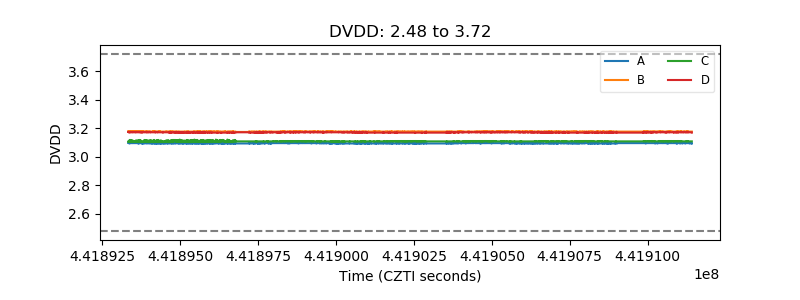 |
| Temperature 1 | 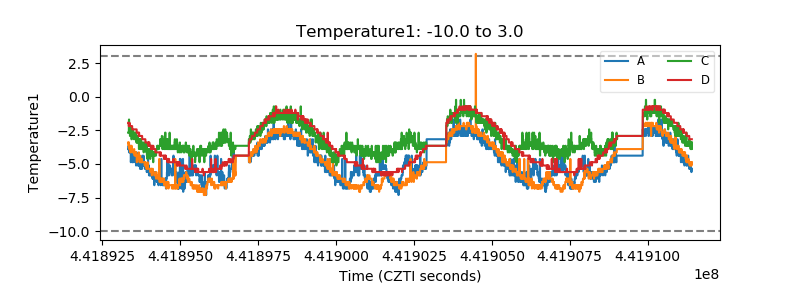 |
| Veto HV Monitor | 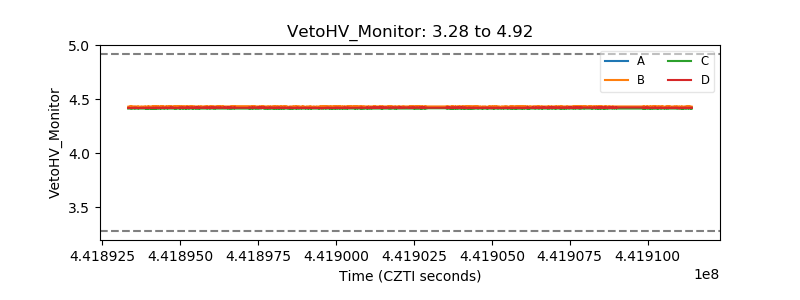 |
| Veto LLD | 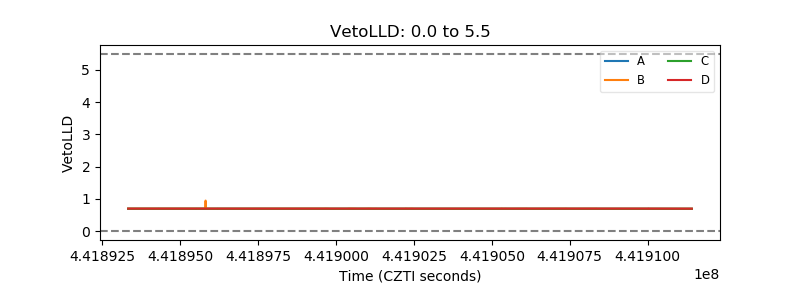 |
| Alpha Counter | 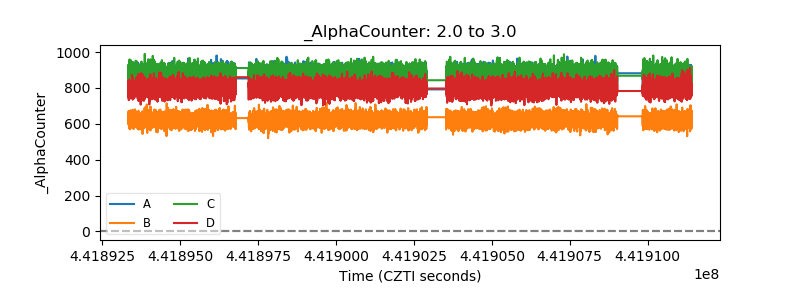 |
| _CPM_Rate | 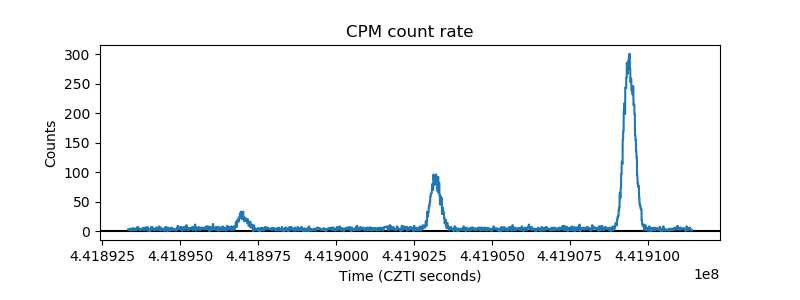 |
| CZT Counter | 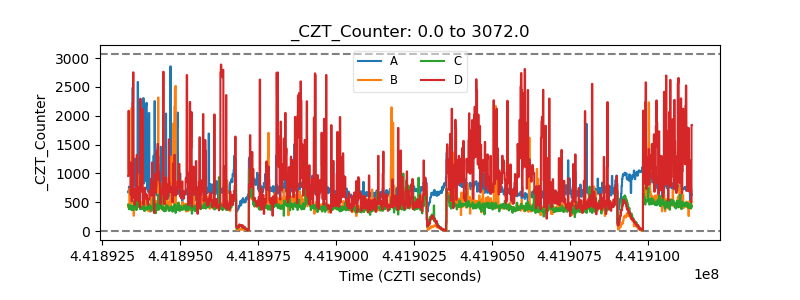 |
| +2.5 Volts monitor | 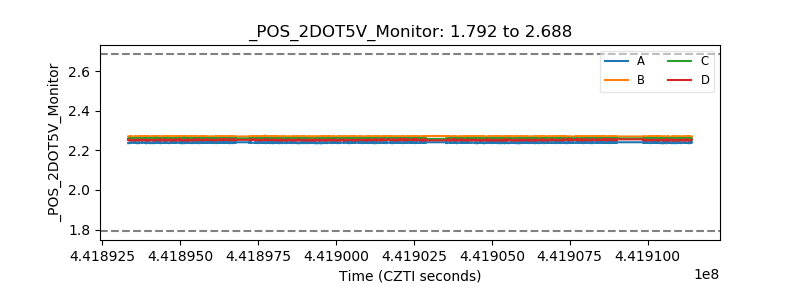 |
| +5 Volts monitor | 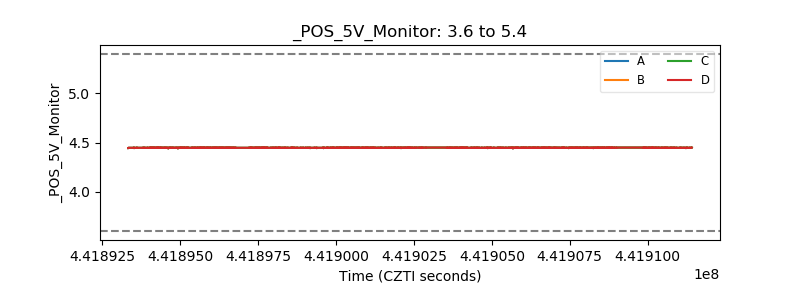 |
| _ROLL_ROT | 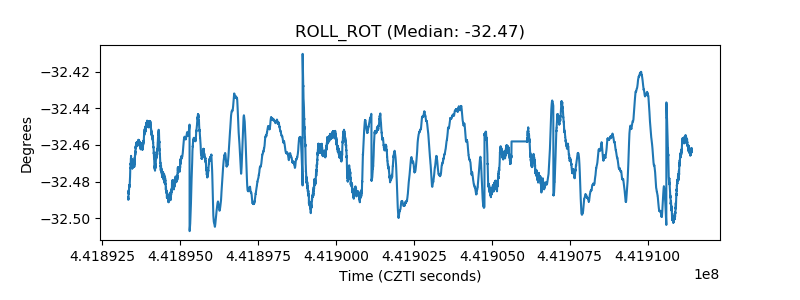 |
| _Roll_DEC | 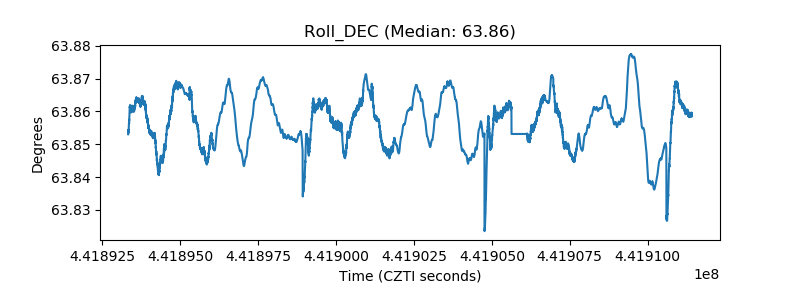 |
| _Roll_RA | 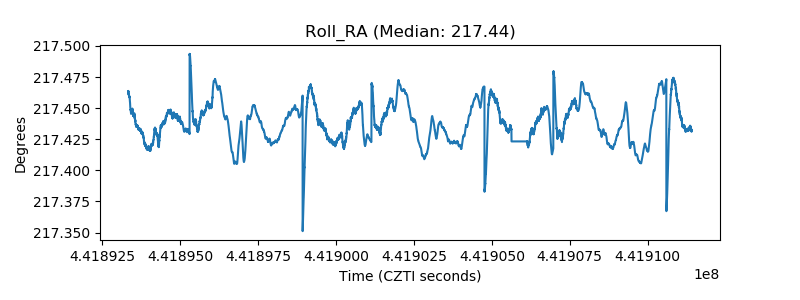 |
| Veto Counter | 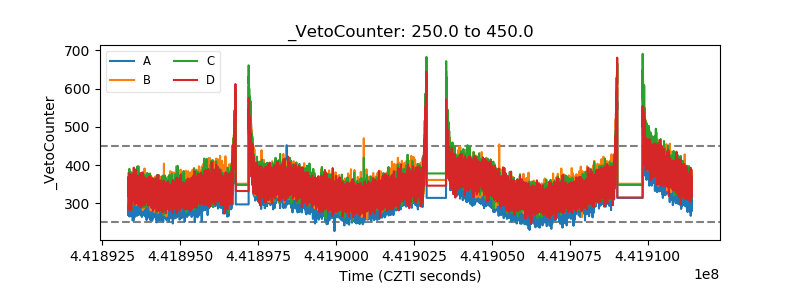 |