| Param | Original file | Final file |
|---|---|---|
| Filename | modeM0/AS1A13_072T01_9000006008_44687cztM0_level2.fits | modeM0/AS1A13_072T01_9000006008_44687cztM0_level2_quad_clean.evt |
| Size (bytes) | 463,268,160 | 103,947,840 |
| Size | 441.8 MB | 99.1 MB |
| Events in quadrant A | 4,831,276 | 692,341 |
| Events in quadrant B | 3,155,671 | 724,831 |
| Events in quadrant C | 2,867,252 | 684,424 |
| Events in quadrant D | 5,791,849 | 594,527 |
| Mode M0 | |||
|---|---|---|---|
| Quadrant | BADHDUFLAG | Total packets | Discarded packets |
| A | 0 | 19758 | 3 |
| B | 0 | 13940 | 1 |
| C | 0 | 13275 | 1 |
| D | 0 | 21793 | 1 |
| Mode SS | |||
|---|---|---|---|
| Quadrant | BADHDUFLAG | Total packets | Discarded packets |
| A | 0 | 130 | 0 |
| B | 0 | 130 | 0 |
| C | 0 | 130 | 0 |
| D | 0 | 130 | 0 |
| Mode M9 | |||
|---|---|---|---|
| Quadrant | BADHDUFLAG | Total packets | Discarded packets |
| A | 0 | 10 | 0 |
| B | 0 | 10 | 0 |
| C | 0 | 10 | 0 |
| D | 0 | 10 | 0 |
| Quadrant | Total seconds | Saturated seconds | Saturation percentage |
|---|---|---|---|
| A | 6471 | 131 | 2.024417% |
| B | 6472 | 70 | 1.081582% |
| C | 6472 | 39 | 0.602596% |
| D | 6472 | 547 | 8.451792% |
Noise dominated data is calculated using 1-second bins in cleaned event files. If a bin has >2000 counts, and if more than 50% of those come from <1% of pixels, then it is considered to be noise-dominated and hence unusable.
| Quadrant | # 1 sec bins | Bins with >0 counts | Bins with >2000 counts | High rate bins dominated by noise | Noise dominated (total time) | Noise dominated (detector-on time) | Marked lightcurve |
|---|---|---|---|---|---|---|---|
| A | 7456 | 6472 | 20 | 20 | 0.27% | 0.31% | 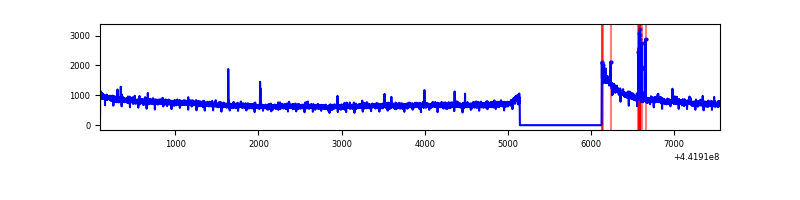 |
| B | 7457 | 6473 | 10 | 10 | 0.13% | 0.15% | 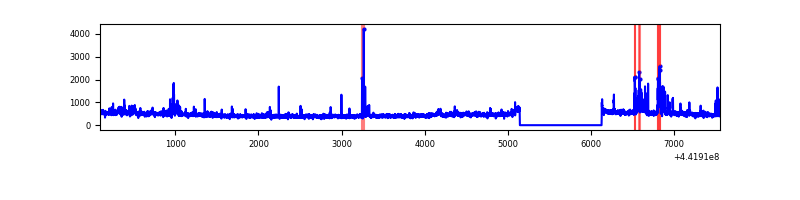 |
| C | 7457 | 6473 | 3 | 3 | 0.04% | 0.05% | 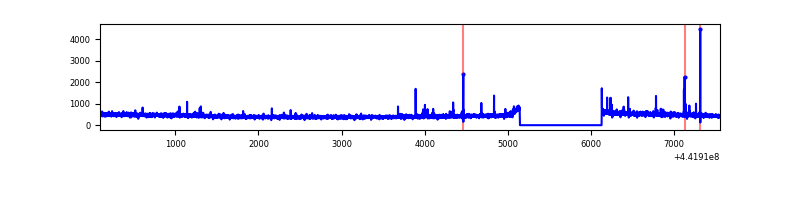 |
| D | 7457 | 6473 | 418 | 418 | 5.61% | 6.46% | 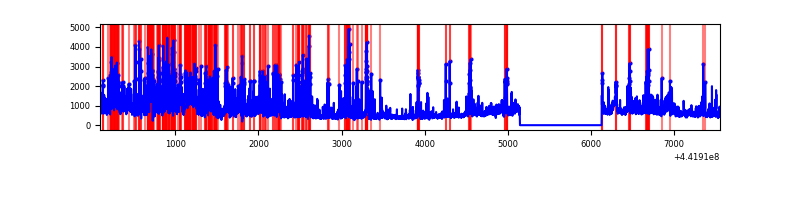 |
Top three noisy pixels from each quadrant. If the there are fewer than three noisy pixels in the level2.evt file, extra rows are filled as -1
| Pixel properties | Quadrant properties | ||||||
|---|---|---|---|---|---|---|---|
| Quadrant | DetID | PixID | Counts | Sigma | Mean | Median | Sigma |
| A | 10 | 83 | 1910724 | 12725.55 | 720 | 704 | 150.1 |
| A | 0 | 243 | 60157 | 396.11 | 720 | 704 | 150.1 |
| A | 15 | 223 | 43313 | 283.88 | 720 | 704 | 150.1 |
| B | 0 | 186 | 152563 | 1073.89 | 719 | 695 | 141.4 |
| B | 0 | 183 | 48757 | 339.86 | 719 | 695 | 141.4 |
| B | 4 | 171 | 26223 | 180.51 | 719 | 695 | 141.4 |
| C | 14 | 254 | 44365 | 261.44 | 712 | 716 | 167.0 |
| C | 1 | 3 | 19086 | 110.03 | 712 | 716 | 167.0 |
| C | 3 | 233 | 12826 | 72.53 | 712 | 716 | 167.0 |
| D | 1 | 52 | 1117169 | 6493.89 | 687 | 665 | 171.9 |
| D | 13 | 249 | 1023434 | 5948.7 | 687 | 665 | 171.9 |
| D | 2 | 249 | 485724 | 2821.23 | 687 | 665 | 171.9 |
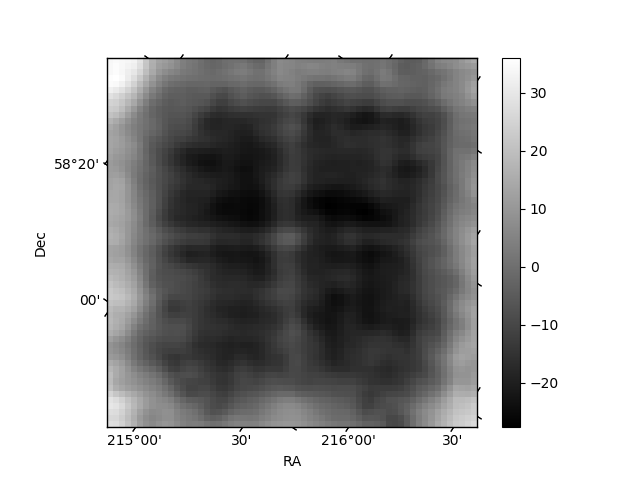
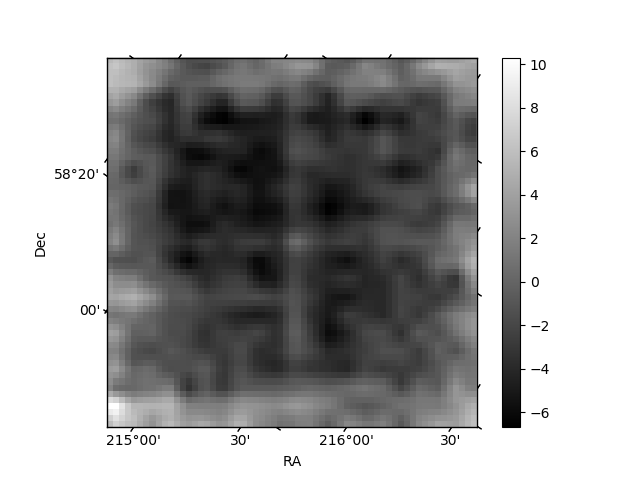
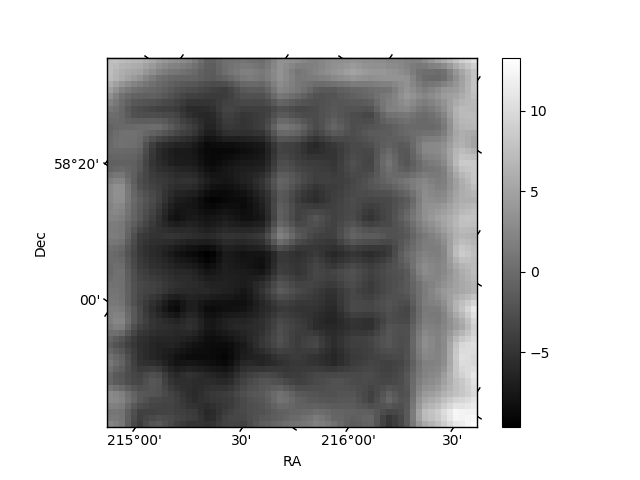
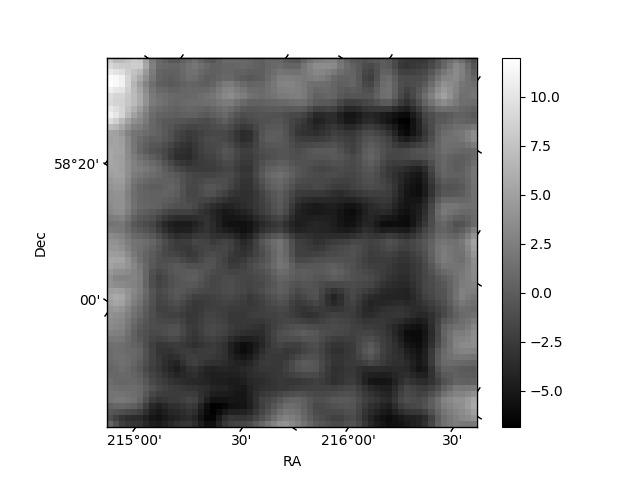
Histogram calculated using DETX and DETY for each event in the final _common_clean file
| Quadrant A | 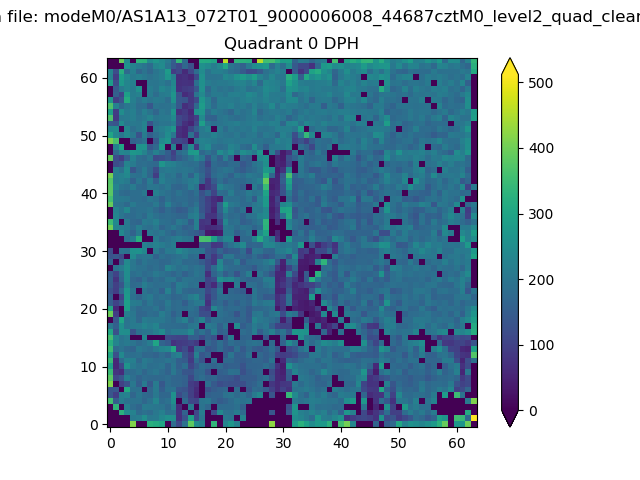 |
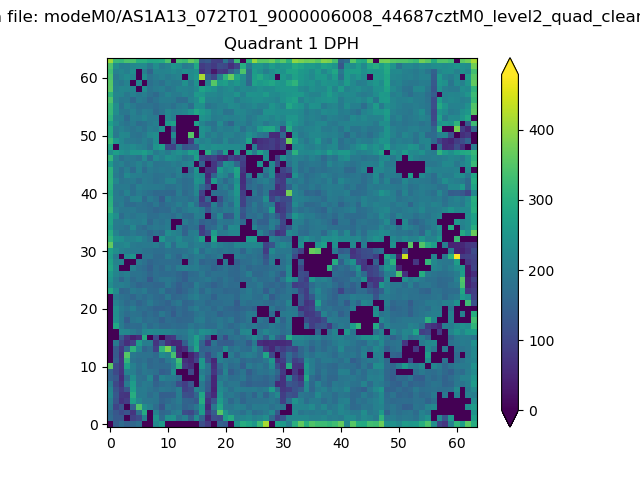 |
Quadrant B |
|---|---|---|---|
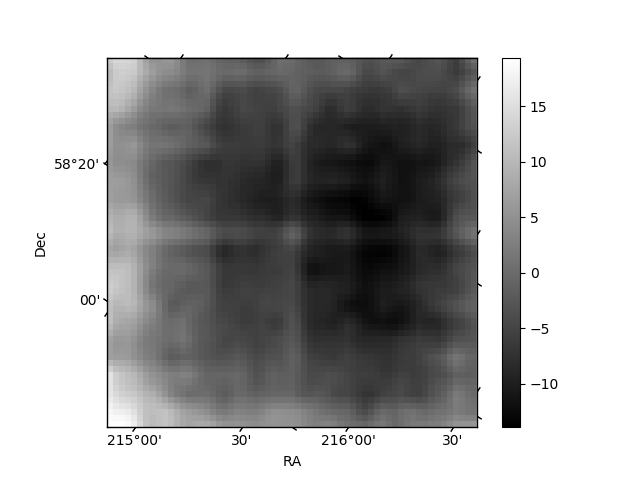
| Quadrant D | 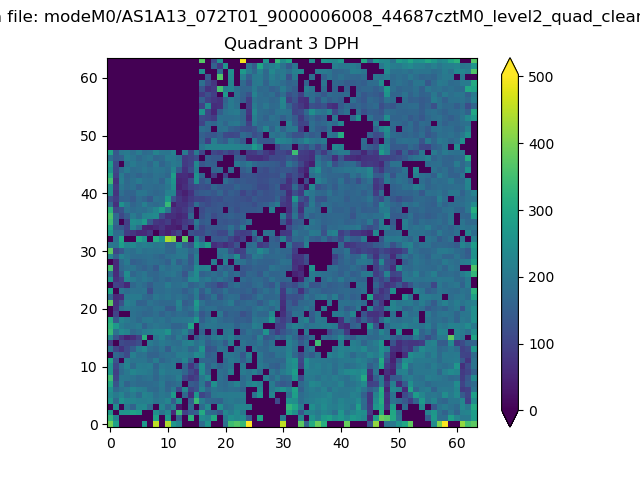 |
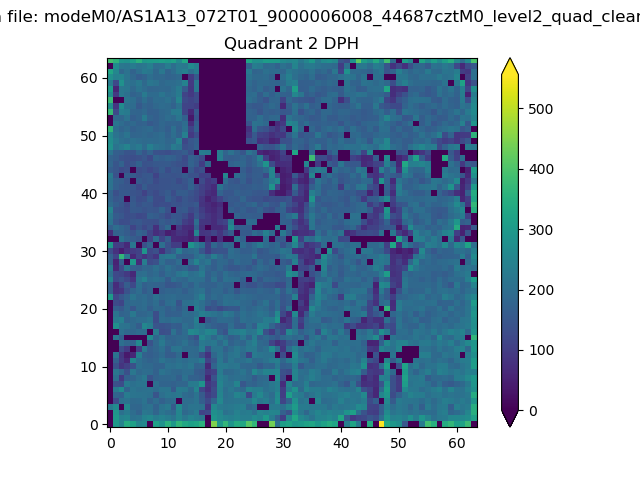 |
Quadrant C |
| Plot type | Count rate plots | Images |
|---|---|---|
| Comparison with Poisson distribution Blue bars denote a histogram of data divided into 1 sec bins. Red curve is a Poisson curve with rate = median count rate of data. |
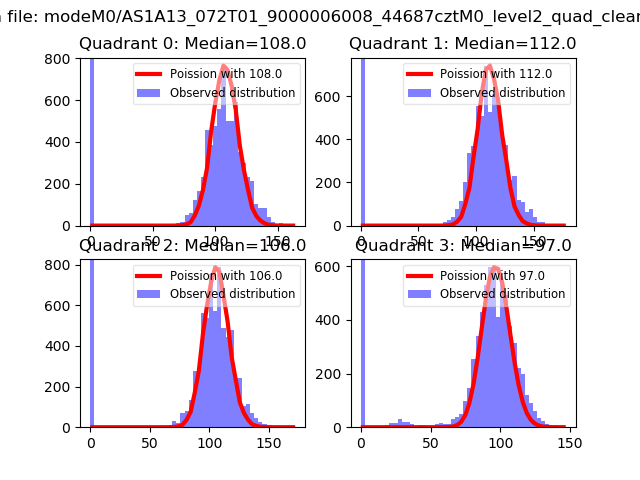 |
 |
| Quadrant-wise count rates Data is divided into 100 sec bins |
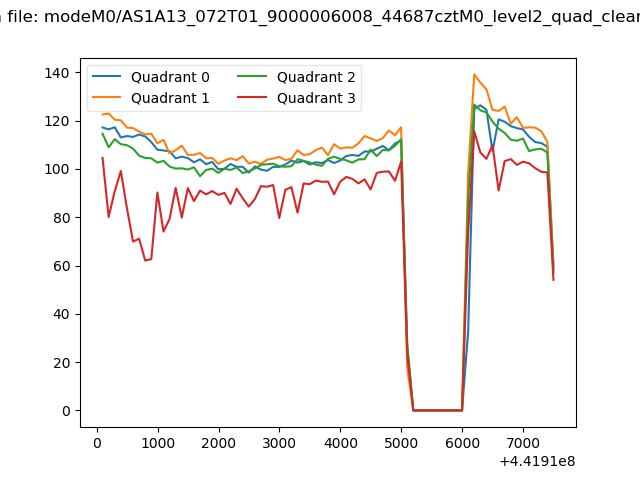 |
|
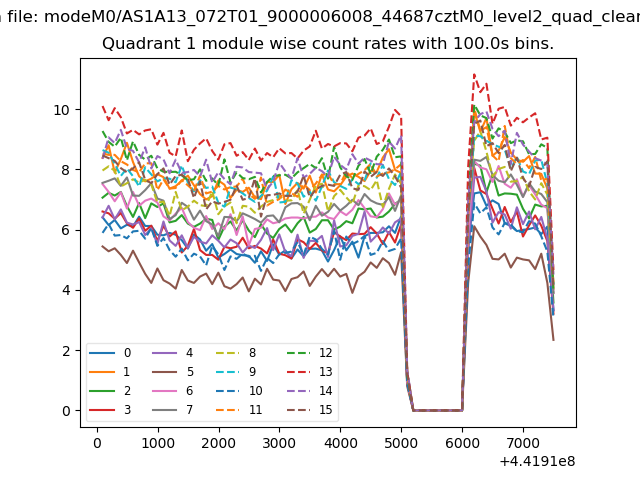
| Module-wise count rates for Quadrant A Data is divided into 100 sec bins |
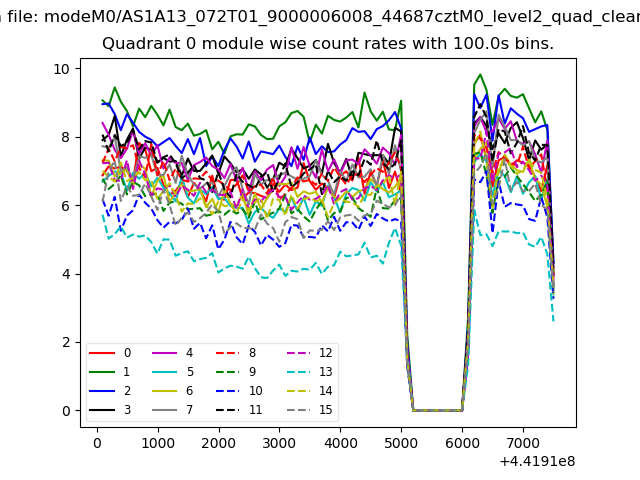 |
 |
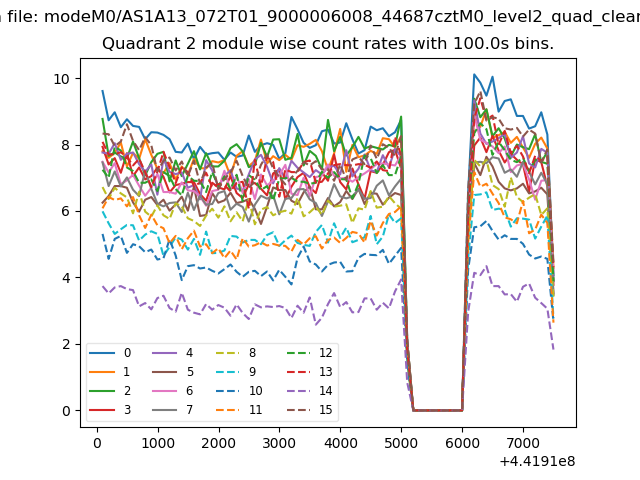
| Module-wise count rates for Quadrant B Data is divided into 100 sec bins |
 |
 |
| Module-wise count rates for Quadrant C Data is divided into 100 sec bins |
 |
 |
| Module-wise count rates for Quadrant D Data is divided into 100 sec bins |
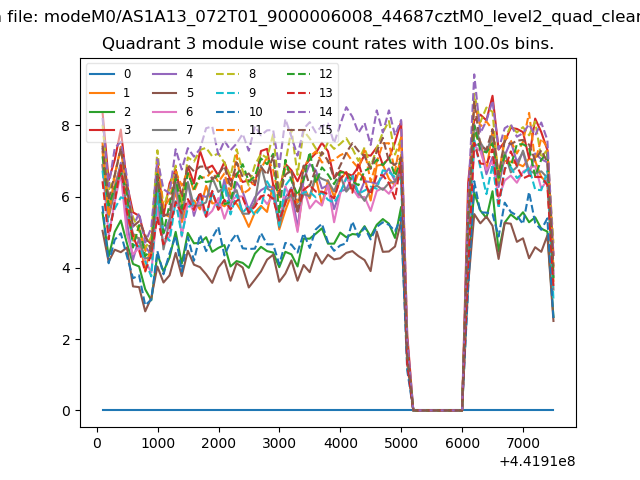 |
 |
| Parameter | Plot |
|---|---|
| CZT HV Monitor |  |
| D_VDD | 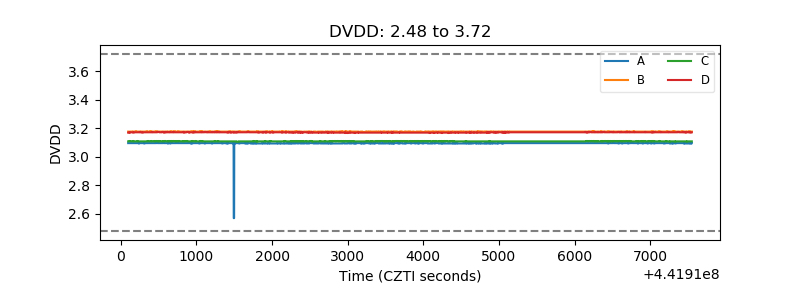 |
| Temperature 1 | 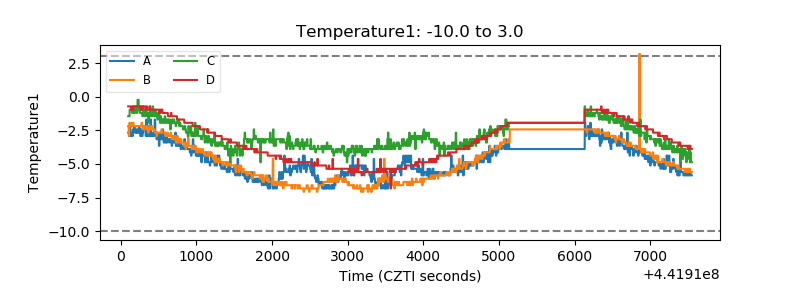 |
| Veto HV Monitor | 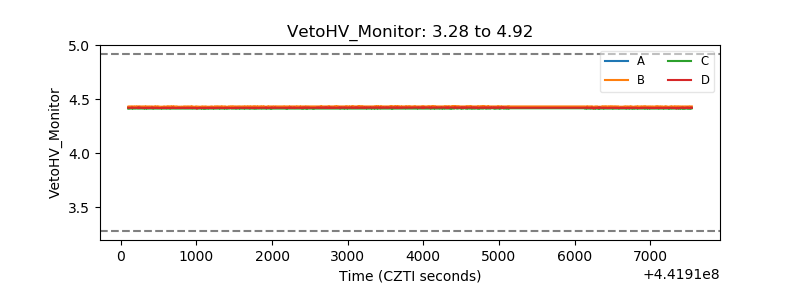 |
| Veto LLD | 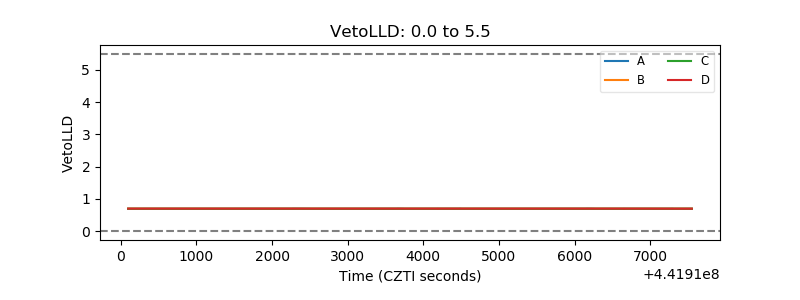 |
| Alpha Counter | 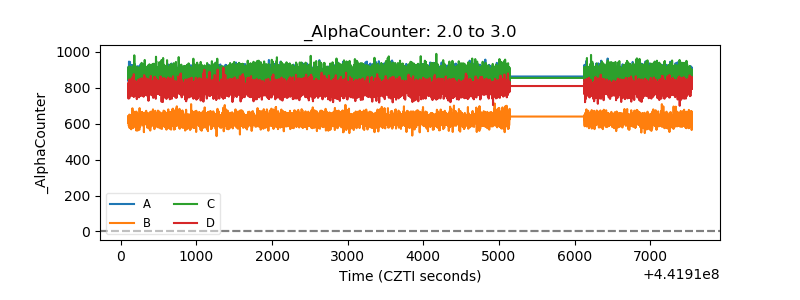 |
| _CPM_Rate | 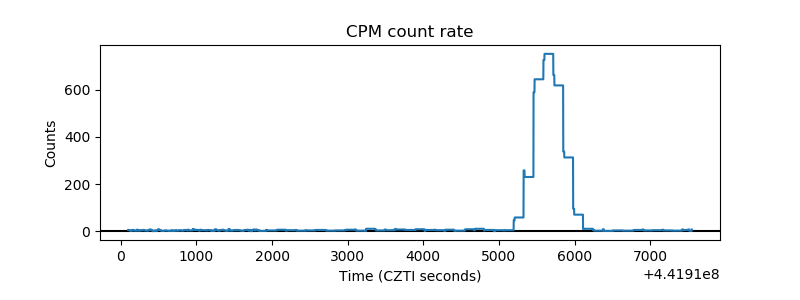 |
| CZT Counter | 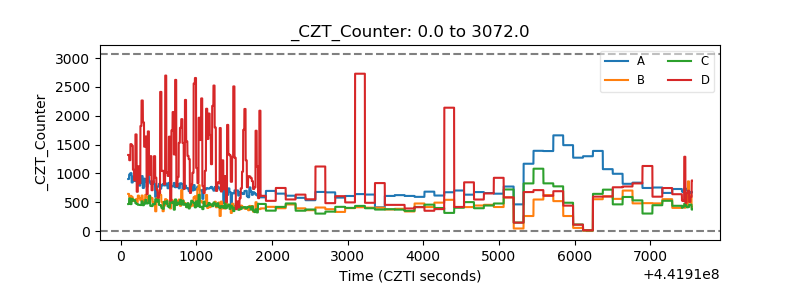 |
| +2.5 Volts monitor | 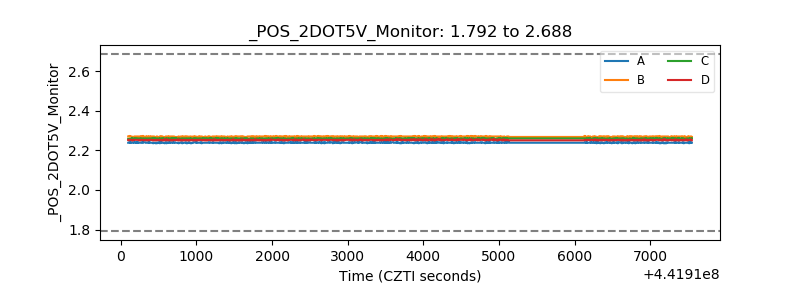 |
| +5 Volts monitor | 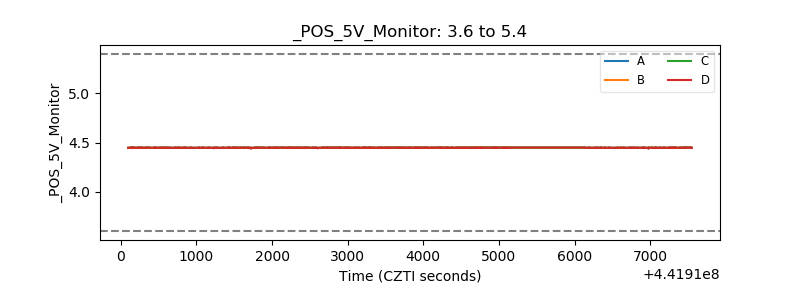 |
| _ROLL_ROT | 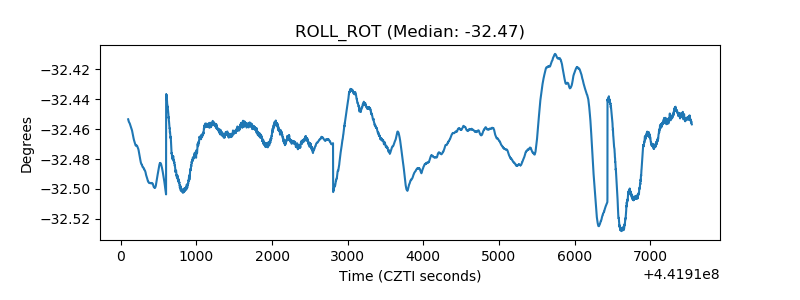 |
| _Roll_DEC | 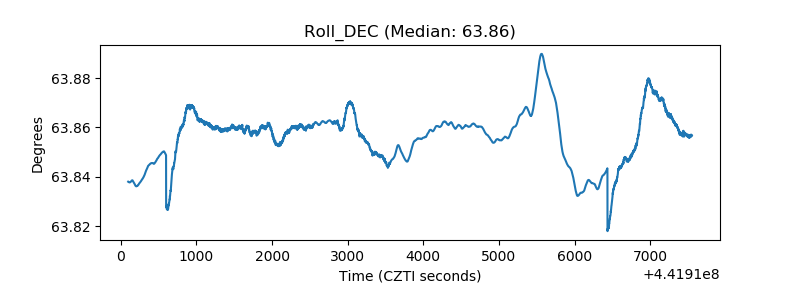 |
| _Roll_RA | 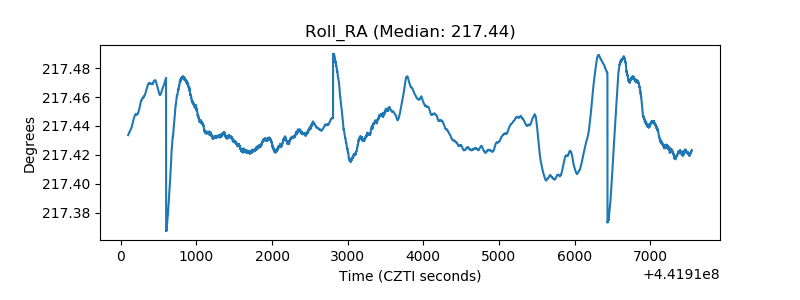 |
| Veto Counter | 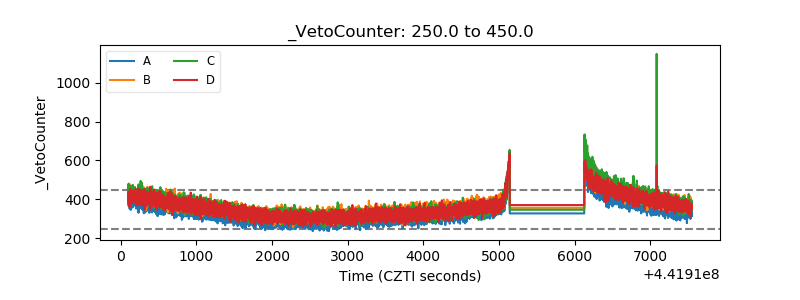 |