| Param | Original file | Final file |
|---|---|---|
| Filename | modeM0/AS1A13_072T01_9000006008_44689cztM0_level2.fits | modeM0/AS1A13_072T01_9000006008_44689cztM0_level2_quad_clean.evt |
| Size (bytes) | 453,899,520 | 106,606,080 |
| Size | 432.9 MB | 101.7 MB |
| Events in quadrant A | 5,059,521 | 712,398 |
| Events in quadrant B | 3,448,610 | 731,054 |
| Events in quadrant C | 3,285,794 | 702,666 |
| Events in quadrant D | 4,510,115 | 634,757 |
| Mode M0 | |||
|---|---|---|---|
| Quadrant | BADHDUFLAG | Total packets | Discarded packets |
| A | 0 | 20250 | 1 |
| B | 0 | 14744 | 1 |
| C | 0 | 14412 | 1 |
| D | 0 | 17909 | 1 |
| Mode SS | |||
|---|---|---|---|
| Quadrant | BADHDUFLAG | Total packets | Discarded packets |
| A | 0 | 130 | 0 |
| B | 0 | 130 | 0 |
| C | 0 | 130 | 0 |
| D | 0 | 130 | 0 |
| Mode M9 | |||
|---|---|---|---|
| Quadrant | BADHDUFLAG | Total packets | Discarded packets |
| A | 0 | 11 | 0 |
| B | 0 | 11 | 0 |
| C | 0 | 11 | 0 |
| D | 0 | 11 | 0 |
| Quadrant | Total seconds | Saturated seconds | Saturation percentage |
|---|---|---|---|
| A | 6410 | 147 | 2.293292% |
| B | 6410 | 173 | 2.698908% |
| C | 6411 | 108 | 1.684605% |
| D | 6410 | 257 | 4.009360% |
Noise dominated data is calculated using 1-second bins in cleaned event files. If a bin has >2000 counts, and if more than 50% of those come from <1% of pixels, then it is considered to be noise-dominated and hence unusable.
| Quadrant | # 1 sec bins | Bins with >0 counts | Bins with >2000 counts | High rate bins dominated by noise | Noise dominated (total time) | Noise dominated (detector-on time) | Marked lightcurve |
|---|---|---|---|---|---|---|---|
| A | 7525 | 6411 | 32 | 32 | 0.43% | 0.50% | 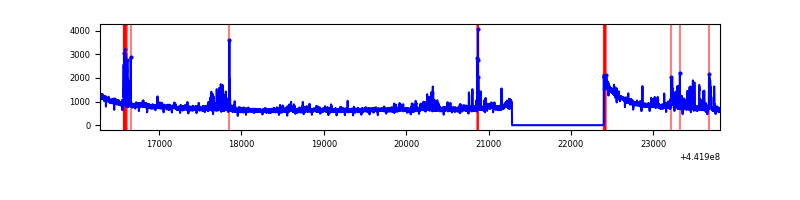 |
| B | 7525 | 6411 | 76 | 76 | 1.01% | 1.19% | 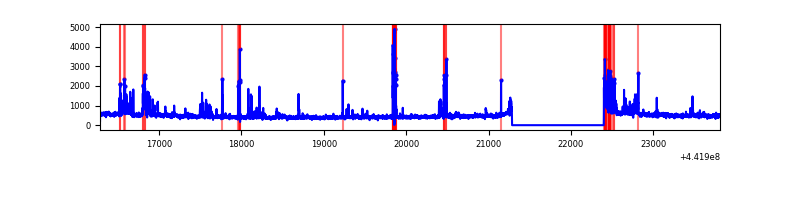 |
| C | 7526 | 6412 | 71 | 71 | 0.94% | 1.11% | 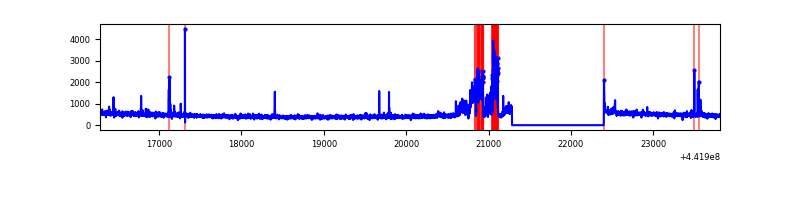 |
| D | 7525 | 6411 | 180 | 180 | 2.39% | 2.81% | 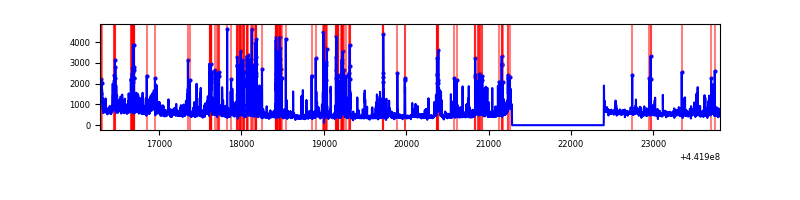 |
Top three noisy pixels from each quadrant. If the there are fewer than three noisy pixels in the level2.evt file, extra rows are filled as -1
| Pixel properties | Quadrant properties | ||||||
|---|---|---|---|---|---|---|---|
| Quadrant | DetID | PixID | Counts | Sigma | Mean | Median | Sigma |
| A | 10 | 83 | 1903192 | 12728.96 | 718 | 702 | 149.5 |
| A | 15 | 223 | 275593 | 1839.21 | 718 | 702 | 149.5 |
| A | 0 | 243 | 59895 | 396.04 | 718 | 702 | 149.5 |
| B | 0 | 186 | 276805 | 1966.45 | 717 | 695 | 140.4 |
| B | 0 | 219 | 99466 | 703.45 | 717 | 695 | 140.4 |
| B | 5 | 255 | 66012 | 465.19 | 717 | 695 | 140.4 |
| C | 14 | 254 | 456305 | 2736.86 | 712 | 717 | 166.5 |
| C | 1 | 3 | 17857 | 102.97 | 712 | 717 | 166.5 |
| C | 3 | 233 | 16535 | 95.02 | 712 | 717 | 166.5 |
| D | 13 | 249 | 681331 | 3899.29 | 702 | 680 | 174.6 |
| D | 1 | 52 | 357050 | 2041.56 | 702 | 680 | 174.6 |
| D | 11 | 241 | 210845 | 1203.98 | 702 | 680 | 174.6 |
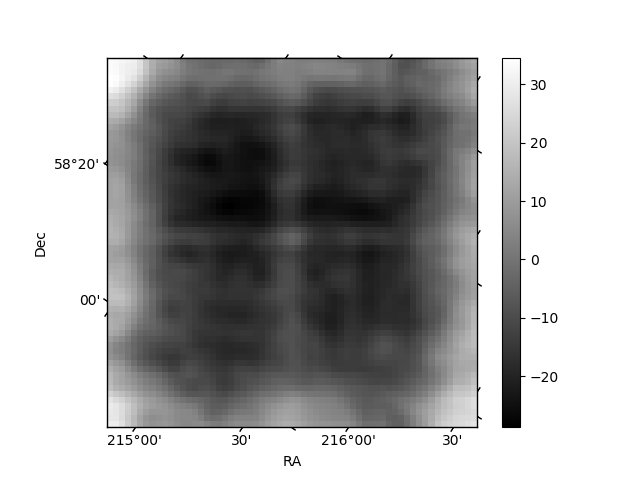
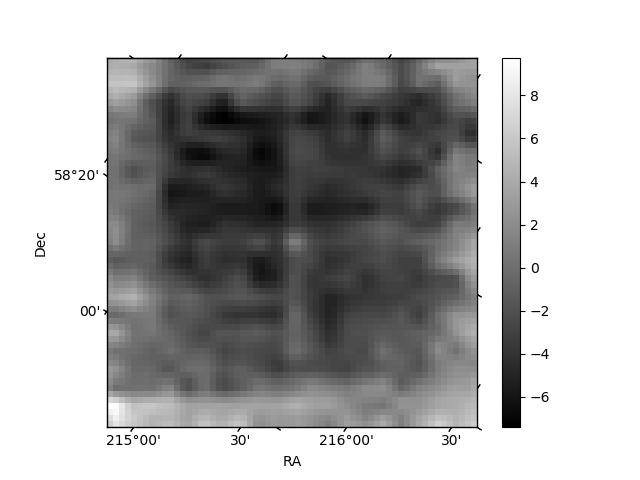
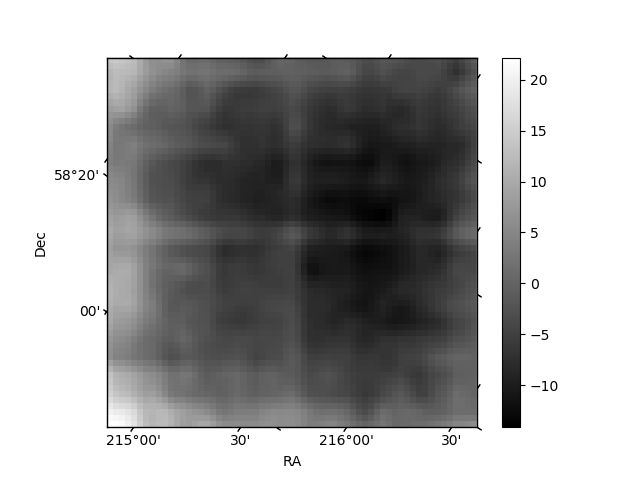
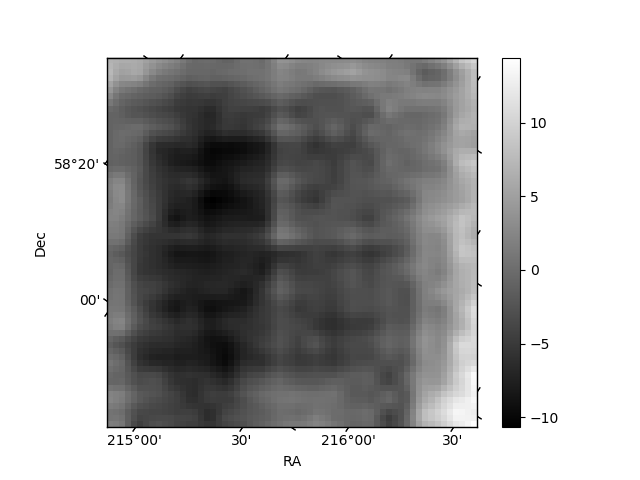
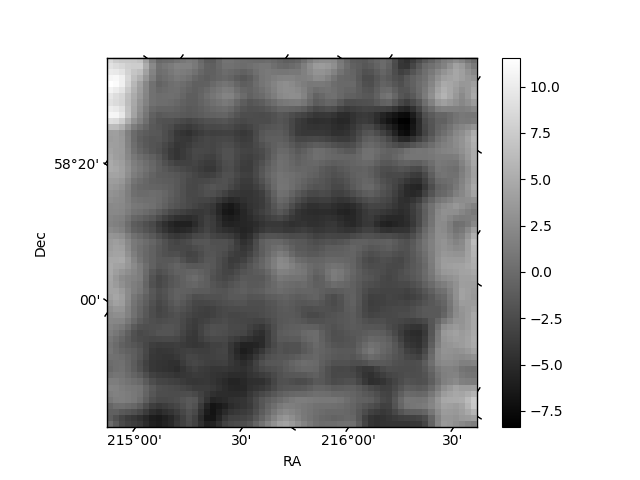
Histogram calculated using DETX and DETY for each event in the final _common_clean file
| Quadrant A | 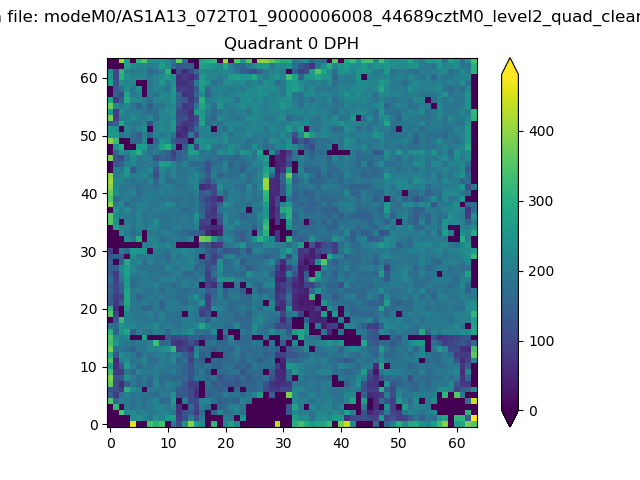 |
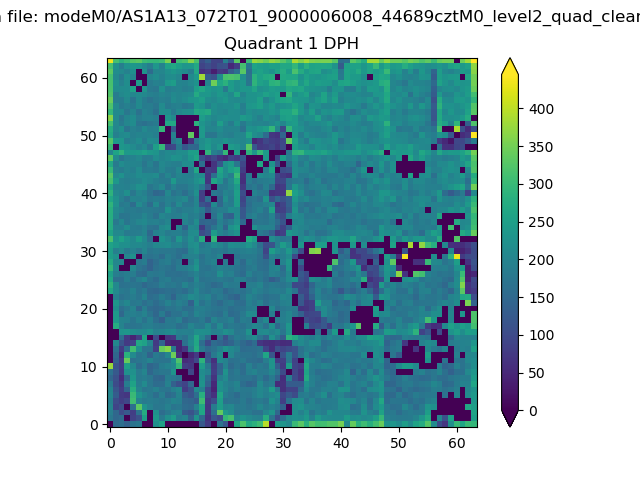 |
Quadrant B |
|---|---|---|---|
| Quadrant D | 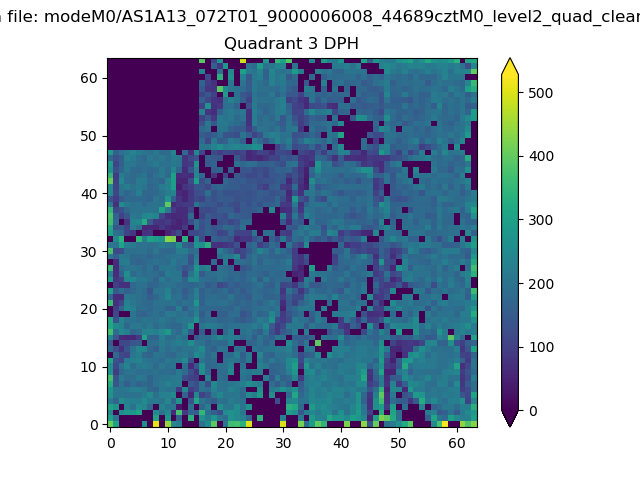 |
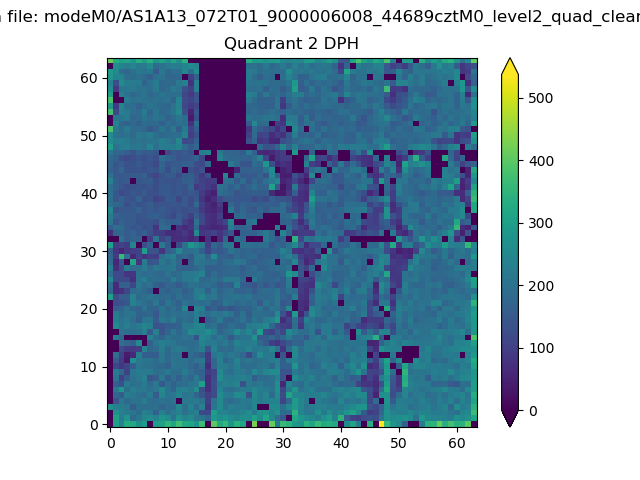 |
Quadrant C |
| Plot type | Count rate plots | Images |
|---|---|---|
| Comparison with Poisson distribution Blue bars denote a histogram of data divided into 1 sec bins. Red curve is a Poisson curve with rate = median count rate of data. |
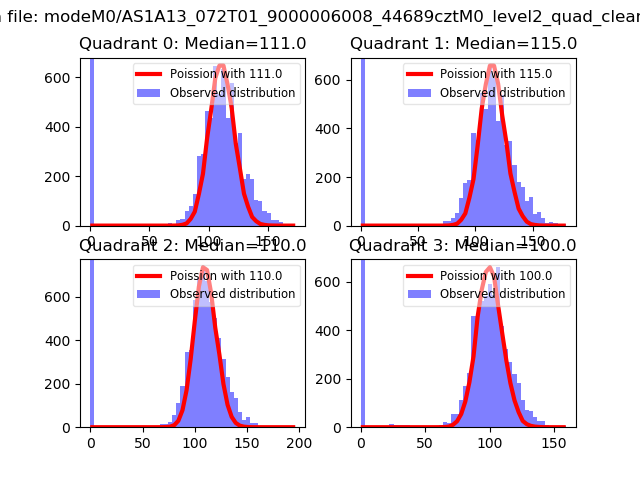 |
 |
| Quadrant-wise count rates Data is divided into 100 sec bins |
 |
|
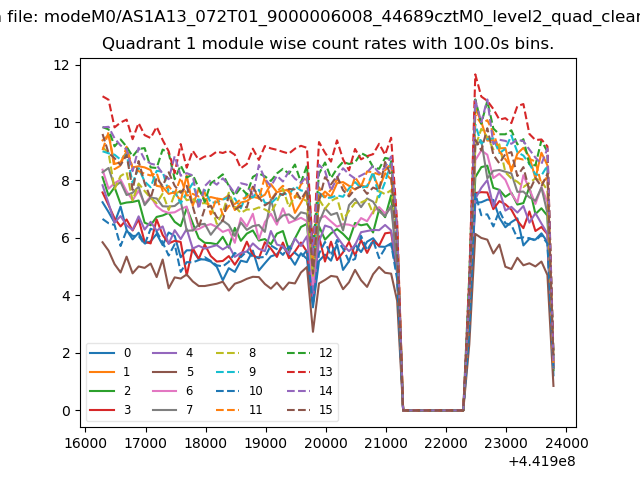
| Module-wise count rates for Quadrant A Data is divided into 100 sec bins |
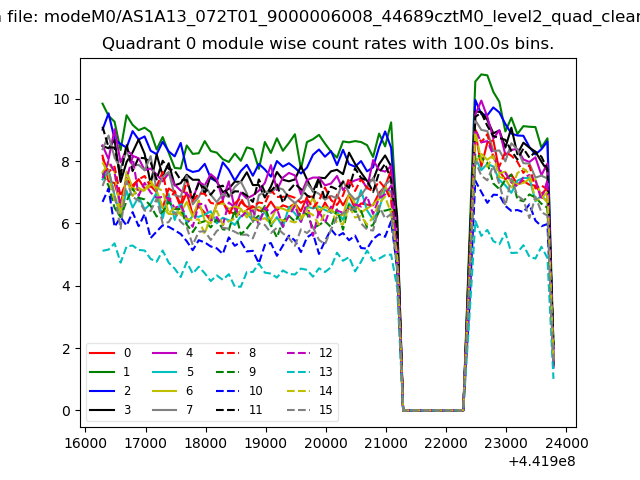 |
 |
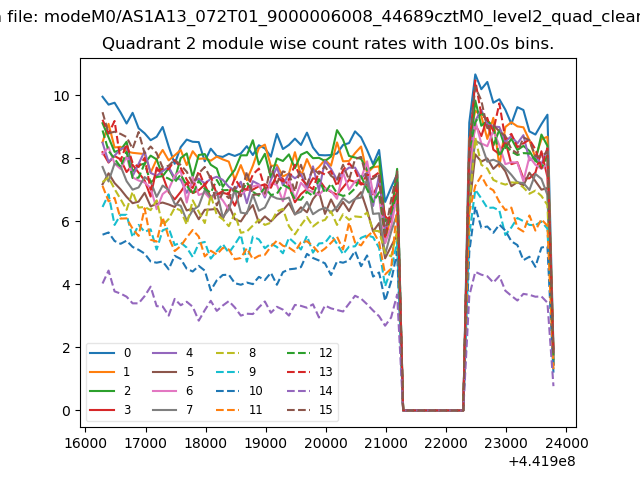
| Module-wise count rates for Quadrant B Data is divided into 100 sec bins |
 |
 |
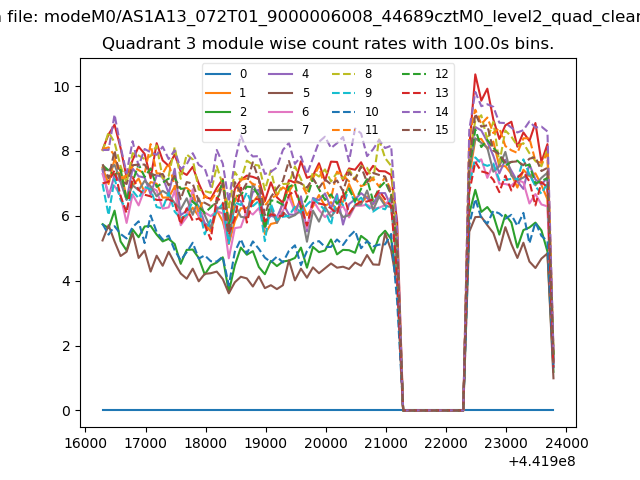
| Module-wise count rates for Quadrant C Data is divided into 100 sec bins |
 |
 |
| Module-wise count rates for Quadrant D Data is divided into 100 sec bins |
 |
 |
| Parameter | Plot |
|---|---|
| CZT HV Monitor | 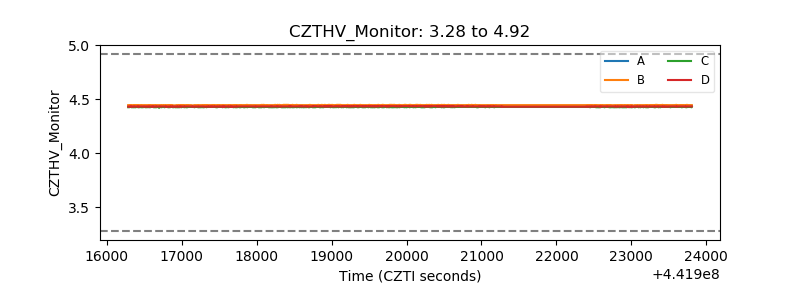 |
| D_VDD | 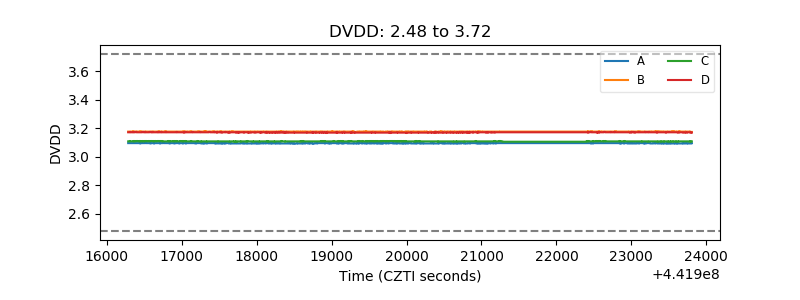 |
| Temperature 1 | 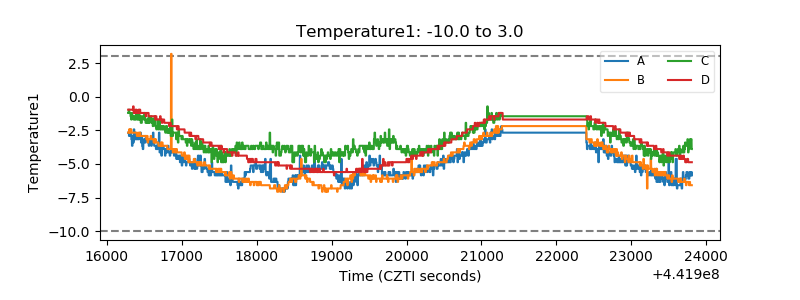 |
| Veto HV Monitor | 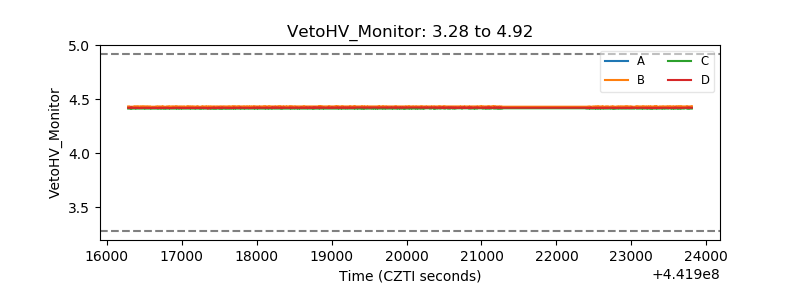 |
| Veto LLD |  |
| Alpha Counter | 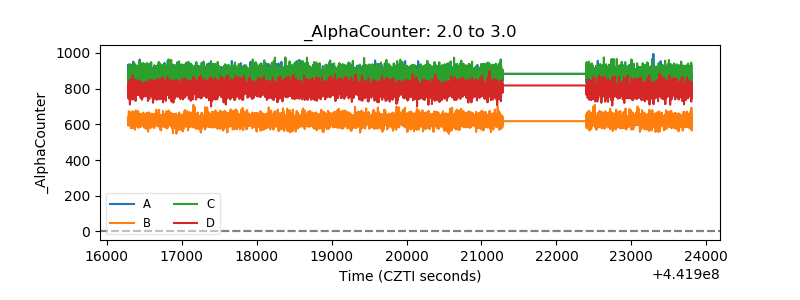 |
| _CPM_Rate | 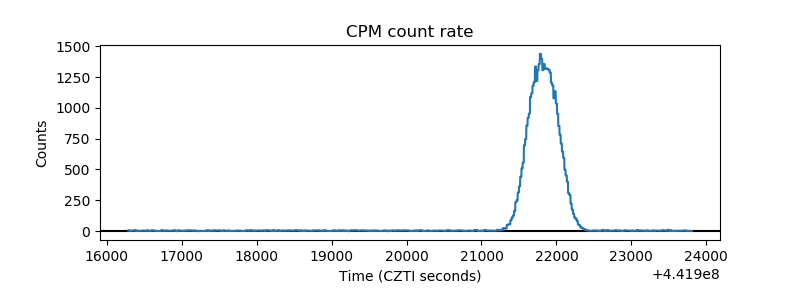 |
| CZT Counter | 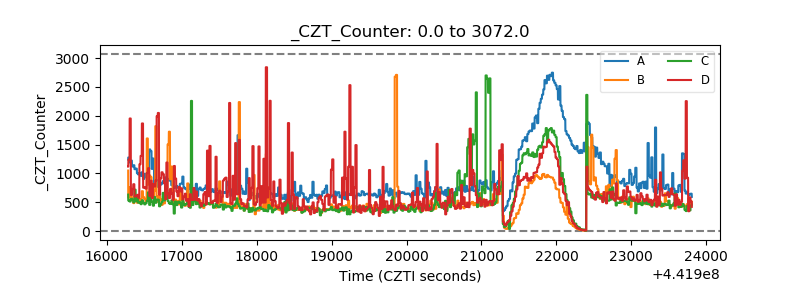 |
| +2.5 Volts monitor | 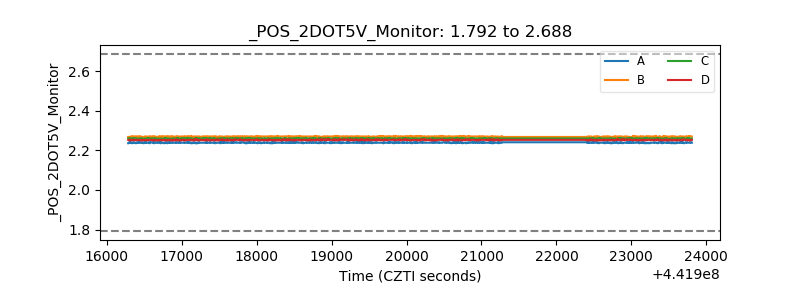 |
| +5 Volts monitor |  |
| _ROLL_ROT | 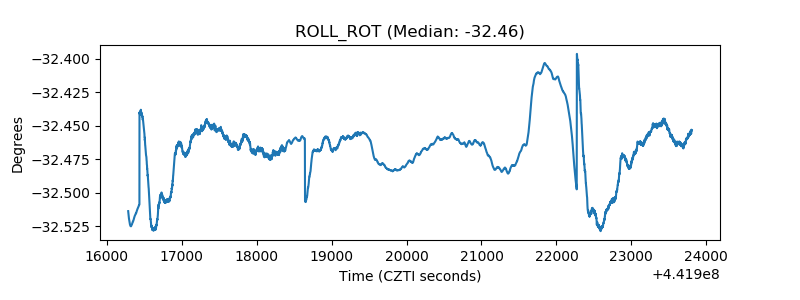 |
| _Roll_DEC | 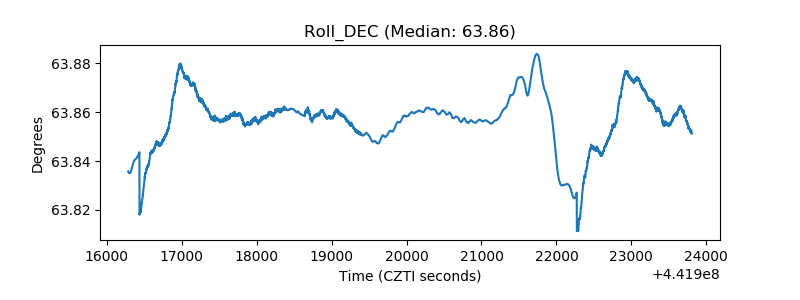 |
| _Roll_RA | 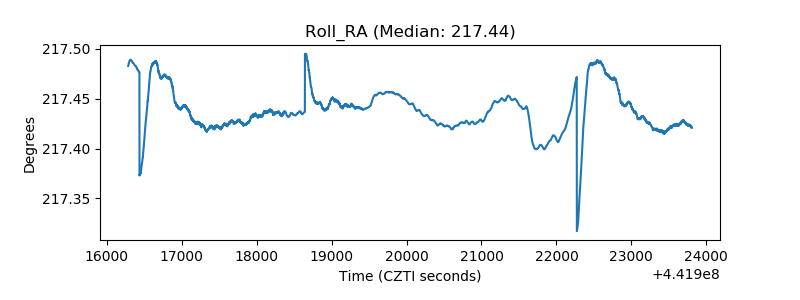 |
| Veto Counter | 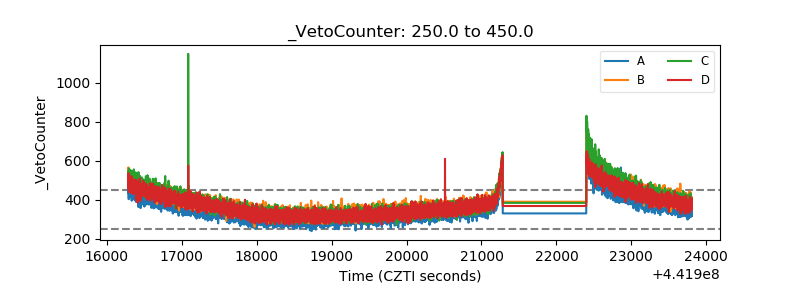 |