| Param | Original file | Final file |
|---|---|---|
| Filename | modeM0/AS1A13_072T01_9000006008_44690cztM0_level2.fits | modeM0/AS1A13_072T01_9000006008_44690cztM0_level2_quad_clean.evt |
| Size (bytes) | 138,522,240 | 33,935,040 |
| Size | 132.1 MB | 32.4 MB |
| Events in quadrant A | 1,723,349 | 225,124 |
| Events in quadrant B | 1,111,519 | 232,019 |
| Events in quadrant C | 939,730 | 226,081 |
| Events in quadrant D | 1,203,249 | 206,279 |
| Mode M0 | |||
|---|---|---|---|
| Quadrant | BADHDUFLAG | Total packets | Discarded packets |
| A | 0 | 6570 | 1 |
| B | 0 | 4547 | 1 |
| C | 0 | 4042 | 1 |
| D | 0 | 4847 | 1 |
| Mode SS | |||
|---|---|---|---|
| Quadrant | BADHDUFLAG | Total packets | Discarded packets |
| A | 0 | 38 | 0 |
| B | 0 | 38 | 0 |
| C | 0 | 38 | 0 |
| D | 0 | 38 | 0 |
| Mode M9 | |||
|---|---|---|---|
| Quadrant | BADHDUFLAG | Total packets | Discarded packets |
| A | 1 | 140129412421672 | 140127602999342 |
| B | 1 | -1 | -1 |
| C | 1 | -1 | -1 |
| D | 1 | -1 | -1 |
| Quadrant | Total seconds | Saturated seconds | Saturation percentage |
|---|---|---|---|
| A | 1896 | 69 | 3.639241% |
| B | 1896 | 64 | 3.375527% |
| C | 1896 | 11 | 0.580169% |
| D | 1896 | 23 | 1.213080% |
Noise dominated data is calculated using 1-second bins in cleaned event files. If a bin has >2000 counts, and if more than 50% of those come from <1% of pixels, then it is considered to be noise-dominated and hence unusable.
| Quadrant | # 1 sec bins | Bins with >0 counts | Bins with >2000 counts | High rate bins dominated by noise | Noise dominated (total time) | Noise dominated (detector-on time) | Marked lightcurve |
|---|---|---|---|---|---|---|---|
| A | 1896 | 1896 | 13 | 13 | 0.69% | 0.69% | 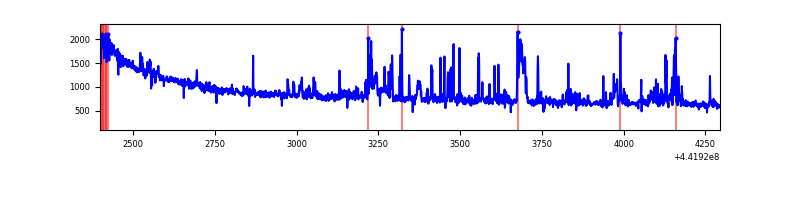 |
| B | 1896 | 1896 | 28 | 28 | 1.48% | 1.48% | 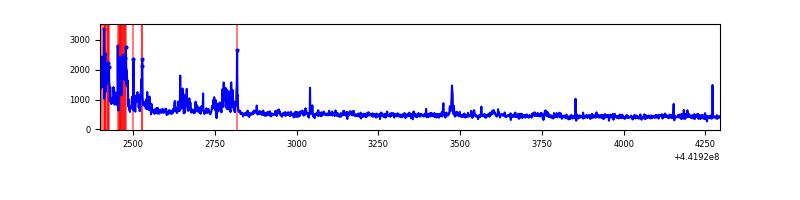 |
| C | 1896 | 1896 | 3 | 3 | 0.16% | 0.16% | 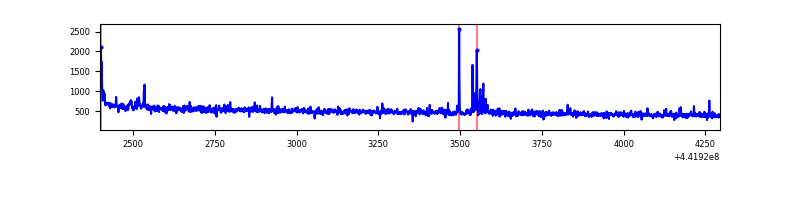 |
| D | 1896 | 1896 | 18 | 18 | 0.95% | 0.95% | 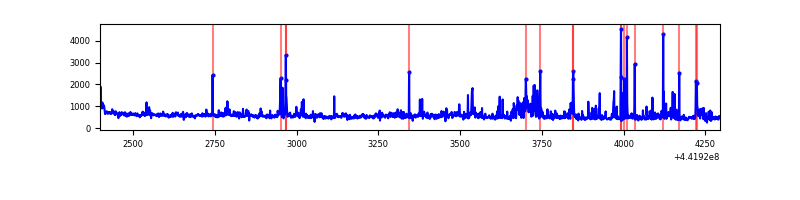 |
Top three noisy pixels from each quadrant. If the there are fewer than three noisy pixels in the level2.evt file, extra rows are filled as -1
| Pixel properties | Quadrant properties | ||||||
|---|---|---|---|---|---|---|---|
| Quadrant | DetID | PixID | Counts | Sigma | Mean | Median | Sigma |
| A | 10 | 83 | 681939 | 14253.39 | 223 | 218 | 47.8 |
| A | 15 | 223 | 113404 | 2366.49 | 223 | 218 | 47.8 |
| A | 13 | 248 | 36495 | 758.48 | 223 | 218 | 47.8 |
| B | 0 | 186 | 160972 | 3534.42 | 225 | 219 | 45.5 |
| B | 0 | 183 | 18204 | 395.43 | 225 | 219 | 45.5 |
| B | 0 | 168 | 9378 | 201.38 | 225 | 219 | 45.5 |
| C | 14 | 254 | 20532 | 369.17 | 228 | 228 | 55.0 |
| C | 3 | 233 | 12963 | 231.55 | 228 | 228 | 55.0 |
| C | 2 | 14 | 6808 | 119.63 | 228 | 228 | 55.0 |
| D | 1 | 52 | 154954 | 2679.6 | 225 | 217 | 57.7 |
| D | 11 | 241 | 64044 | 1105.3 | 225 | 217 | 57.7 |
| D | 13 | 249 | 31193 | 536.41 | 225 | 217 | 57.7 |
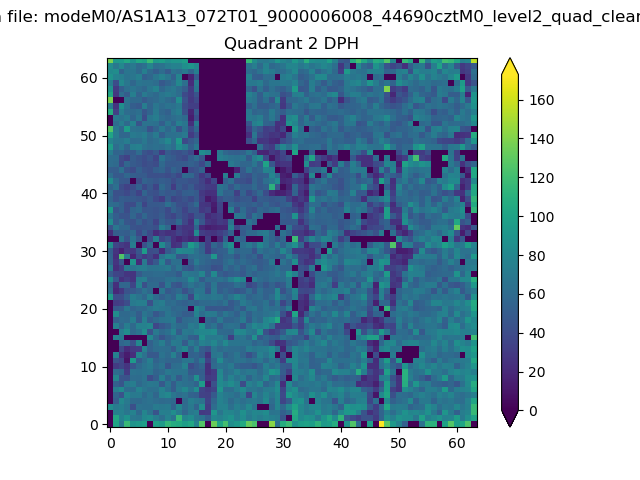
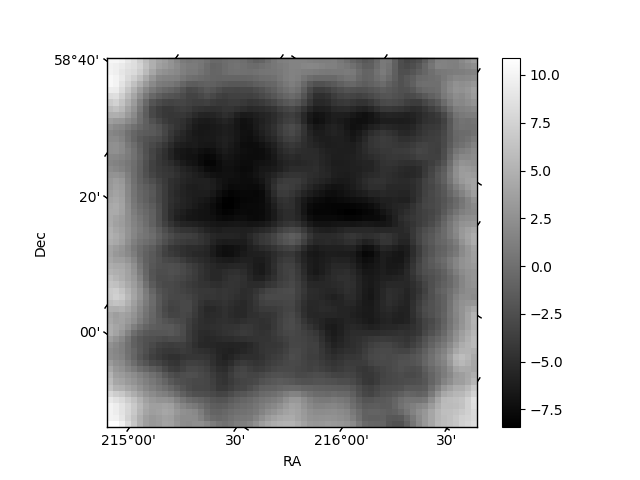
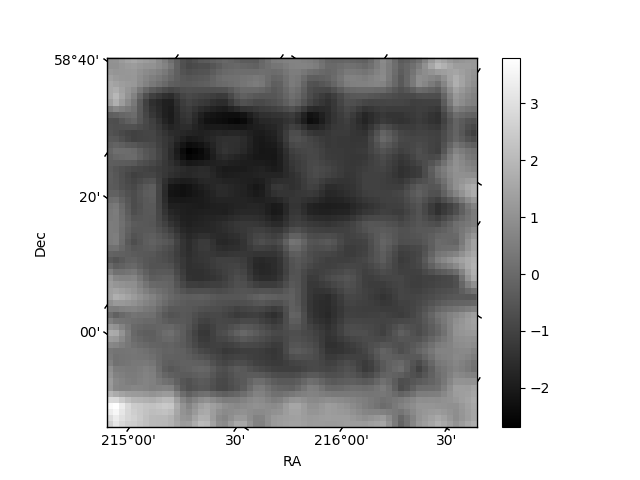
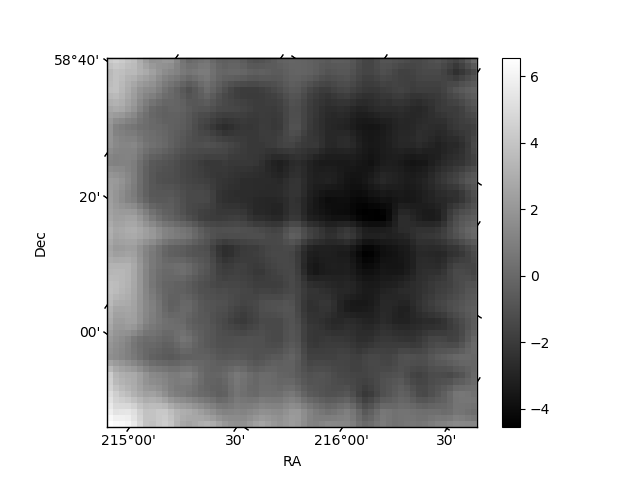
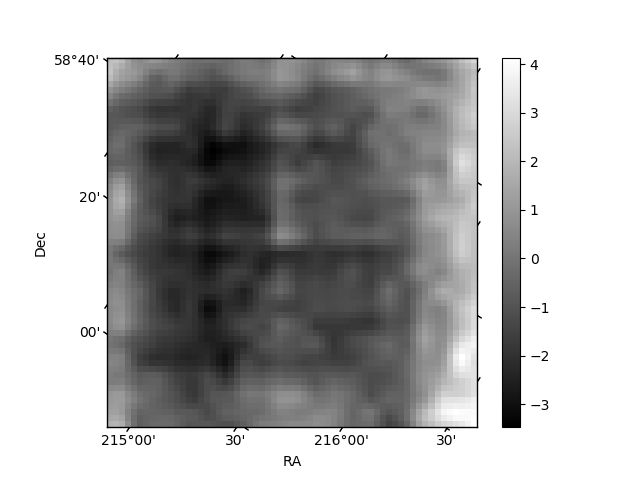
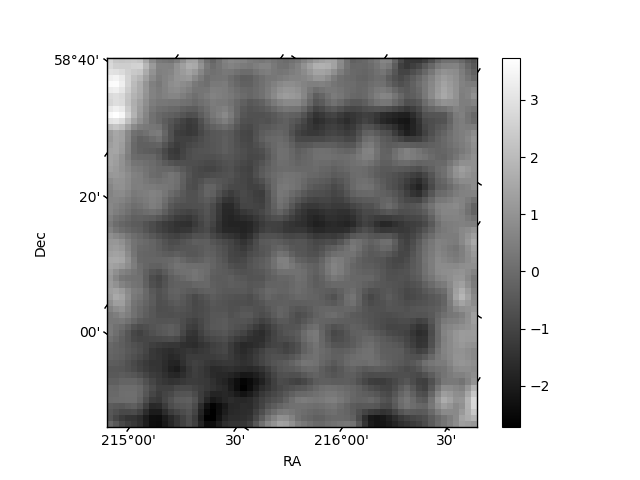
Histogram calculated using DETX and DETY for each event in the final _common_clean file
| Quadrant A | 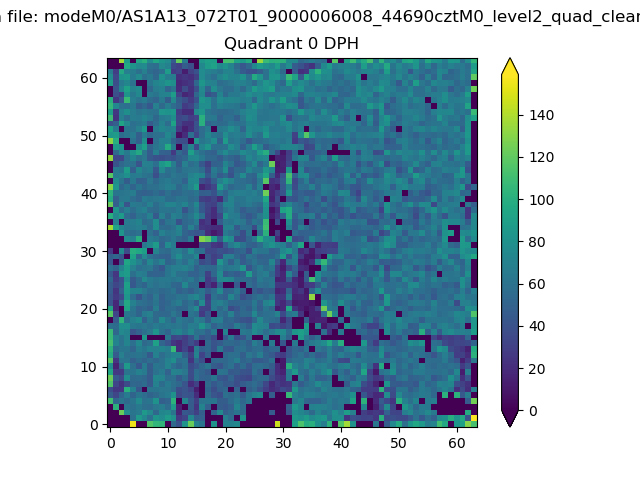 |
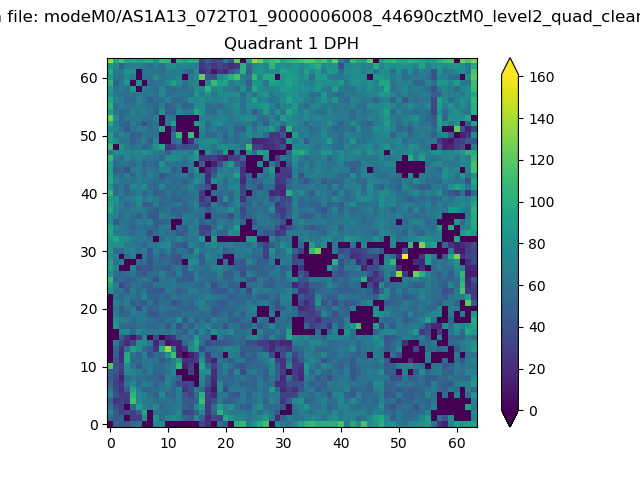 |
Quadrant B |
|---|---|---|---|
| Quadrant D | 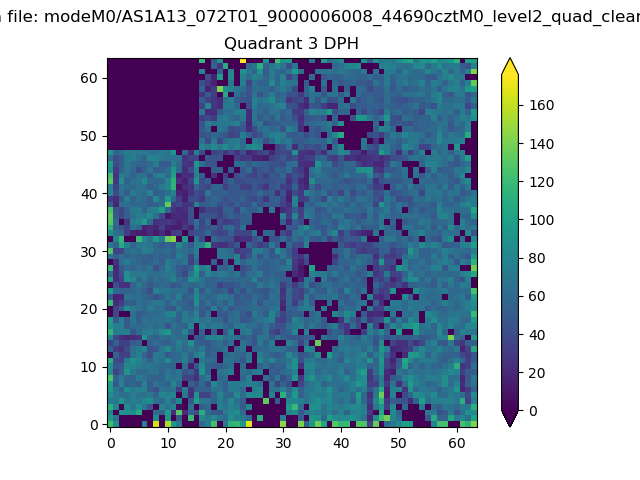 |
 |
Quadrant C |
| Plot type | Count rate plots | Images |
|---|---|---|
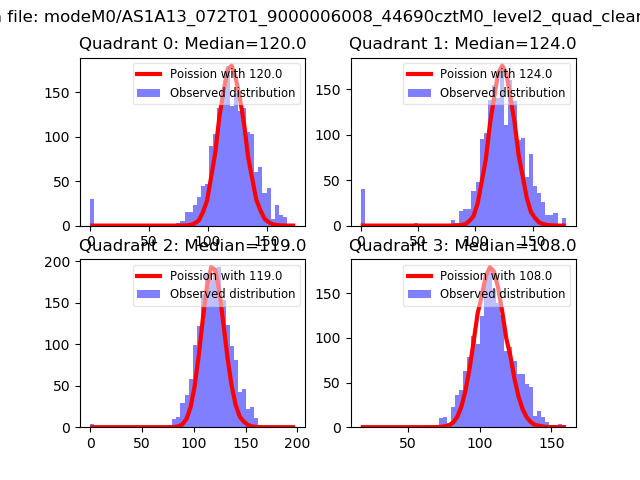
| Comparison with Poisson distribution Blue bars denote a histogram of data divided into 1 sec bins. Red curve is a Poisson curve with rate = median count rate of data. |
 |
 |
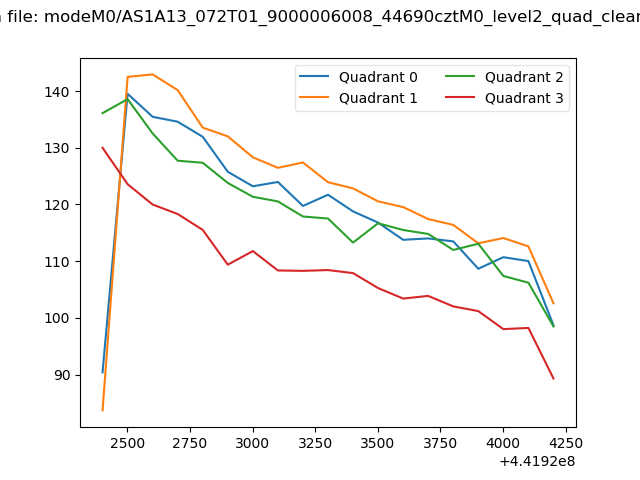
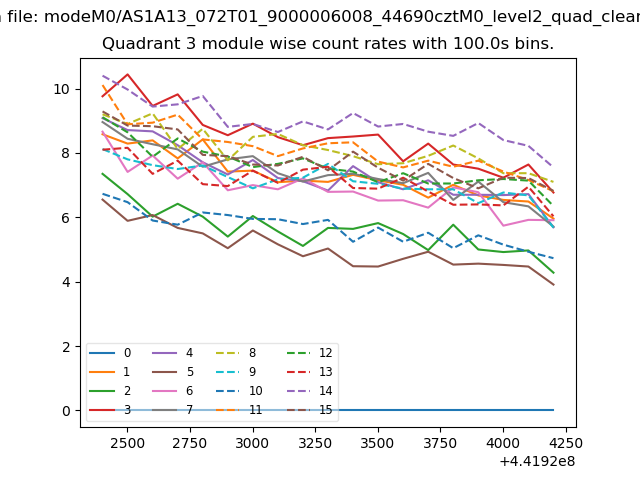
| Quadrant-wise count rates Data is divided into 100 sec bins |
 |
|
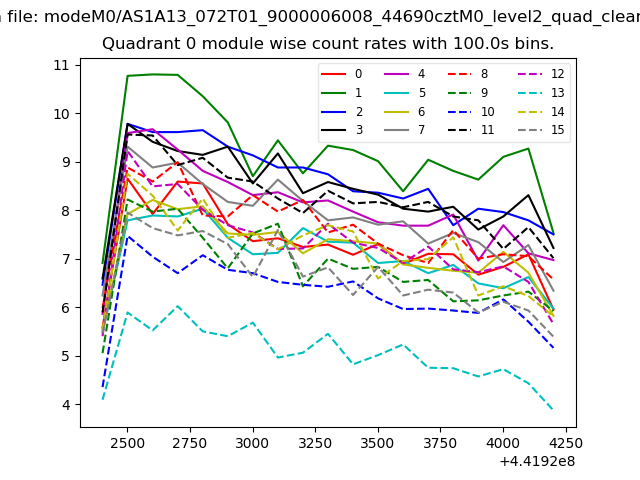
| Module-wise count rates for Quadrant A Data is divided into 100 sec bins |
 |
 |
| Module-wise count rates for Quadrant B Data is divided into 100 sec bins |
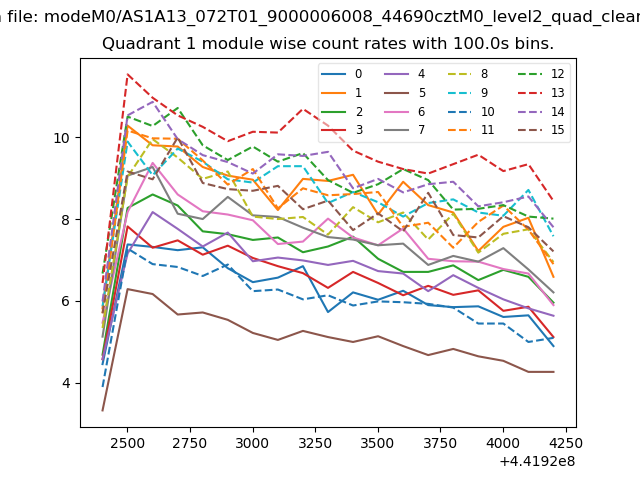 |
 |
| Module-wise count rates for Quadrant C Data is divided into 100 sec bins |
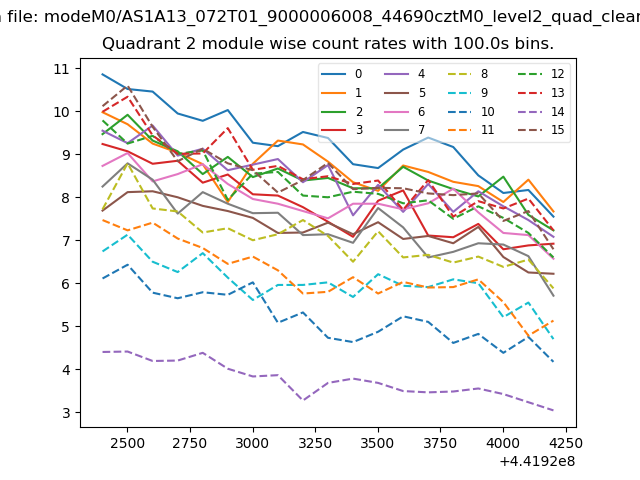 |
 |
| Module-wise count rates for Quadrant D Data is divided into 100 sec bins |
 |
 |
| Parameter | Plot |
|---|---|
| CZT HV Monitor | 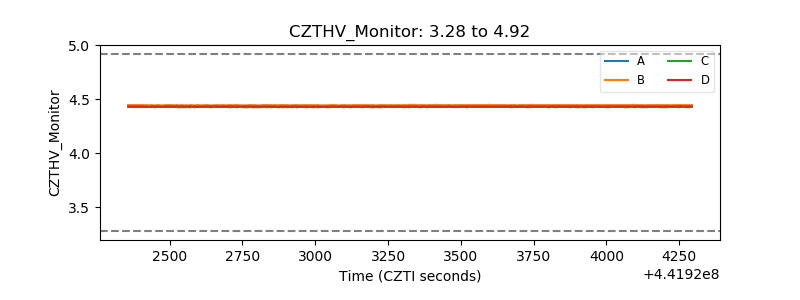 |
| D_VDD | 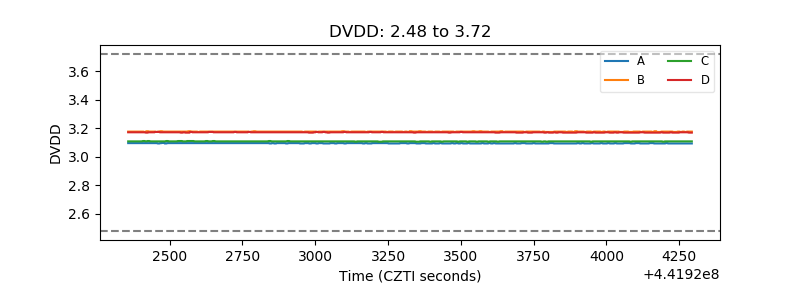 |
| Temperature 1 | 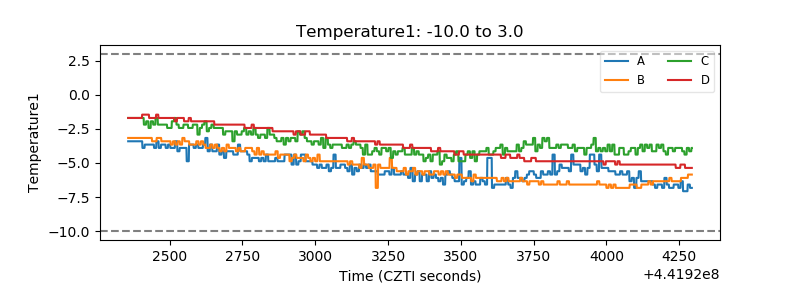 |
| Veto HV Monitor |  |
| Veto LLD | 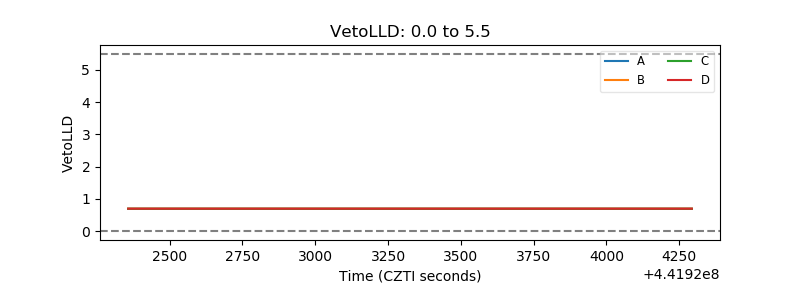 |
| Alpha Counter | 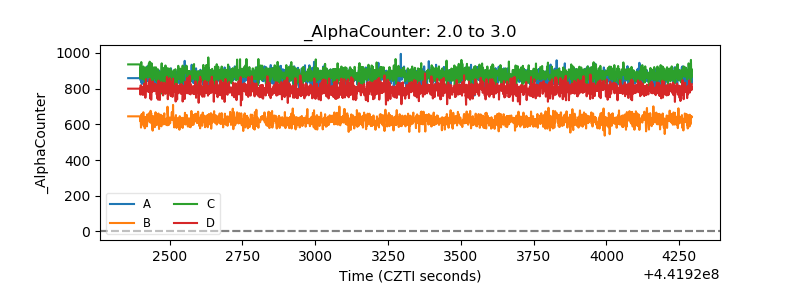 |
| _CPM_Rate |  |
| CZT Counter | 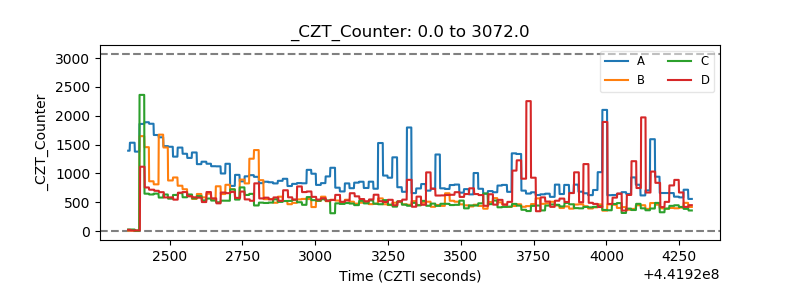 |
| +2.5 Volts monitor | 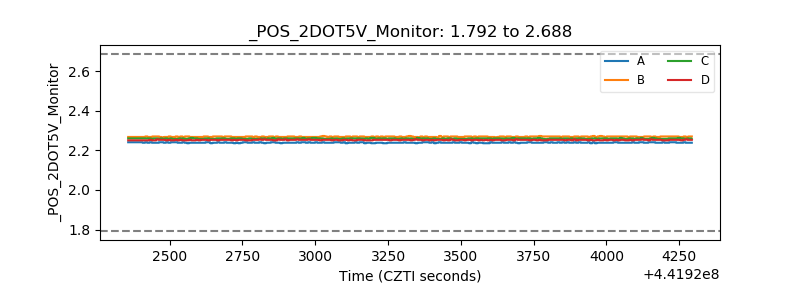 |
| +5 Volts monitor | 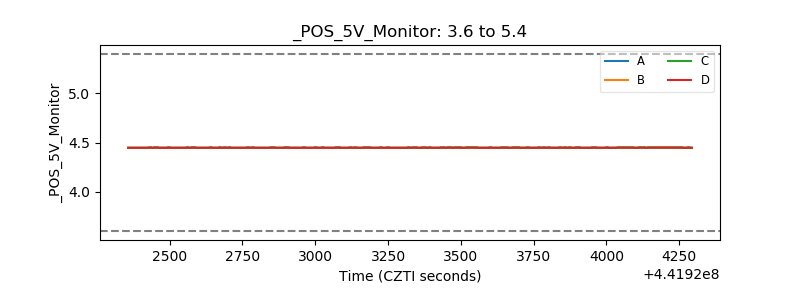 |
| _ROLL_ROT | 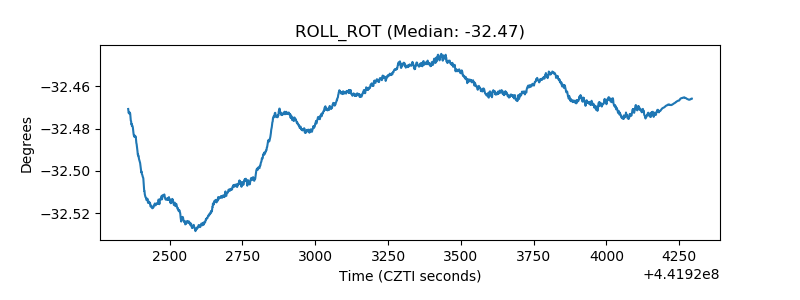 |
| _Roll_DEC | 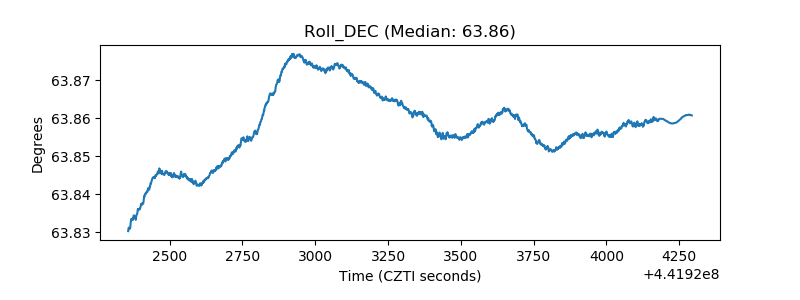 |
| _Roll_RA | 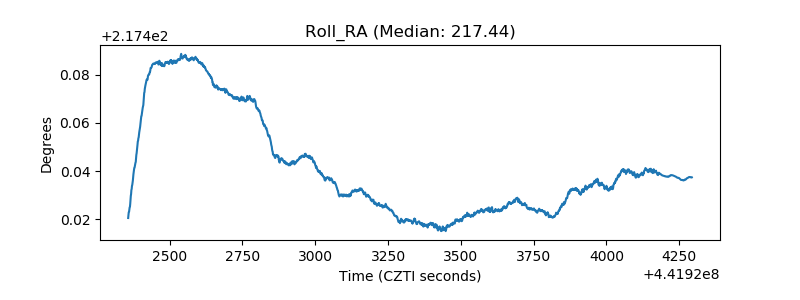 |
| Veto Counter | 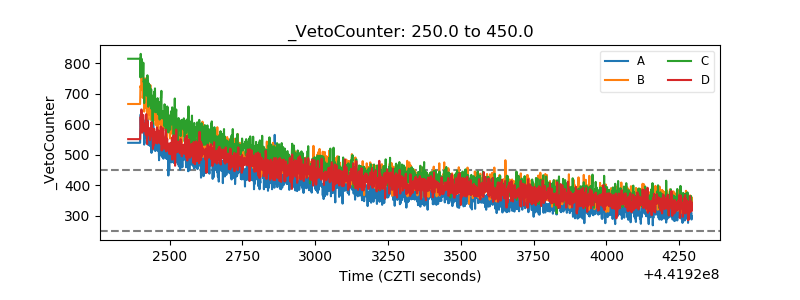 |