| Param | Original file | Final file |
|---|---|---|
| Filename | modeM0/AS1A13_073T04_9000006010_44690cztM0_level2.fits | modeM0/AS1A13_073T04_9000006010_44690cztM0_level2_quad_clean.evt |
| Size (bytes) | 268,456,320 | 62,015,040 |
| Size | 256.0 MB | 59.1 MB |
| Events in quadrant A | 3,675,823 | 400,594 |
| Events in quadrant B | 1,777,643 | 435,009 |
| Events in quadrant C | 1,717,120 | 417,242 |
| Events in quadrant D | 2,484,696 | 368,973 |
| Mode SS | |||
|---|---|---|---|
| Quadrant | BADHDUFLAG | Total packets | Discarded packets |
| A | 0 | 76 | 0 |
| B | 0 | 76 | 0 |
| C | 0 | 76 | 0 |
| D | 0 | 76 | 0 |
| Mode M9 | |||
|---|---|---|---|
| Quadrant | BADHDUFLAG | Total packets | Discarded packets |
| A | 0 | 12 | 0 |
| B | 0 | 12 | 0 |
| C | 0 | 12 | 0 |
| D | 0 | 12 | 0 |
| Mode M0 | |||
|---|---|---|---|
| Quadrant | BADHDUFLAG | Total packets | Discarded packets |
| A | 0 | 13784 | 1 |
| B | 0 | 7646 | 1 |
| C | 0 | 7565 | 1 |
| D | 0 | 9871 | 1 |
| Quadrant | Total seconds | Saturated seconds | Saturation percentage |
|---|---|---|---|
| A | 3614 | 265 | 7.332595% |
| B | 3614 | 31 | 0.857775% |
| C | 3614 | 19 | 0.525733% |
| D | 3614 | 140 | 3.873824% |
Noise dominated data is calculated using 1-second bins in cleaned event files. If a bin has >2000 counts, and if more than 50% of those come from <1% of pixels, then it is considered to be noise-dominated and hence unusable.
| Quadrant | # 1 sec bins | Bins with >0 counts | Bins with >2000 counts | High rate bins dominated by noise | Noise dominated (total time) | Noise dominated (detector-on time) | Marked lightcurve |
|---|---|---|---|---|---|---|---|
| A | 4819 | 3615 | 180 | 180 | 3.74% | 4.98% | 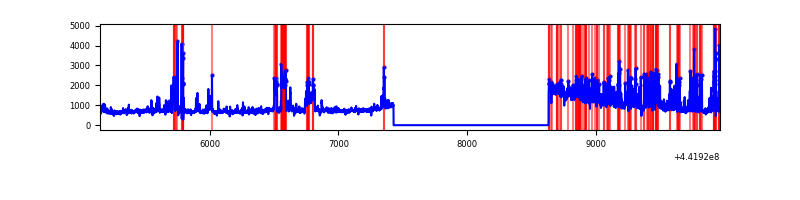 |
| B | 4819 | 3615 | 7 | 7 | 0.15% | 0.19% | 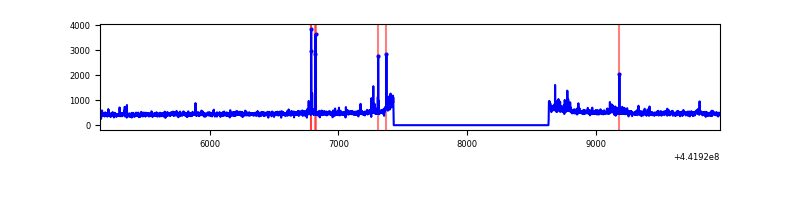 |
| C | 4819 | 3615 | 10 | 10 | 0.21% | 0.28% | 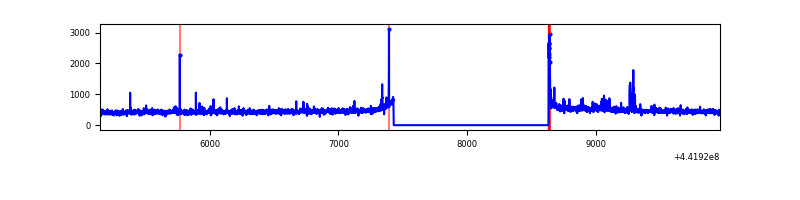 |
| D | 4819 | 3615 | 96 | 96 | 1.99% | 2.66% | 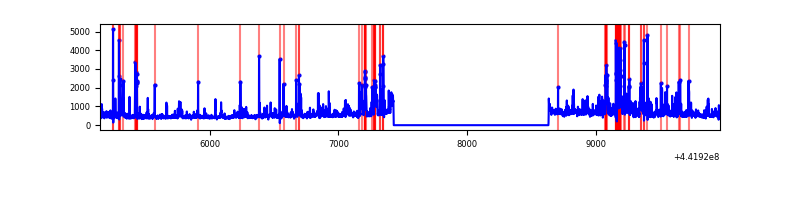 |
Top three noisy pixels from each quadrant. If the there are fewer than three noisy pixels in the level2.evt file, extra rows are filled as -1
| Pixel properties | Quadrant properties | ||||||
|---|---|---|---|---|---|---|---|
| Quadrant | DetID | PixID | Counts | Sigma | Mean | Median | Sigma |
| A | 10 | 83 | 1067366 | 12130.09 | 416 | 407 | 88.0 |
| A | 15 | 223 | 587422 | 6673.68 | 416 | 407 | 88.0 |
| A | 13 | 248 | 220310 | 2500.04 | 416 | 407 | 88.0 |
| B | 0 | 219 | 29295 | 342.27 | 423 | 409 | 84.4 |
| B | 0 | 186 | 21946 | 255.19 | 423 | 409 | 84.4 |
| B | 0 | 168 | 18062 | 209.17 | 423 | 409 | 84.4 |
| C | 2 | 14 | 28413 | 288.31 | 415 | 418 | 97.1 |
| C | 3 | 233 | 25899 | 262.42 | 415 | 418 | 97.1 |
| C | 12 | 2 | 16832 | 169.04 | 415 | 418 | 97.1 |
| D | 1 | 52 | 313192 | 3031.17 | 408 | 396 | 103.2 |
| D | 11 | 241 | 218063 | 2109.32 | 408 | 396 | 103.2 |
| D | 2 | 249 | 101304 | 977.86 | 408 | 396 | 103.2 |
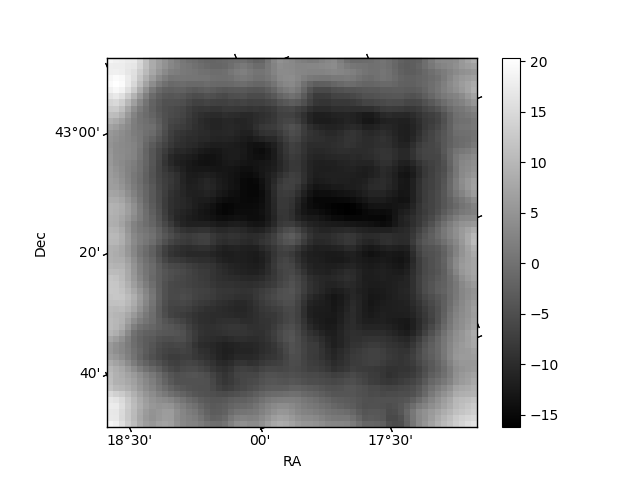
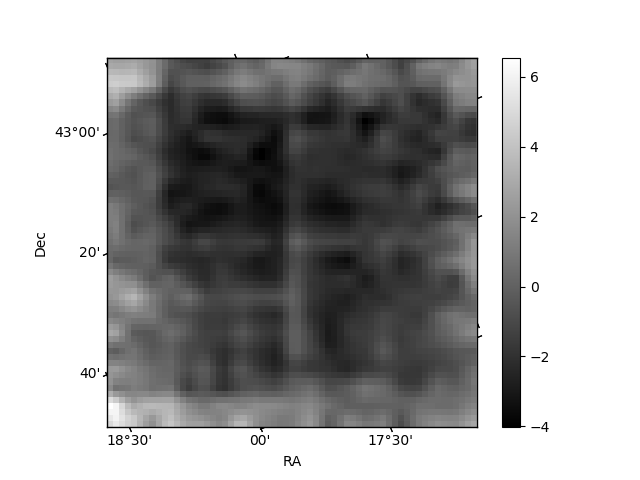
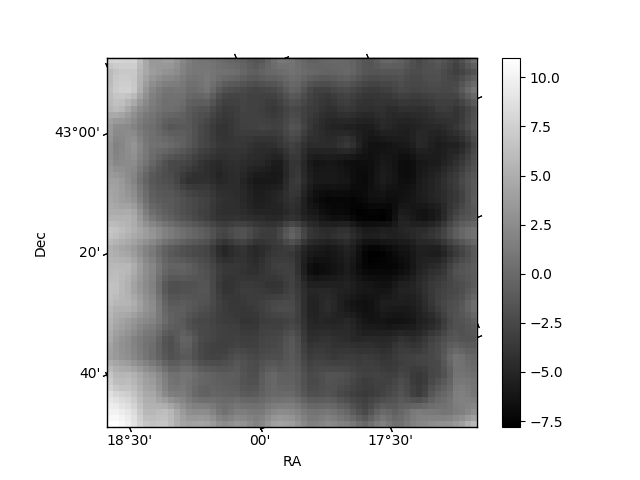
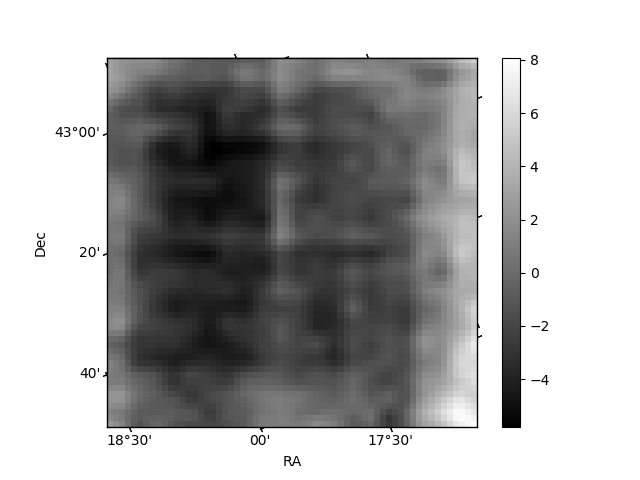
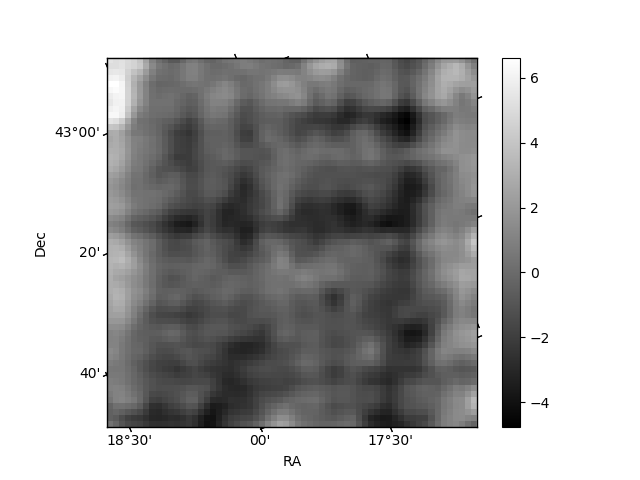
Histogram calculated using DETX and DETY for each event in the final _common_clean file
| Quadrant A | 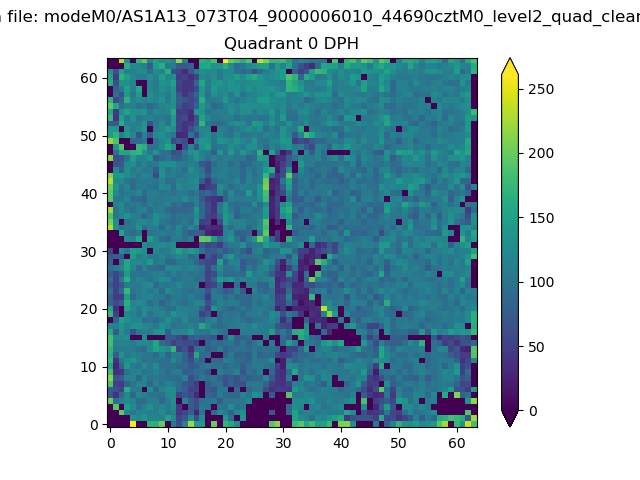 |
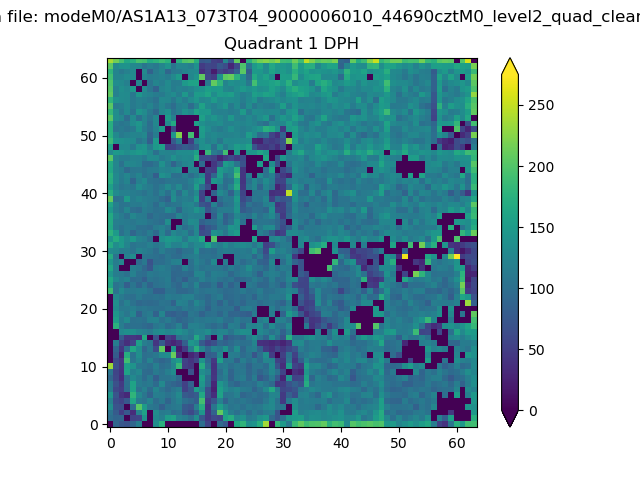 |
Quadrant B |
|---|---|---|---|
| Quadrant D | 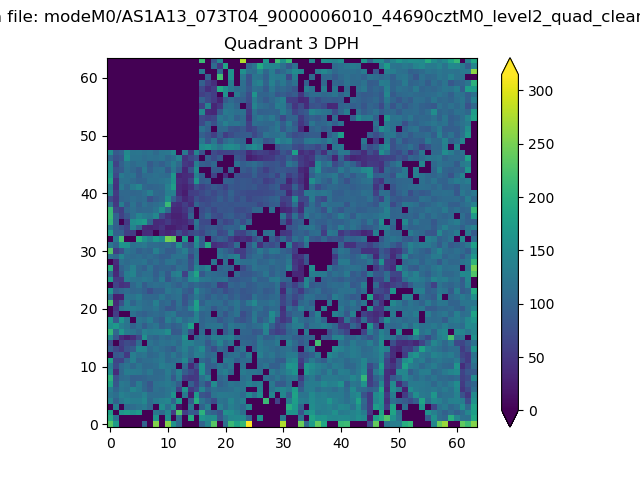 |
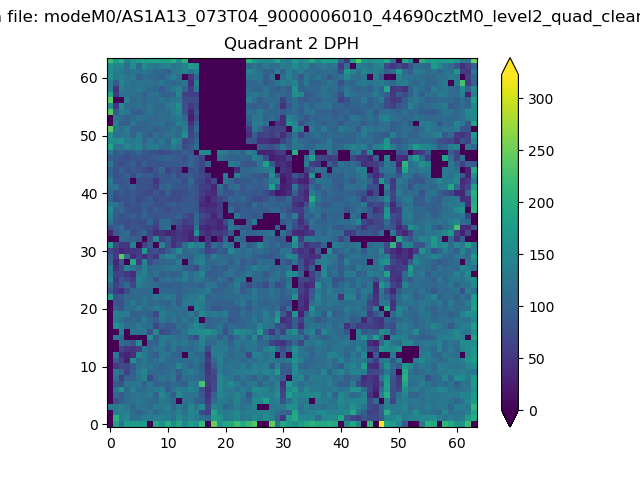 |
Quadrant C |
| Plot type | Count rate plots | Images |
|---|---|---|
| Comparison with Poisson distribution Blue bars denote a histogram of data divided into 1 sec bins. Red curve is a Poisson curve with rate = median count rate of data. |
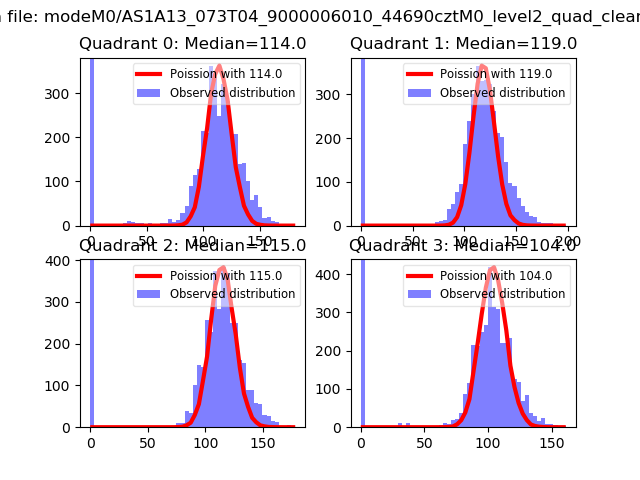 |
 |
| Quadrant-wise count rates Data is divided into 100 sec bins |
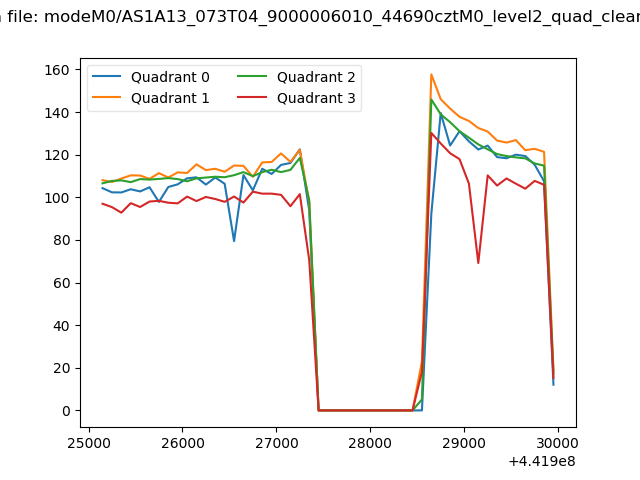 |
|
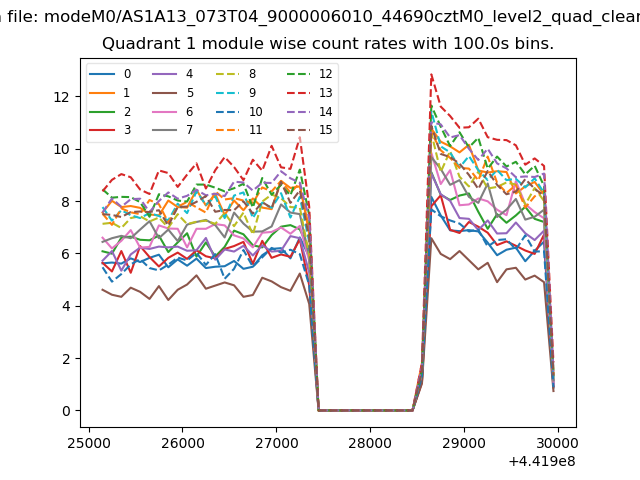
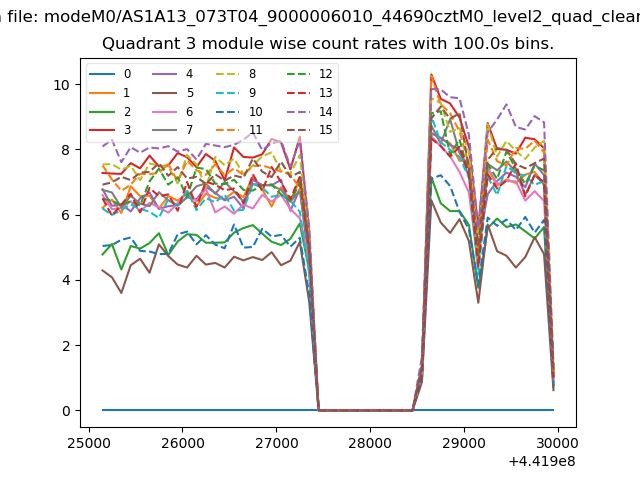
| Module-wise count rates for Quadrant A Data is divided into 100 sec bins |
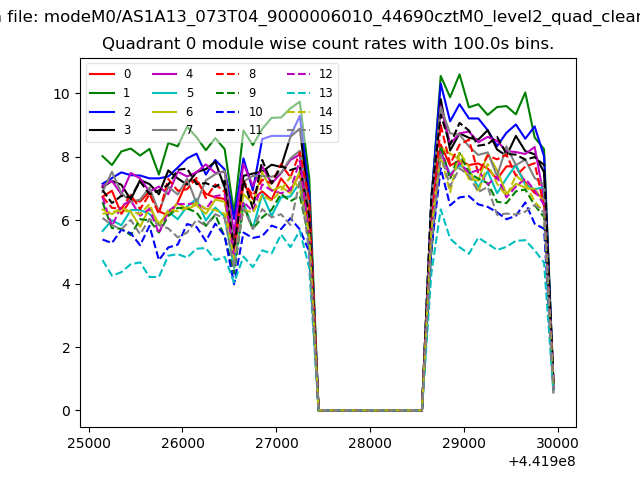 |
 |
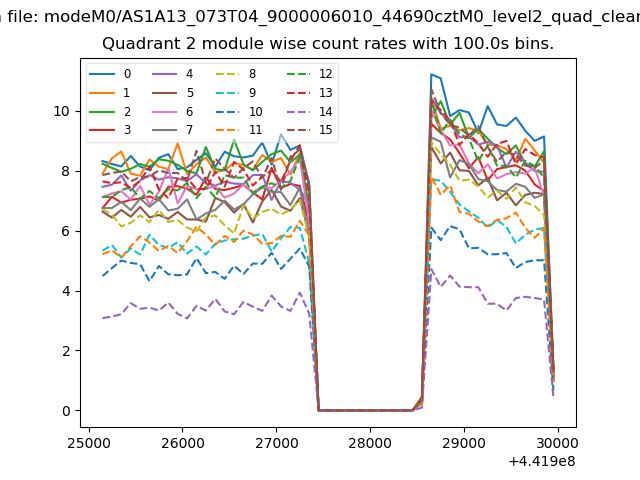
| Module-wise count rates for Quadrant B Data is divided into 100 sec bins |
 |
 |
| Module-wise count rates for Quadrant C Data is divided into 100 sec bins |
 |
 |
| Module-wise count rates for Quadrant D Data is divided into 100 sec bins |
 |
 |
| Parameter | Plot |
|---|---|
| CZT HV Monitor | 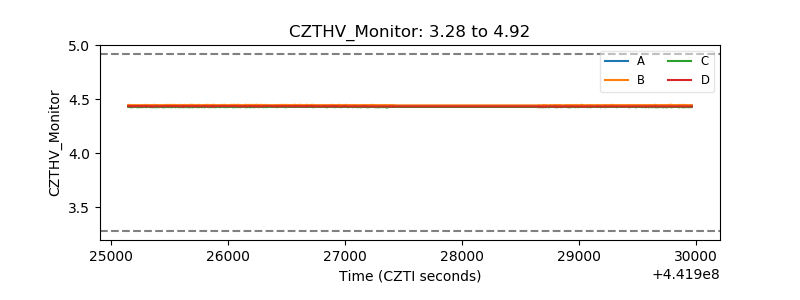 |
| D_VDD | 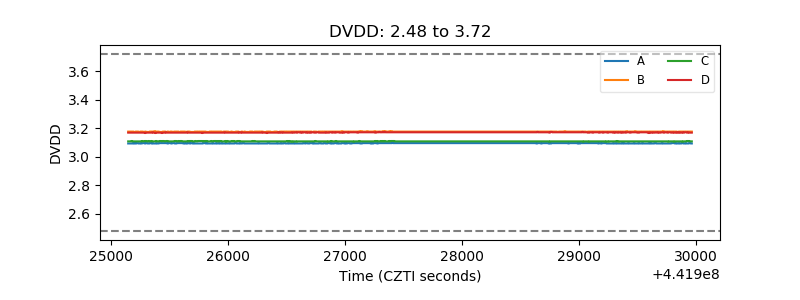 |
| Temperature 1 | 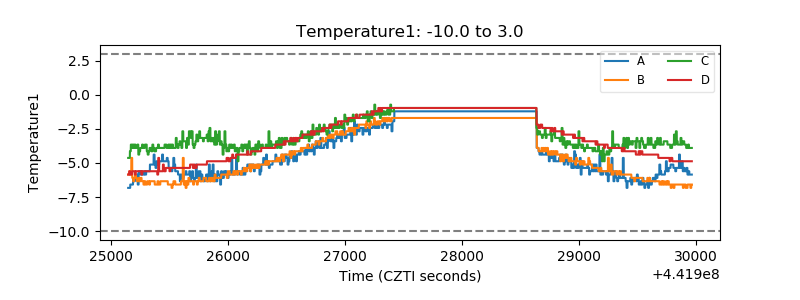 |
| Veto HV Monitor | 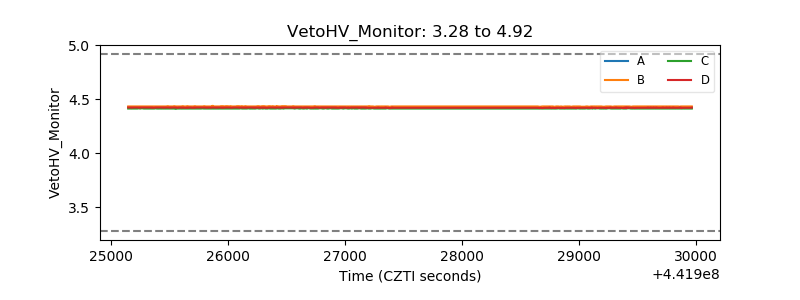 |
| Veto LLD | 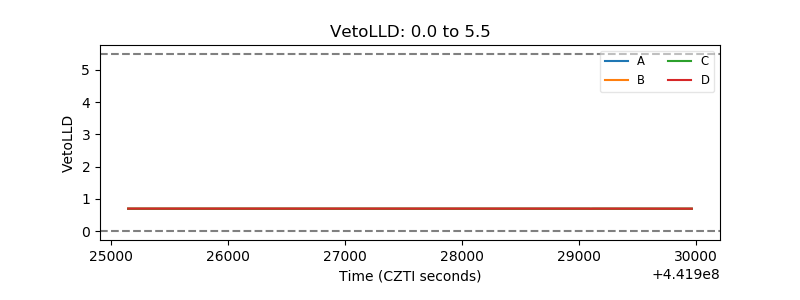 |
| Alpha Counter | 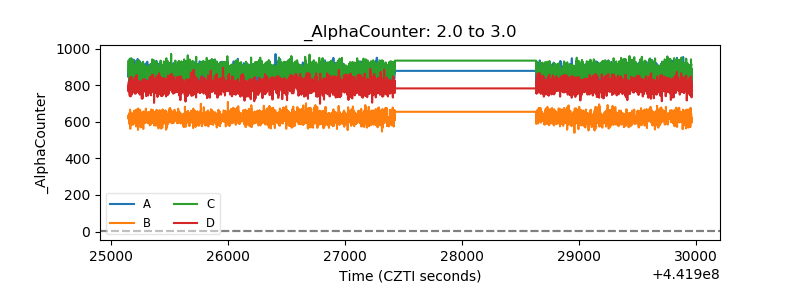 |
| _CPM_Rate | 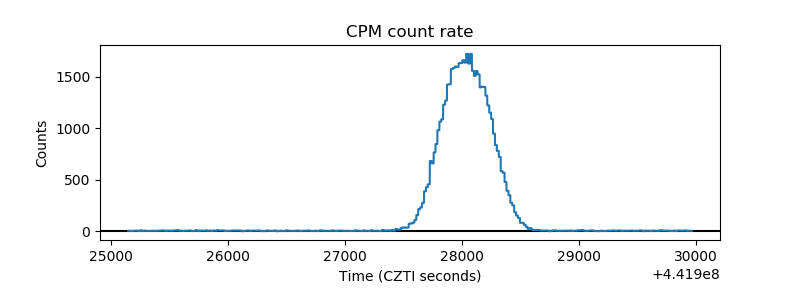 |
| CZT Counter | 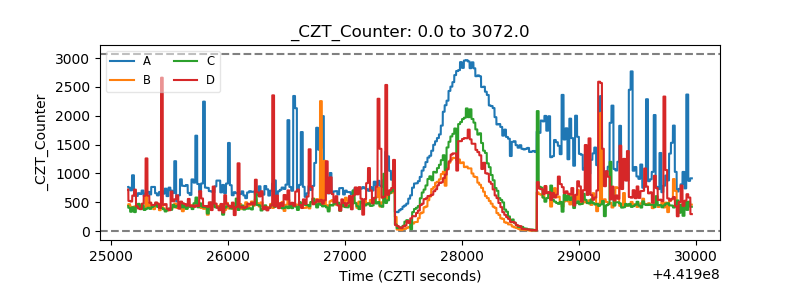 |
| +2.5 Volts monitor | 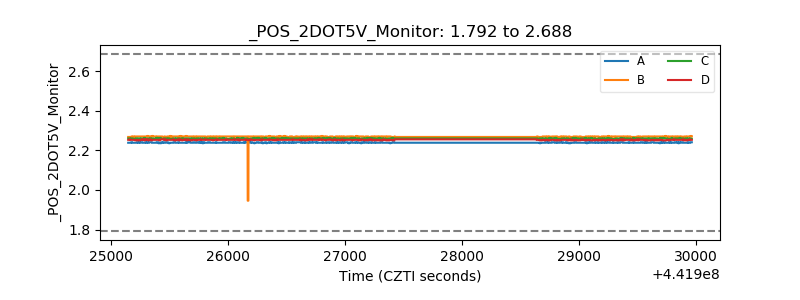 |
| +5 Volts monitor | 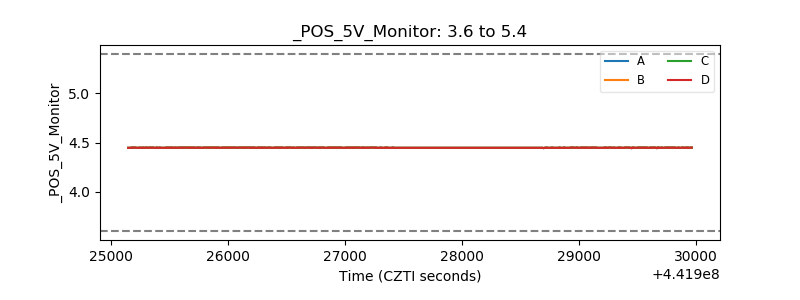 |
| _ROLL_ROT | 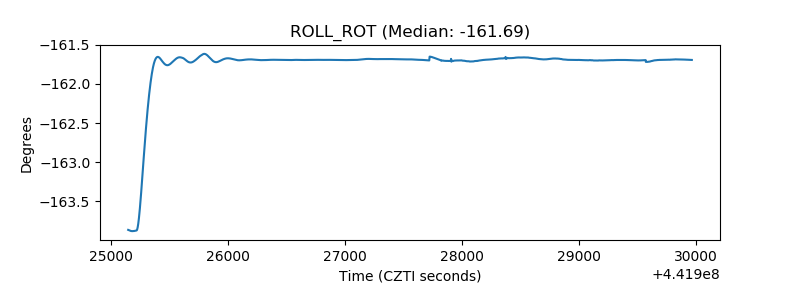 |
| _Roll_DEC | 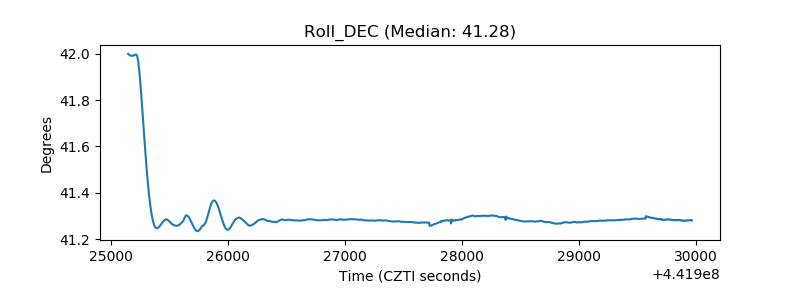 |
| _Roll_RA | 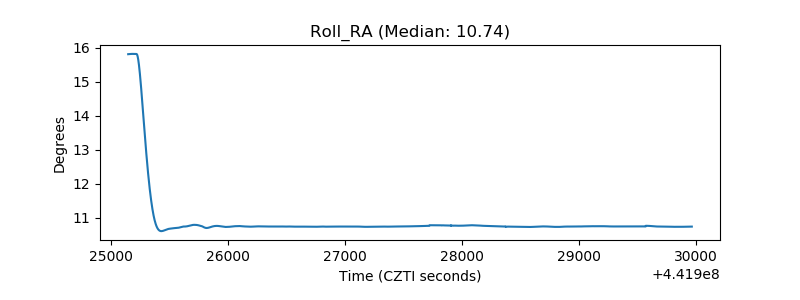 |
| Veto Counter | 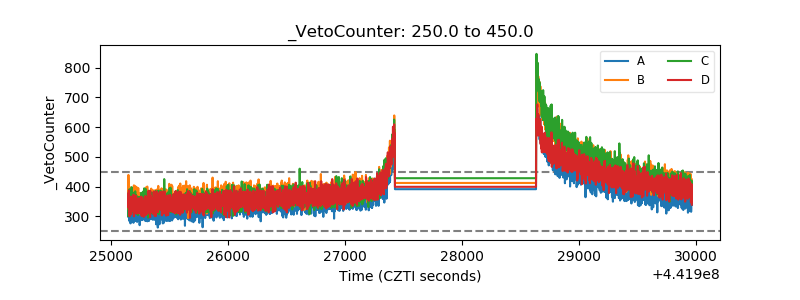 |