| Param | Original file | Final file |
|---|---|---|
| Filename | modeM0/AS1A13_073T04_9000006010_44691cztM0_level2.fits | modeM0/AS1A13_073T04_9000006010_44691cztM0_level2_quad_clean.evt |
| Size (bytes) | 483,246,720 | 106,899,840 |
| Size | 460.9 MB | 101.9 MB |
| Events in quadrant A | 6,456,323 | 686,696 |
| Events in quadrant B | 3,043,831 | 755,825 |
| Events in quadrant C | 2,888,197 | 725,649 |
| Events in quadrant D | 5,017,943 | 635,312 |
| Mode SS | |||
|---|---|---|---|
| Quadrant | BADHDUFLAG | Total packets | Discarded packets |
| A | 0 | 126 | 0 |
| B | 0 | 126 | 0 |
| C | 0 | 126 | 0 |
| D | 0 | 126 | 0 |
| Mode M9 | |||
|---|---|---|---|
| Quadrant | BADHDUFLAG | Total packets | Discarded packets |
| A | 0 | 22 | 0 |
| B | 0 | 23 | 0 |
| C | 0 | 23 | 0 |
| D | 0 | 23 | 0 |
| Mode M0 | |||
|---|---|---|---|
| Quadrant | BADHDUFLAG | Total packets | Discarded packets |
| A | 0 | 23898 | 2 |
| B | 0 | 13140 | 3 |
| C | 0 | 12870 | 2 |
| D | 0 | 19260 | 2 |
| Quadrant | Total seconds | Saturated seconds | Saturation percentage |
|---|---|---|---|
| A | 6212 | 500 | 8.048938% |
| B | 6211 | 32 | 0.515215% |
| C | 6211 | 23 | 0.370311% |
| D | 6211 | 345 | 5.554661% |
Noise dominated data is calculated using 1-second bins in cleaned event files. If a bin has >2000 counts, and if more than 50% of those come from <1% of pixels, then it is considered to be noise-dominated and hence unusable.
| Quadrant | # 1 sec bins | Bins with >0 counts | Bins with >2000 counts | High rate bins dominated by noise | Noise dominated (total time) | Noise dominated (detector-on time) | Marked lightcurve |
|---|---|---|---|---|---|---|---|
| A | 7477 | 6213 | 309 | 309 | 4.13% | 4.97% | 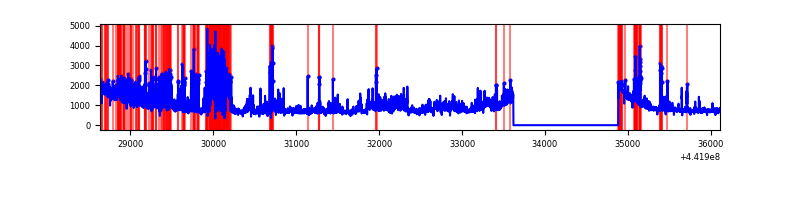 |
| B | 7476 | 6212 | 7 | 7 | 0.09% | 0.11% | 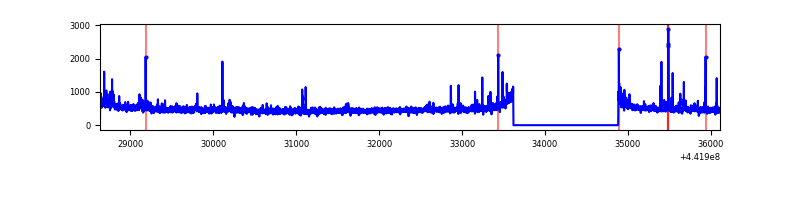 |
| C | 7476 | 6212 | 8 | 8 | 0.11% | 0.13% | 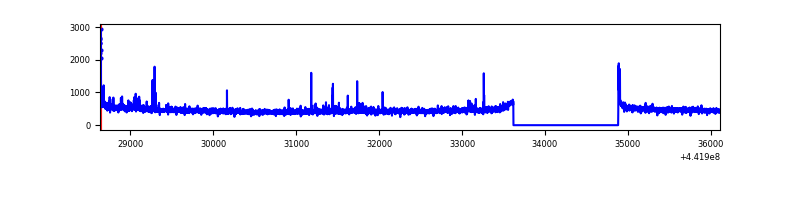 |
| D | 7476 | 6212 | 284 | 284 | 3.80% | 4.57% | 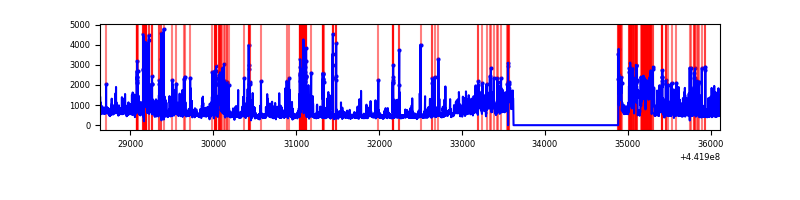 |
Top three noisy pixels from each quadrant. If the there are fewer than three noisy pixels in the level2.evt file, extra rows are filled as -1
| Pixel properties | Quadrant properties | ||||||
|---|---|---|---|---|---|---|---|
| Quadrant | DetID | PixID | Counts | Sigma | Mean | Median | Sigma |
| A | 10 | 83 | 1877803 | 12950.23 | 698 | 683 | 144.9 |
| A | 15 | 223 | 853152 | 5881.17 | 698 | 683 | 144.9 |
| A | 12 | 227 | 502771 | 3463.9 | 698 | 683 | 144.9 |
| B | 0 | 219 | 34157 | 238.04 | 719 | 695 | 140.6 |
| B | 0 | 155 | 33931 | 236.43 | 719 | 695 | 140.6 |
| B | 0 | 190 | 31706 | 220.61 | 719 | 695 | 140.6 |
| C | 3 | 233 | 33996 | 200.23 | 710 | 715 | 166.2 |
| C | 2 | 14 | 30531 | 179.38 | 710 | 715 | 166.2 |
| C | 14 | 254 | 29600 | 173.78 | 710 | 715 | 166.2 |
| D | 11 | 241 | 991623 | 5784.96 | 688 | 669 | 171.3 |
| D | 1 | 52 | 362843 | 2114.29 | 688 | 669 | 171.3 |
| D | 2 | 249 | 337847 | 1968.37 | 688 | 669 | 171.3 |
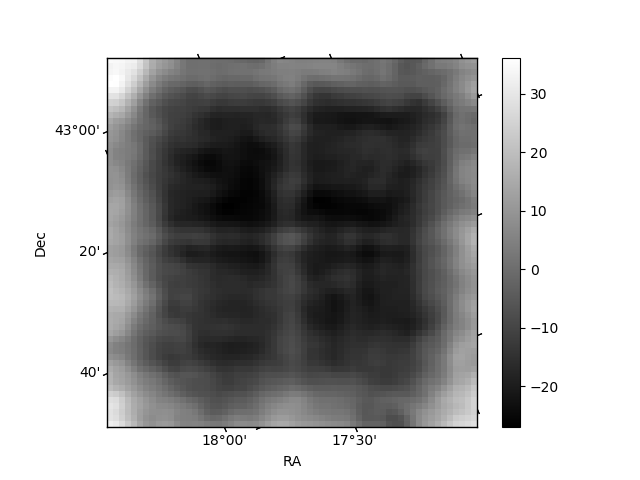
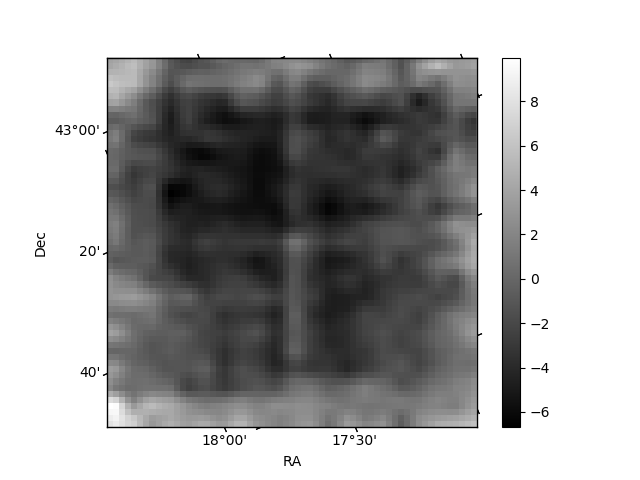
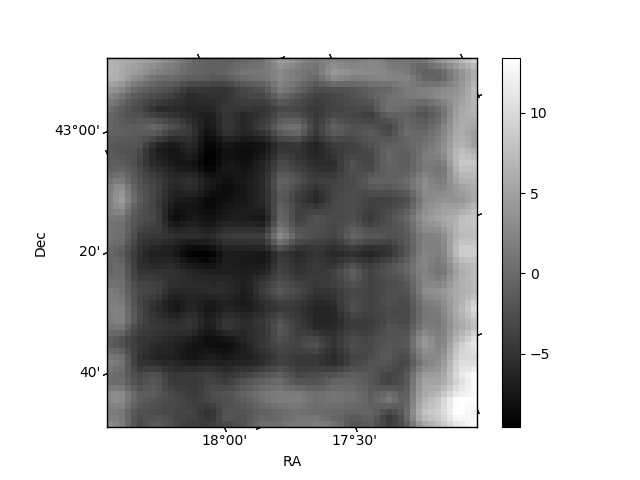
Histogram calculated using DETX and DETY for each event in the final _common_clean file
| Quadrant A | 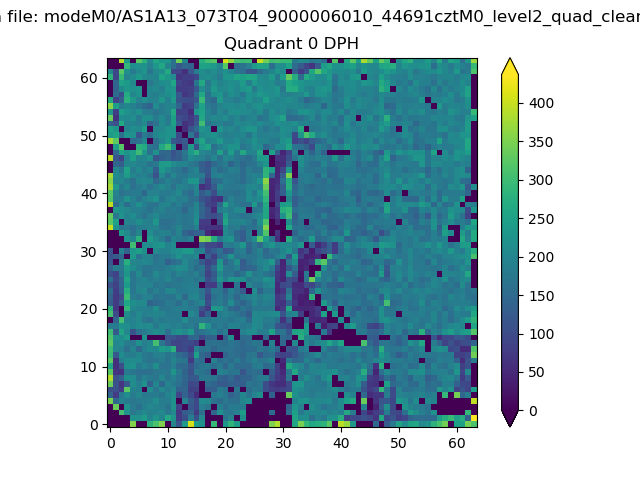 |
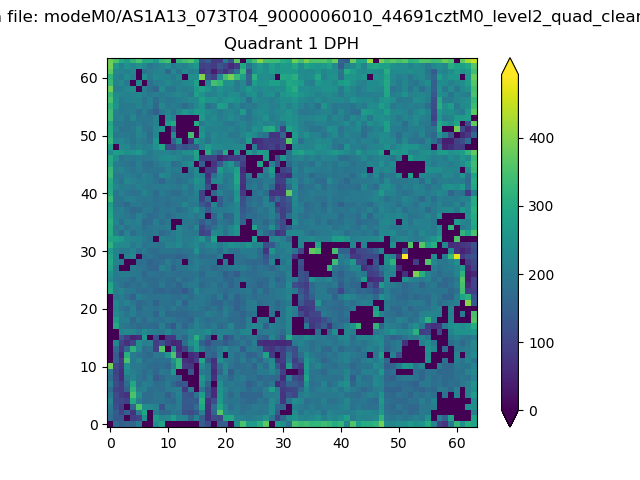 |
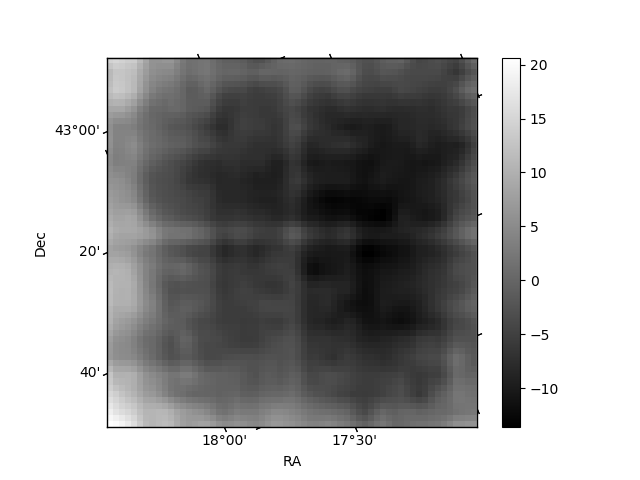
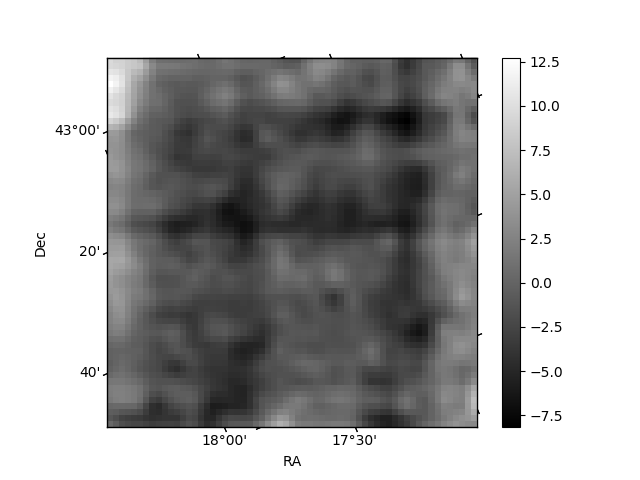
Quadrant B |
|---|---|---|---|
| Quadrant D | 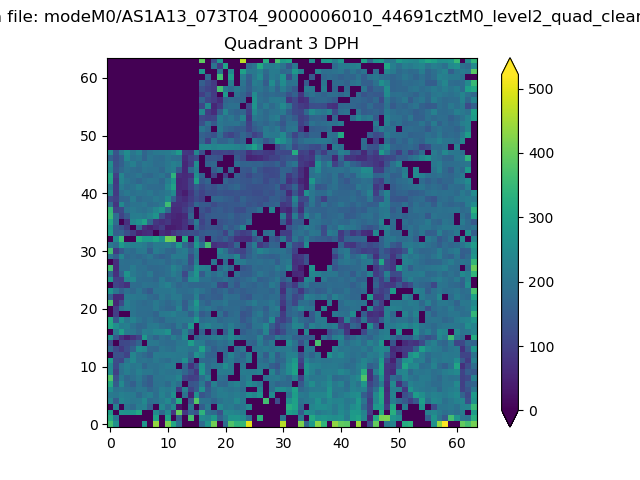 |
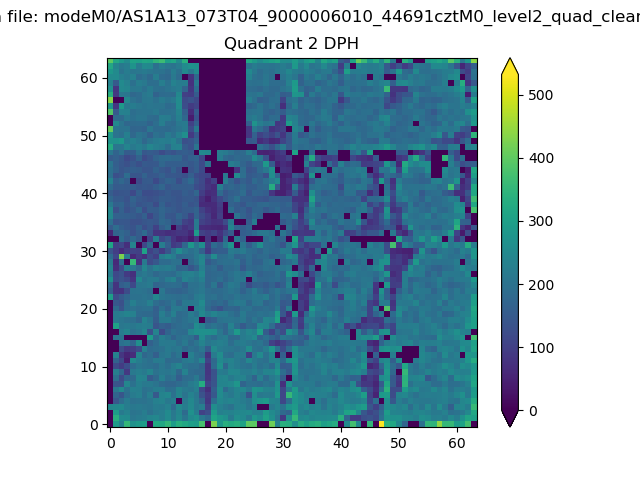 |
Quadrant C |
| Plot type | Count rate plots | Images |
|---|---|---|
| Comparison with Poisson distribution Blue bars denote a histogram of data divided into 1 sec bins. Red curve is a Poisson curve with rate = median count rate of data. |
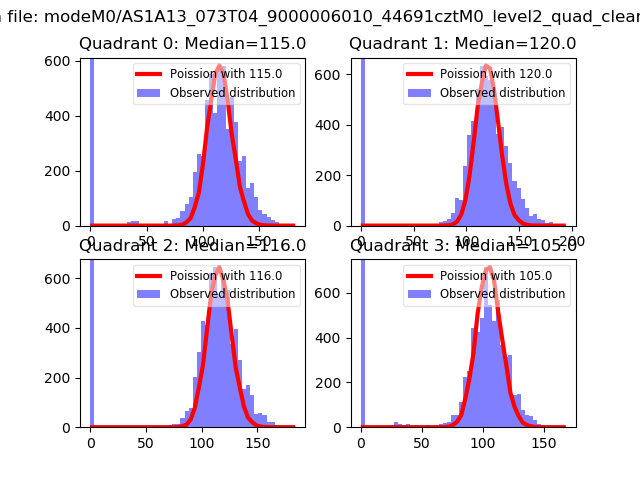 |
 |
| Quadrant-wise count rates Data is divided into 100 sec bins |
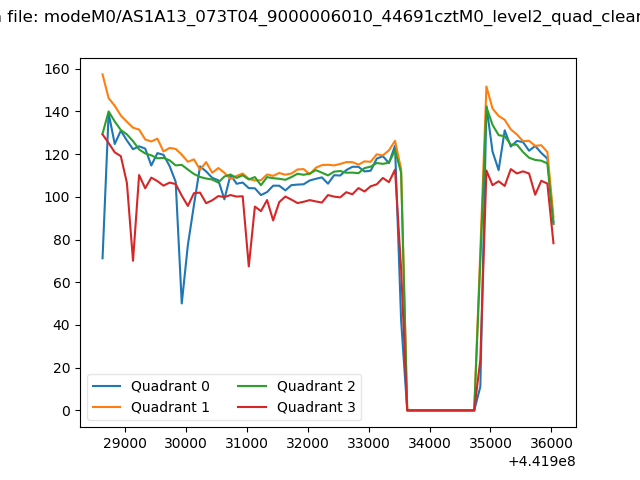 |
|
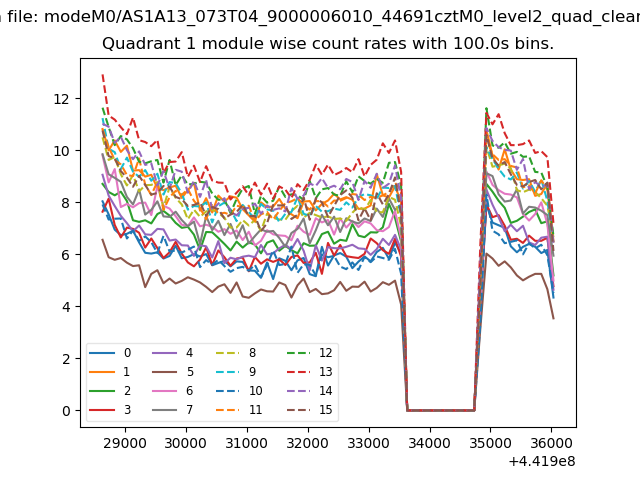
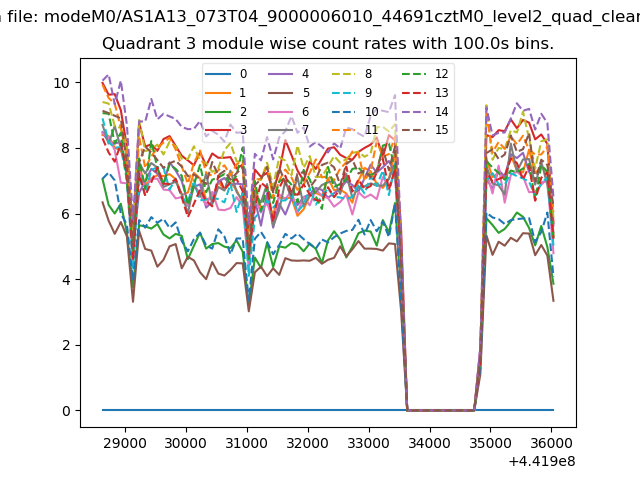
| Module-wise count rates for Quadrant A Data is divided into 100 sec bins |
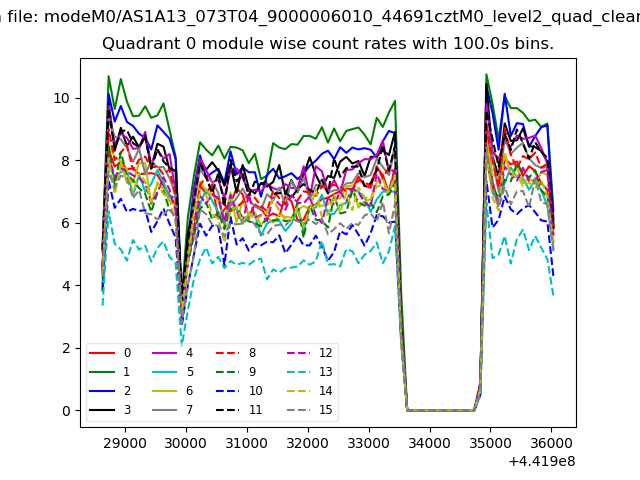 |
 |
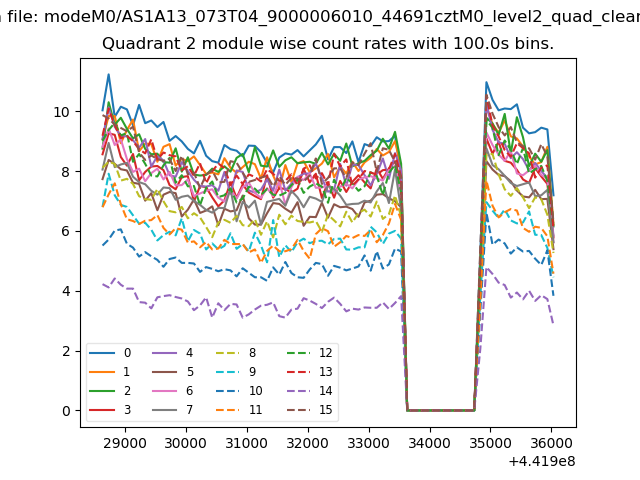
| Module-wise count rates for Quadrant B Data is divided into 100 sec bins |
 |
 |
| Module-wise count rates for Quadrant C Data is divided into 100 sec bins |
 |
 |
| Module-wise count rates for Quadrant D Data is divided into 100 sec bins |
 |
 |
| Parameter | Plot |
|---|---|
| CZT HV Monitor | 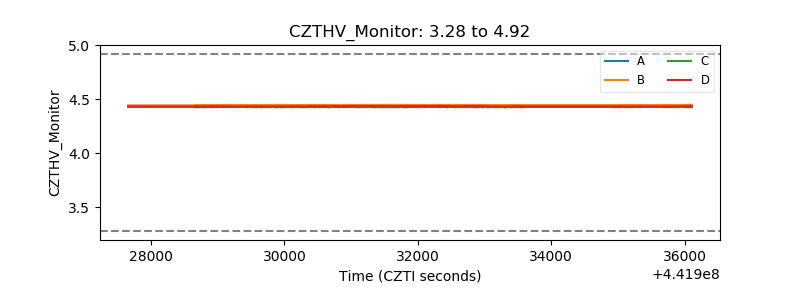 |
| D_VDD | 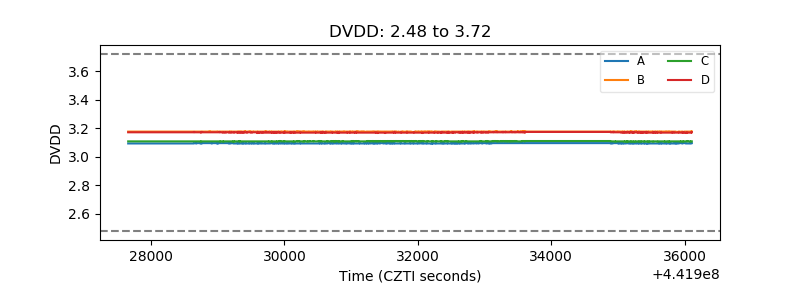 |
| Temperature 1 | 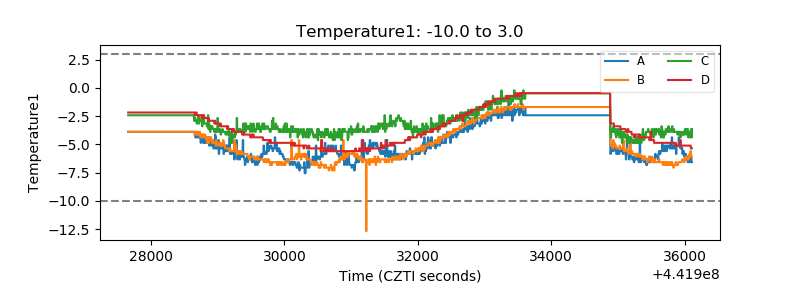 |
| Veto HV Monitor | 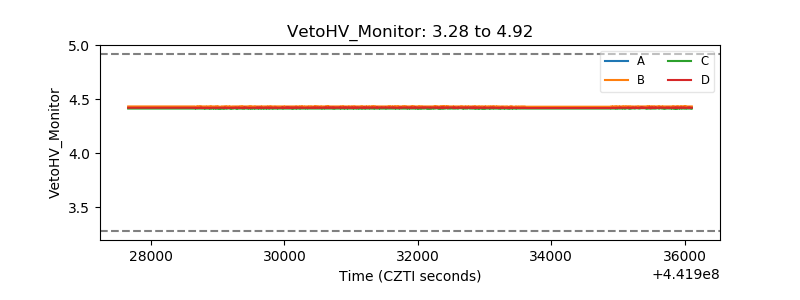 |
| Veto LLD | 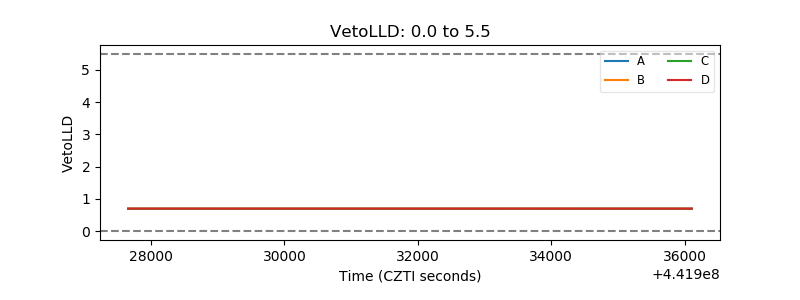 |
| Alpha Counter |  |
| _CPM_Rate | 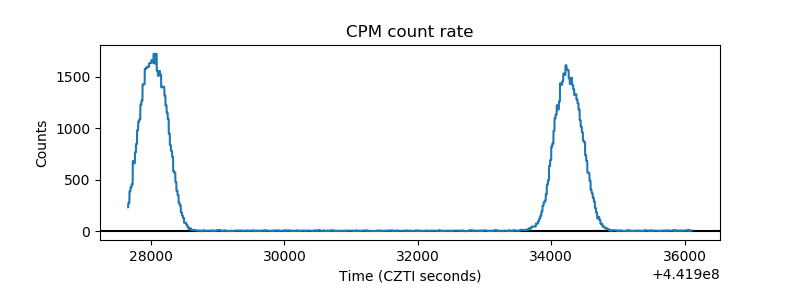 |
| CZT Counter | 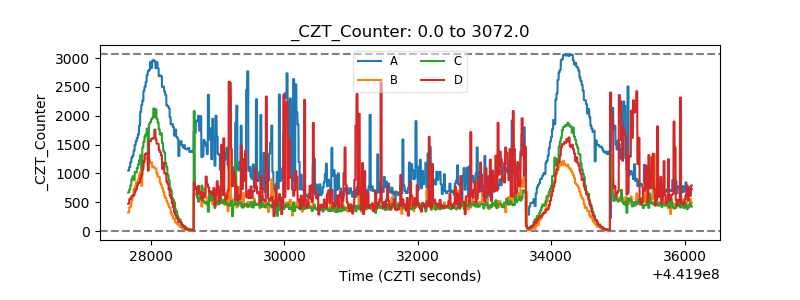 |
| +2.5 Volts monitor | 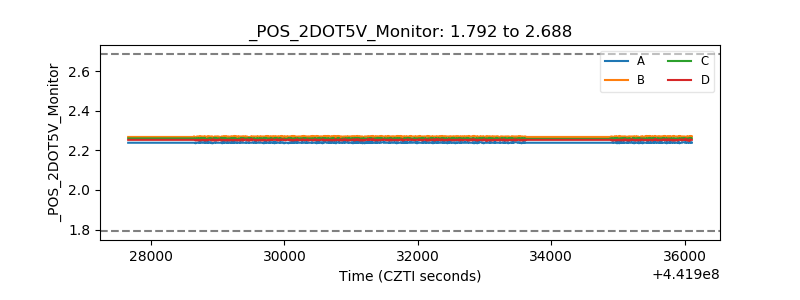 |
| +5 Volts monitor | 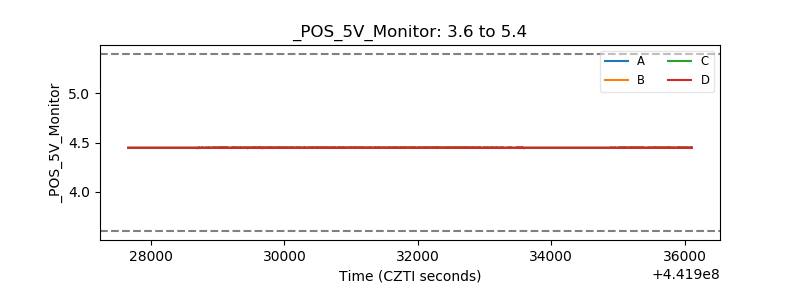 |
| _ROLL_ROT | 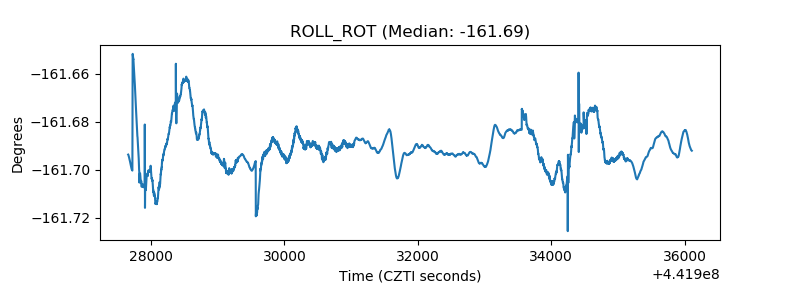 |
| _Roll_DEC | 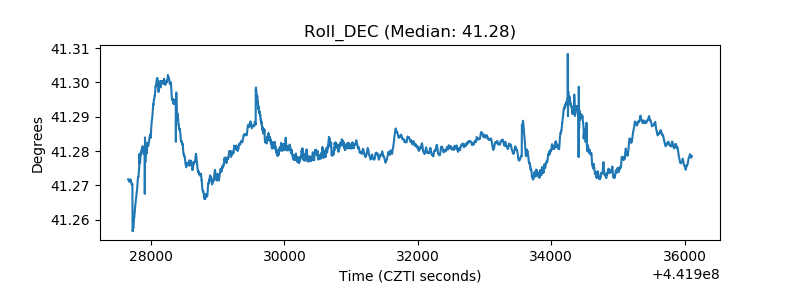 |
| _Roll_RA | 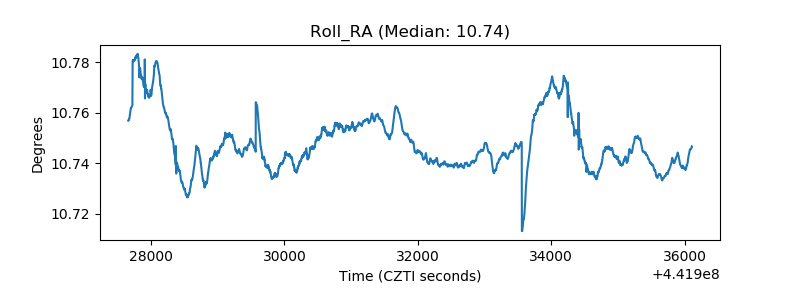 |
| Veto Counter | 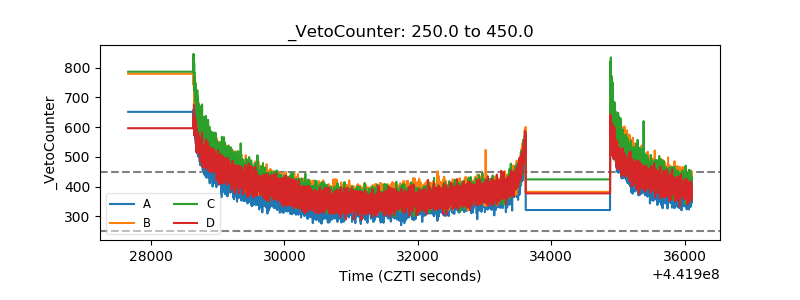 |