| Param | Original file | Final file |
|---|---|---|
| Filename | modeM0/AS1A13_073T04_9000006010_44692cztM0_level2.fits | modeM0/AS1A13_073T04_9000006010_44692cztM0_level2_quad_clean.evt |
| Size (bytes) | 508,884,480 | 113,947,200 |
| Size | 485.3 MB | 108.7 MB |
| Events in quadrant A | 5,933,377 | 748,310 |
| Events in quadrant B | 3,585,906 | 794,025 |
| Events in quadrant C | 3,063,399 | 768,549 |
| Events in quadrant D | 5,737,857 | 674,966 |
| Mode SS | |||
|---|---|---|---|
| Quadrant | BADHDUFLAG | Total packets | Discarded packets |
| A | 0 | 136 | 0 |
| B | 0 | 136 | 0 |
| C | 0 | 136 | 0 |
| D | 0 | 136 | 0 |
| Mode M9 | |||
|---|---|---|---|
| Quadrant | BADHDUFLAG | Total packets | Discarded packets |
| A | 0 | 20 | 0 |
| B | 0 | 21 | 0 |
| C | 0 | 21 | 0 |
| D | 0 | 21 | 0 |
| Mode M0 | |||
|---|---|---|---|
| Quadrant | BADHDUFLAG | Total packets | Discarded packets |
| A | 0 | 23030 | 2 |
| B | 0 | 15086 | 2 |
| C | 0 | 13786 | 2 |
| D | 0 | 21677 | 2 |
| Quadrant | Total seconds | Saturated seconds | Saturation percentage |
|---|---|---|---|
| A | 6663 | 312 | 4.682575% |
| B | 6662 | 117 | 1.756229% |
| C | 6662 | 42 | 0.630441% |
| D | 6662 | 407 | 6.109276% |
Noise dominated data is calculated using 1-second bins in cleaned event files. If a bin has >2000 counts, and if more than 50% of those come from <1% of pixels, then it is considered to be noise-dominated and hence unusable.
| Quadrant | # 1 sec bins | Bins with >0 counts | Bins with >2000 counts | High rate bins dominated by noise | Noise dominated (total time) | Noise dominated (detector-on time) | Marked lightcurve |
|---|---|---|---|---|---|---|---|
| A | 7883 | 6664 | 192 | 192 | 2.44% | 2.88% | 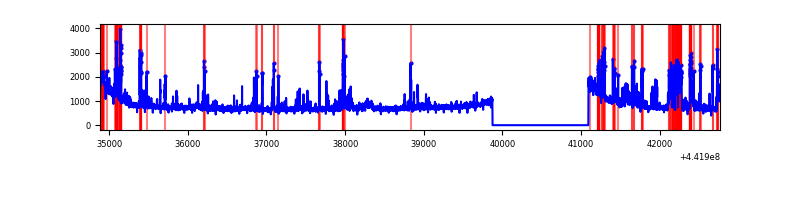 |
| B | 7882 | 6663 | 30 | 30 | 0.38% | 0.45% | 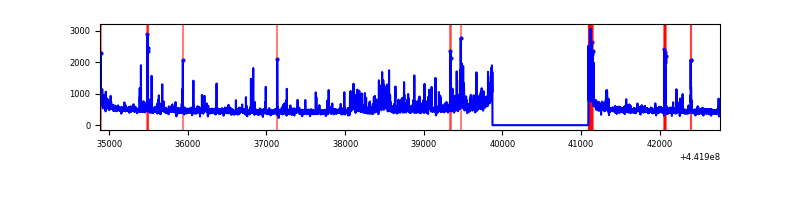 |
| C | 7882 | 6663 | 5 | 5 | 0.06% | 0.08% | 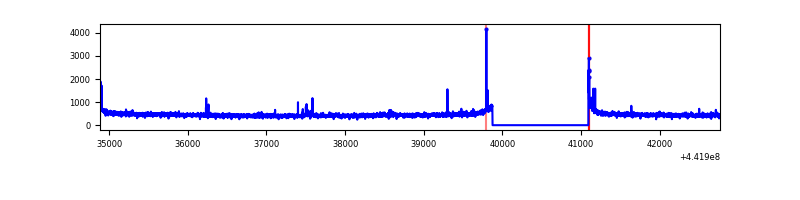 |
| D | 7882 | 6663 | 459 | 459 | 5.82% | 6.89% | 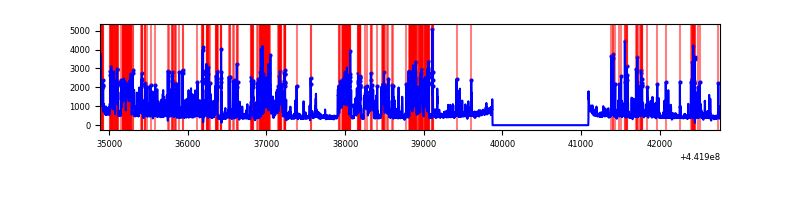 |
Top three noisy pixels from each quadrant. If the there are fewer than three noisy pixels in the level2.evt file, extra rows are filled as -1
| Pixel properties | Quadrant properties | ||||||
|---|---|---|---|---|---|---|---|
| Quadrant | DetID | PixID | Counts | Sigma | Mean | Median | Sigma |
| A | 10 | 83 | 2026481 | 13046.49 | 756 | 740 | 155.3 |
| A | 15 | 223 | 775596 | 4990.35 | 756 | 740 | 155.3 |
| A | 13 | 248 | 78146 | 498.52 | 756 | 740 | 155.3 |
| B | 5 | 255 | 379336 | 2542.23 | 766 | 743 | 148.9 |
| B | 0 | 186 | 42069 | 277.5 | 766 | 743 | 148.9 |
| B | 0 | 189 | 37316 | 245.59 | 766 | 743 | 148.9 |
| C | 3 | 233 | 58030 | 324.76 | 756 | 761 | 176.3 |
| C | 14 | 254 | 21457 | 117.36 | 756 | 761 | 176.3 |
| C | 14 | 206 | 13608 | 72.85 | 756 | 761 | 176.3 |
| D | 11 | 241 | 1778178 | 9743.53 | 735 | 715 | 182.4 |
| D | 13 | 249 | 610737 | 3343.96 | 735 | 715 | 182.4 |
| D | 2 | 249 | 140593 | 766.77 | 735 | 715 | 182.4 |
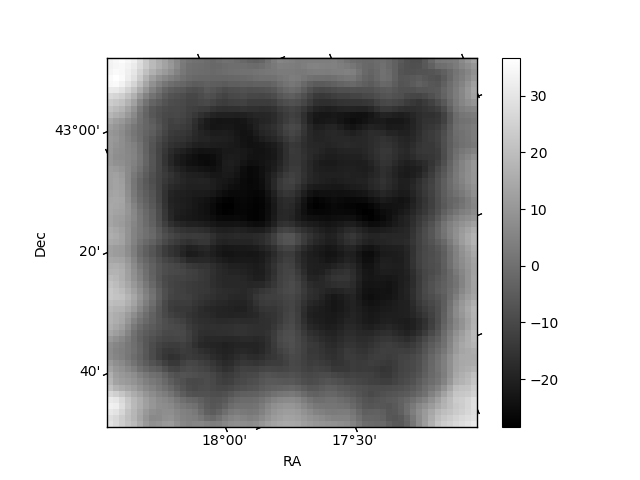
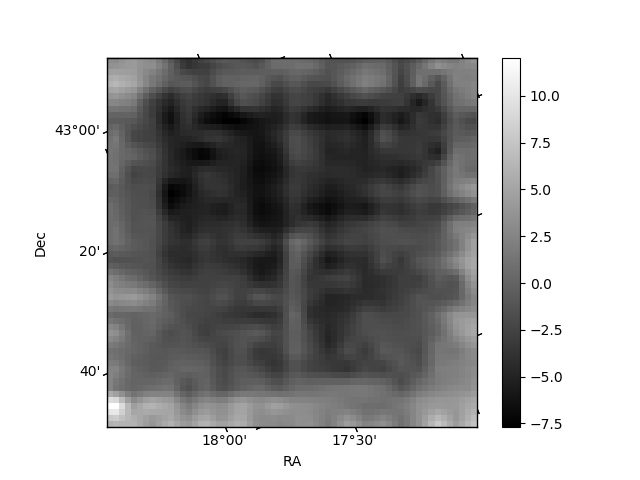
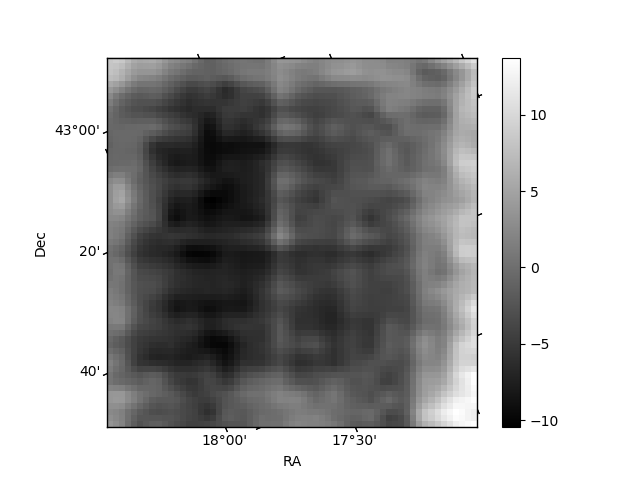
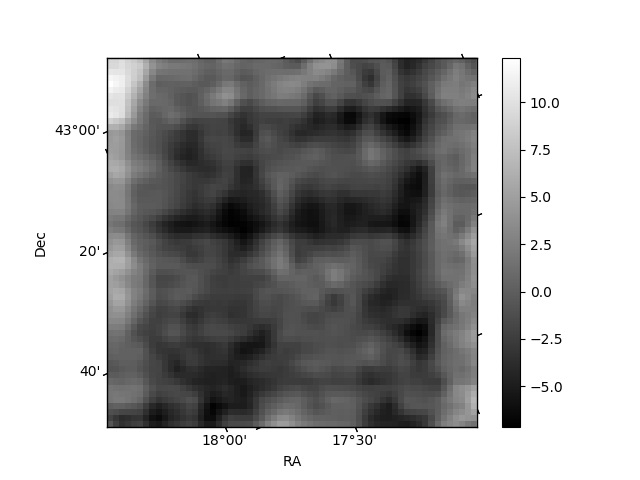
Histogram calculated using DETX and DETY for each event in the final _common_clean file
| Quadrant A | 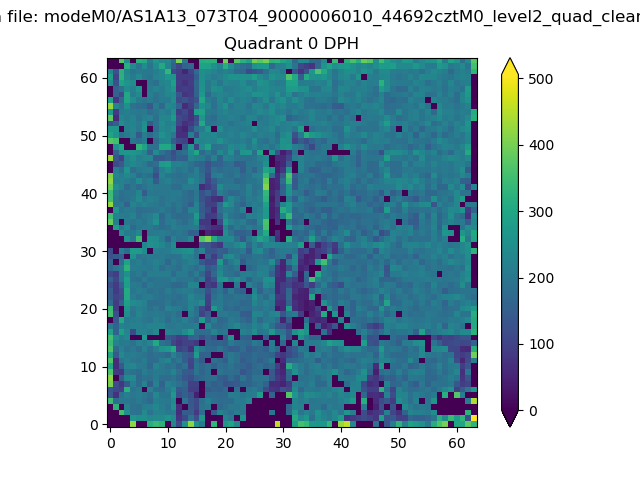 |
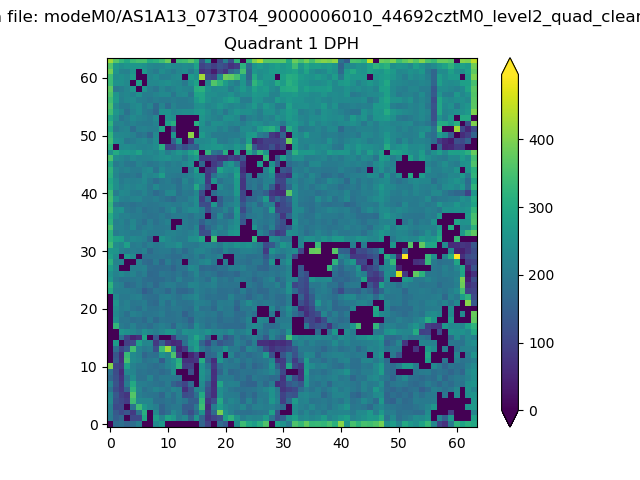 |
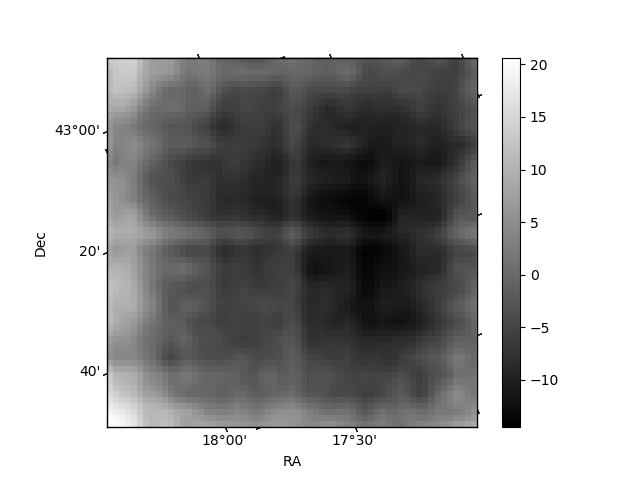
Quadrant B |
|---|---|---|---|
| Quadrant D | 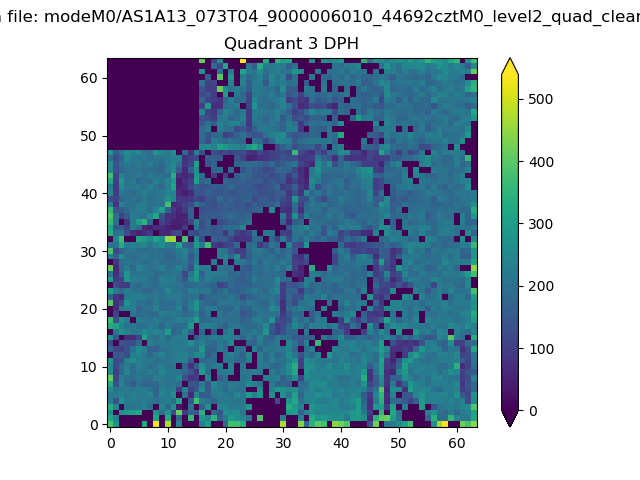 |
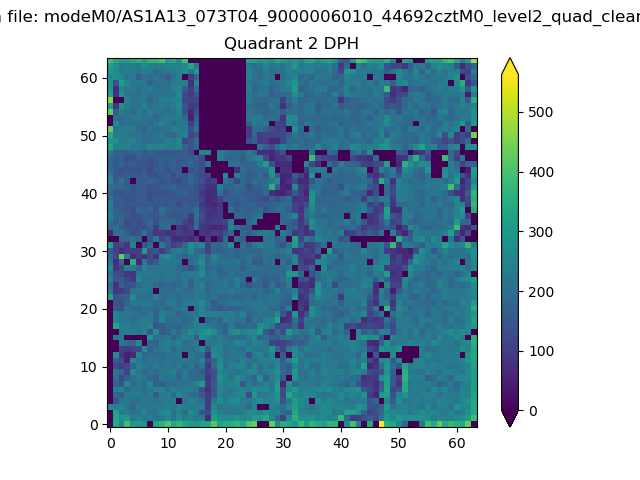 |
Quadrant C |
| Plot type | Count rate plots | Images |
|---|---|---|
| Comparison with Poisson distribution Blue bars denote a histogram of data divided into 1 sec bins. Red curve is a Poisson curve with rate = median count rate of data. |
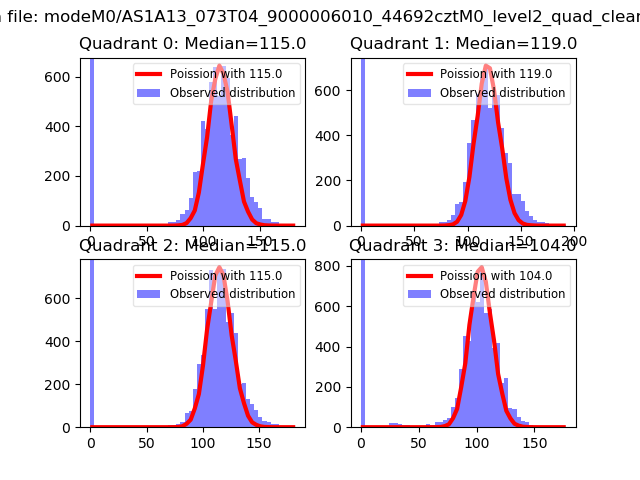 |
 |
| Quadrant-wise count rates Data is divided into 100 sec bins |
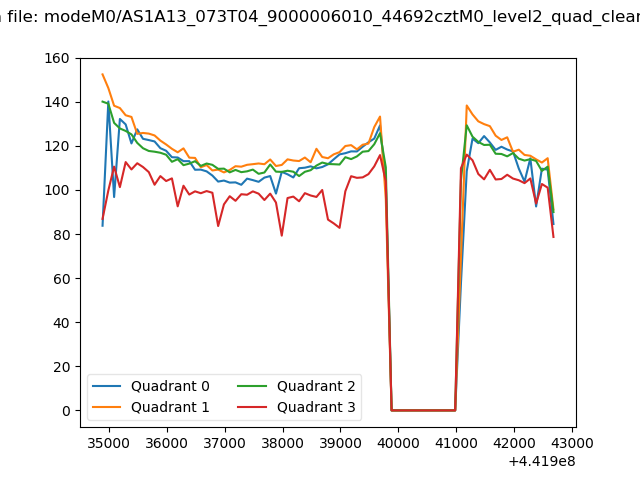 |
|
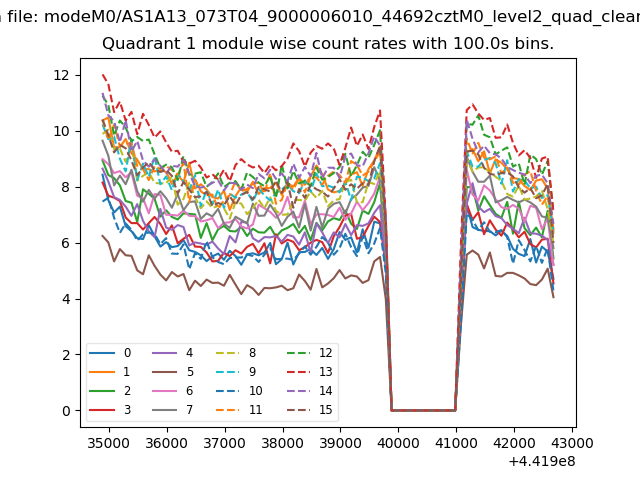
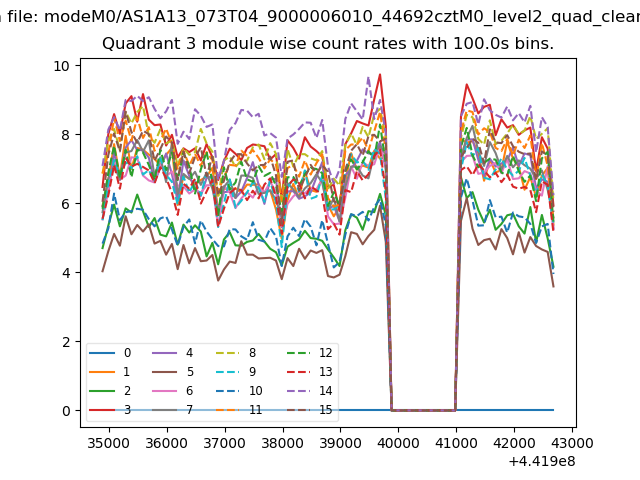
| Module-wise count rates for Quadrant A Data is divided into 100 sec bins |
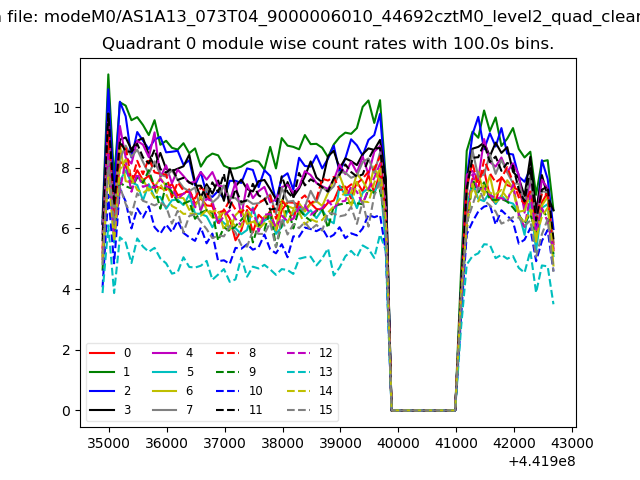 |
 |
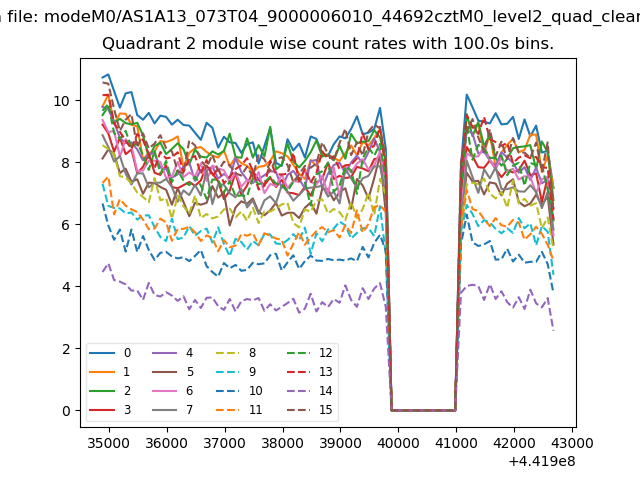
| Module-wise count rates for Quadrant B Data is divided into 100 sec bins |
 |
 |
| Module-wise count rates for Quadrant C Data is divided into 100 sec bins |
 |
 |
| Module-wise count rates for Quadrant D Data is divided into 100 sec bins |
 |
 |
| Parameter | Plot |
|---|---|
| CZT HV Monitor |  |
| D_VDD | 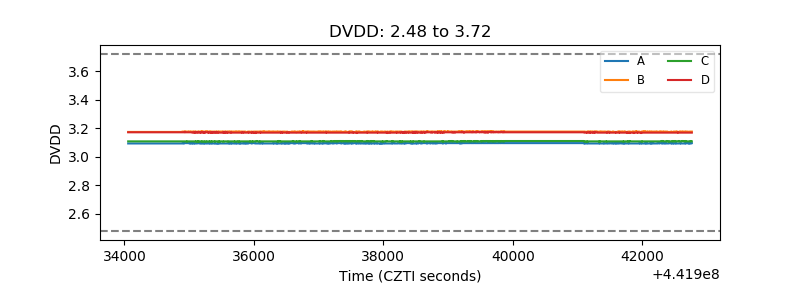 |
| Temperature 1 | 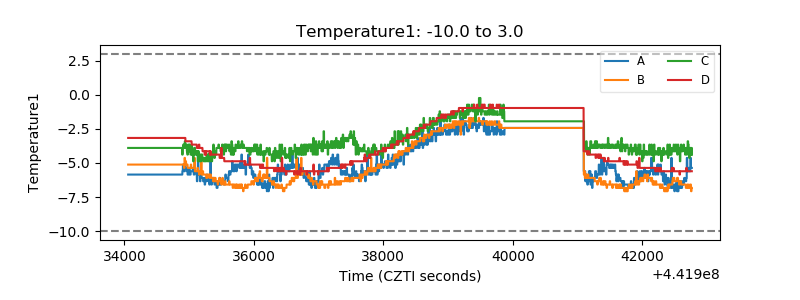 |
| Veto HV Monitor | 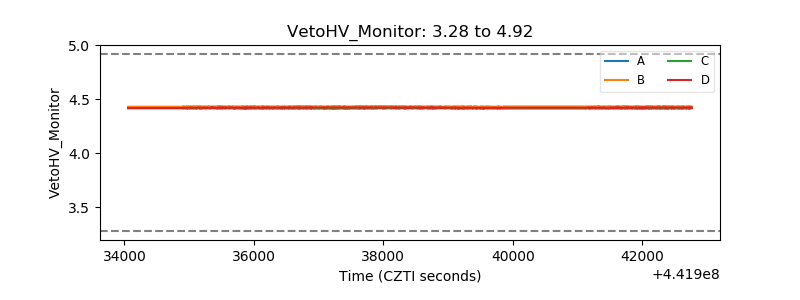 |
| Veto LLD | 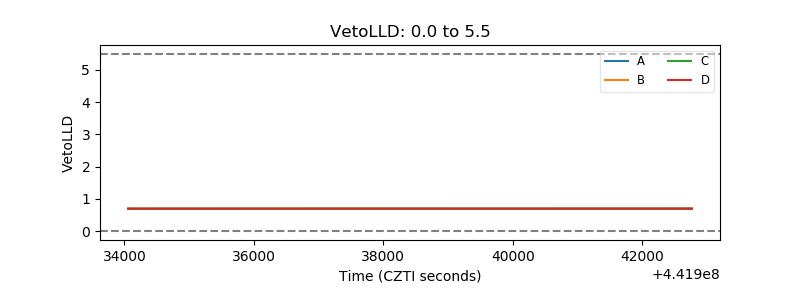 |
| Alpha Counter | 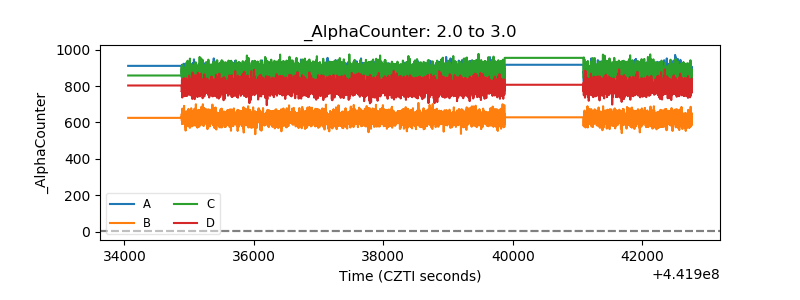 |
| _CPM_Rate | 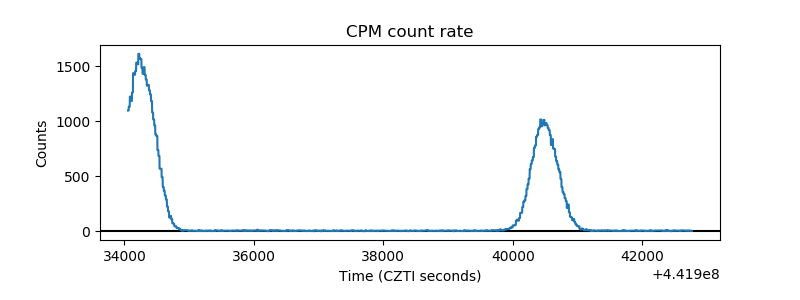 |
| CZT Counter | 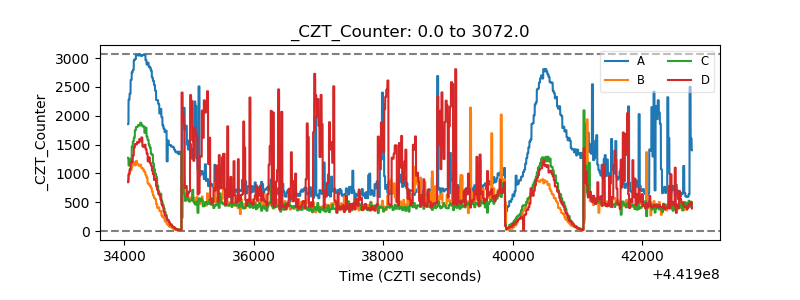 |
| +2.5 Volts monitor | 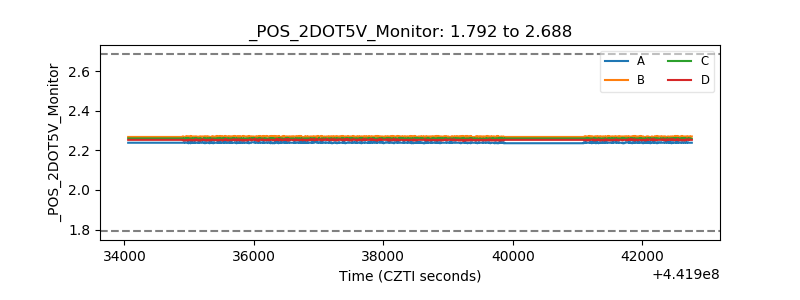 |
| +5 Volts monitor | 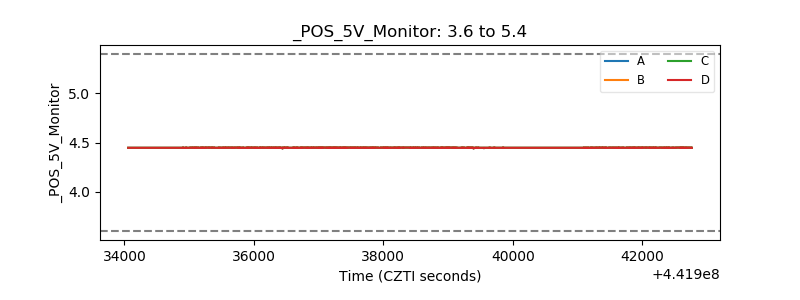 |
| _ROLL_ROT | 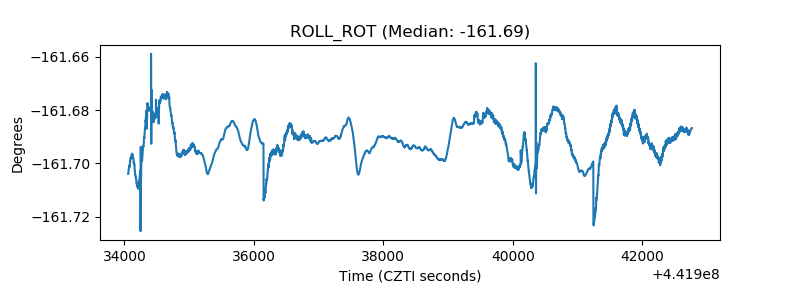 |
| _Roll_DEC | 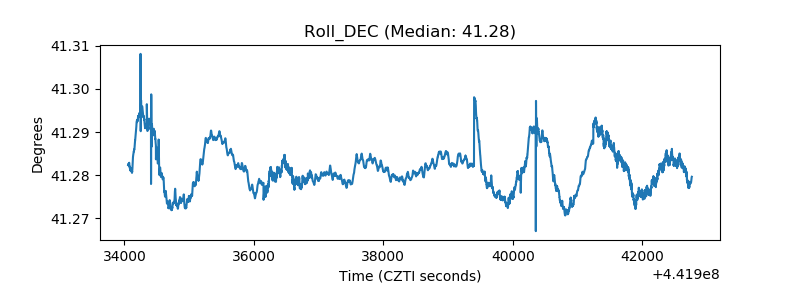 |
| _Roll_RA | 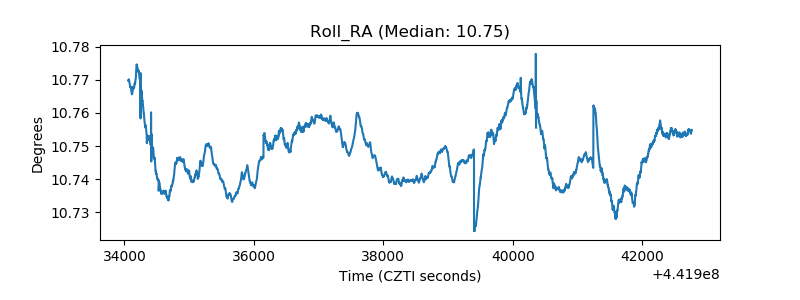 |
| Veto Counter | 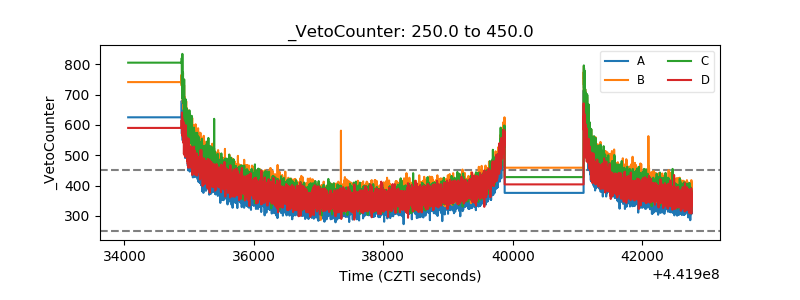 |