| Param | Original file | Final file |
|---|---|---|
| Filename | modeM0/AS1A13_073T04_9000006010_44693cztM0_level2.fits | modeM0/AS1A13_073T04_9000006010_44693cztM0_level2_quad_clean.evt |
| Size (bytes) | 491,014,080 | 112,230,720 |
| Size | 468.3 MB | 107.0 MB |
| Events in quadrant A | 6,304,886 | 732,180 |
| Events in quadrant B | 3,521,193 | 775,645 |
| Events in quadrant C | 3,179,266 | 756,947 |
| Events in quadrant D | 4,644,745 | 662,076 |
| Mode SS | |||
|---|---|---|---|
| Quadrant | BADHDUFLAG | Total packets | Discarded packets |
| A | 0 | 136 | 0 |
| B | 0 | 136 | 0 |
| C | 0 | 136 | 0 |
| D | 0 | 136 | 0 |
| Mode M9 | |||
|---|---|---|---|
| Quadrant | BADHDUFLAG | Total packets | Discarded packets |
| A | 0 | 17 | 0 |
| B | 0 | 18 | 0 |
| C | 0 | 18 | 0 |
| D | 0 | 18 | 0 |
| Mode M0 | |||
|---|---|---|---|
| Quadrant | BADHDUFLAG | Total packets | Discarded packets |
| A | 0 | 24034 | 2 |
| B | 0 | 15028 | 2 |
| C | 0 | 14321 | 2 |
| D | 0 | 18511 | 2 |
| Quadrant | Total seconds | Saturated seconds | Saturation percentage |
|---|---|---|---|
| A | 6770 | 401 | 5.923191% |
| B | 6770 | 178 | 2.629247% |
| C | 6770 | 70 | 1.033973% |
| D | 6770 | 428 | 6.322009% |
Noise dominated data is calculated using 1-second bins in cleaned event files. If a bin has >2000 counts, and if more than 50% of those come from <1% of pixels, then it is considered to be noise-dominated and hence unusable.
| Quadrant | # 1 sec bins | Bins with >0 counts | Bins with >2000 counts | High rate bins dominated by noise | Noise dominated (total time) | Noise dominated (detector-on time) | Marked lightcurve |
|---|---|---|---|---|---|---|---|
| A | 7855 | 6771 | 192 | 192 | 2.44% | 2.84% | 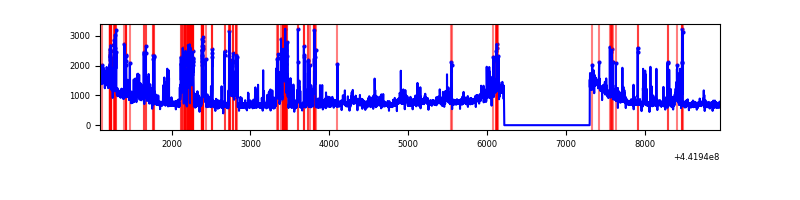 |
| B | 7855 | 6771 | 37 | 37 | 0.47% | 0.55% | 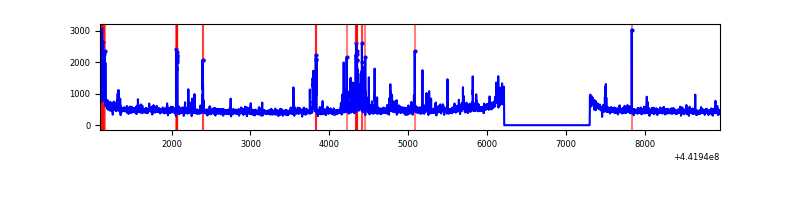 |
| C | 7855 | 6771 | 21 | 21 | 0.27% | 0.31% | 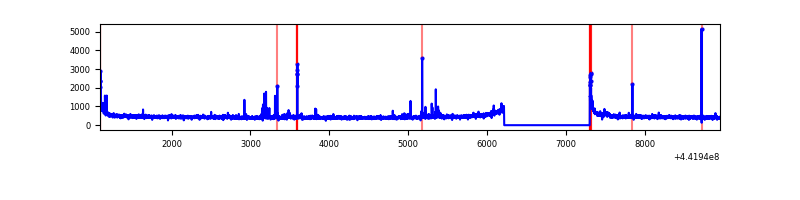 |
| D | 7855 | 6771 | 266 | 266 | 3.39% | 3.93% | 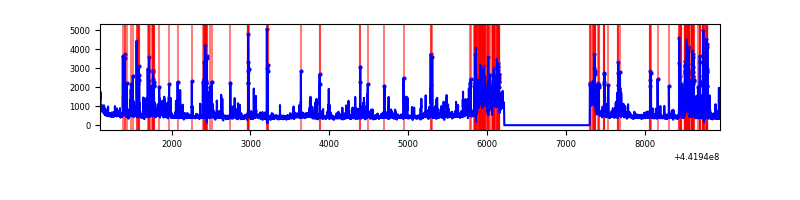 |
Top three noisy pixels from each quadrant. If the there are fewer than three noisy pixels in the level2.evt file, extra rows are filled as -1
| Pixel properties | Quadrant properties | ||||||
|---|---|---|---|---|---|---|---|
| Quadrant | DetID | PixID | Counts | Sigma | Mean | Median | Sigma |
| A | 10 | 83 | 2055185 | 12860.99 | 766 | 750 | 159.7 |
| A | 15 | 223 | 1196731 | 7486.97 | 766 | 750 | 159.7 |
| A | 12 | 227 | 57923 | 357.91 | 766 | 750 | 159.7 |
| B | 4 | 171 | 166843 | 1092.35 | 774 | 749 | 152.1 |
| B | 5 | 255 | 122082 | 797.97 | 774 | 749 | 152.1 |
| B | 0 | 189 | 102946 | 672.12 | 774 | 749 | 152.1 |
| C | 3 | 233 | 110826 | 619.01 | 762 | 765 | 177.8 |
| C | 14 | 254 | 81745 | 455.45 | 762 | 765 | 177.8 |
| C | 12 | 250 | 7722 | 39.13 | 762 | 765 | 177.8 |
| D | 13 | 249 | 753681 | 4120.72 | 738 | 715 | 182.7 |
| D | 11 | 241 | 271852 | 1483.84 | 738 | 715 | 182.7 |
| D | 2 | 249 | 180051 | 981.44 | 738 | 715 | 182.7 |
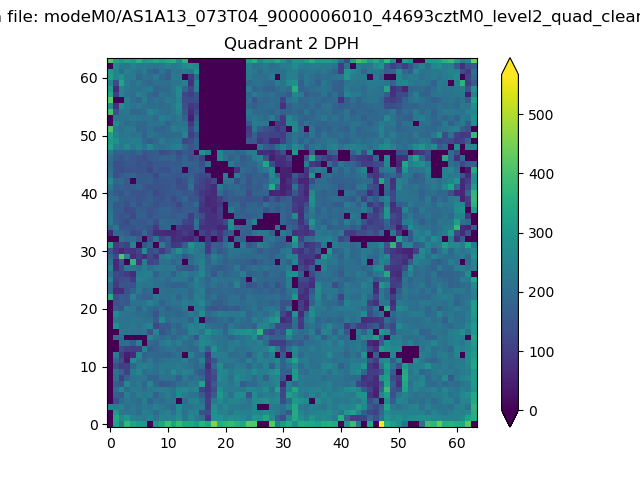
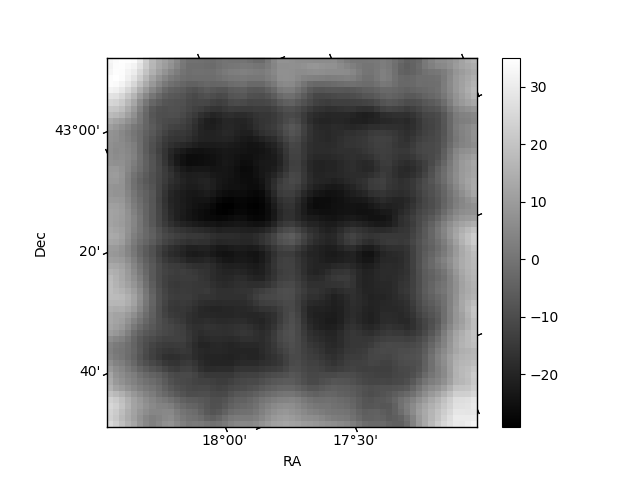
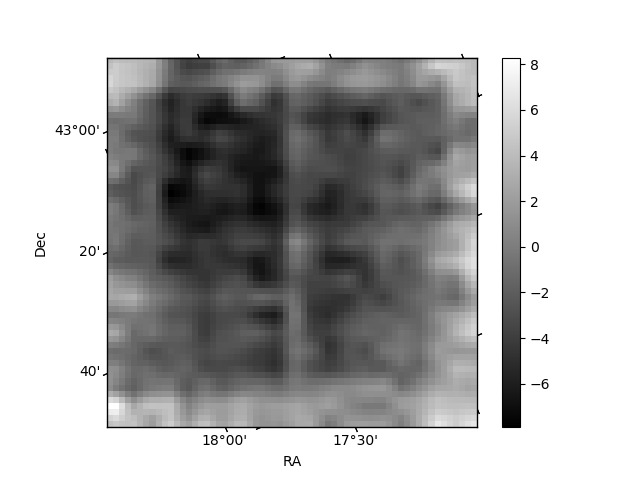
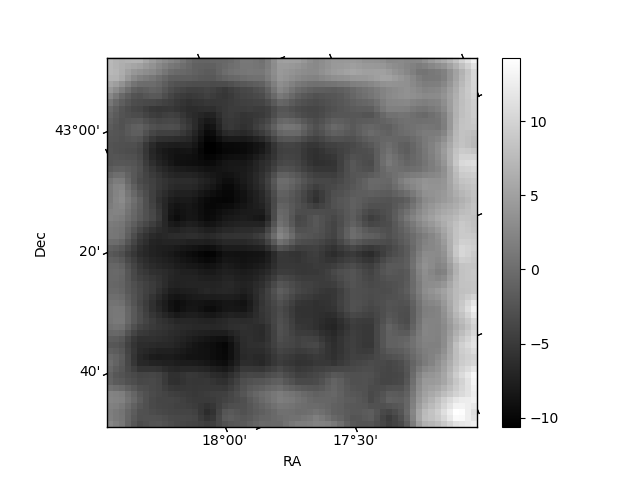
Histogram calculated using DETX and DETY for each event in the final _common_clean file
| Quadrant A | 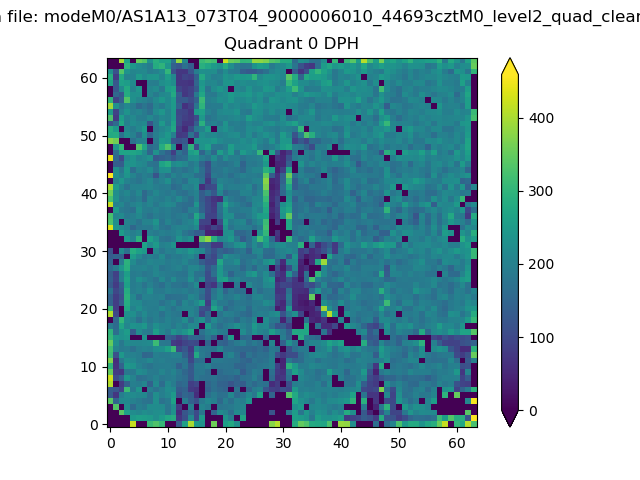 |
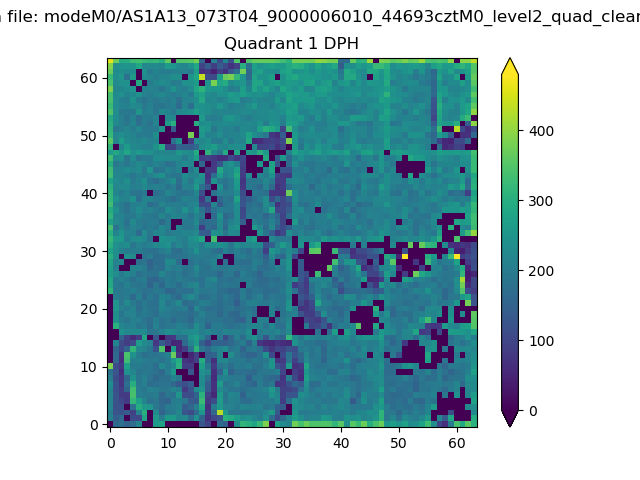 |
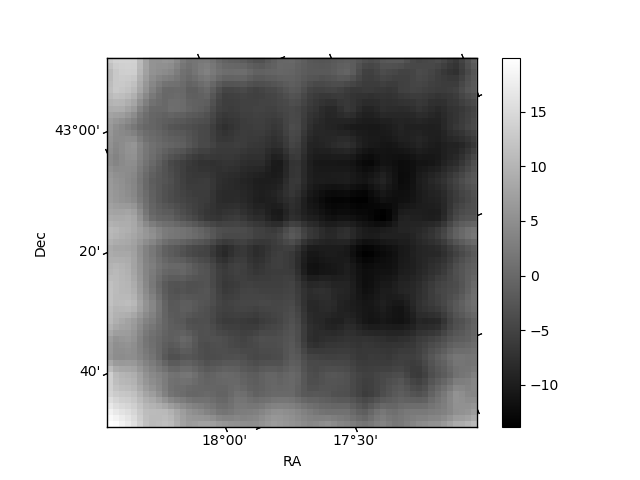
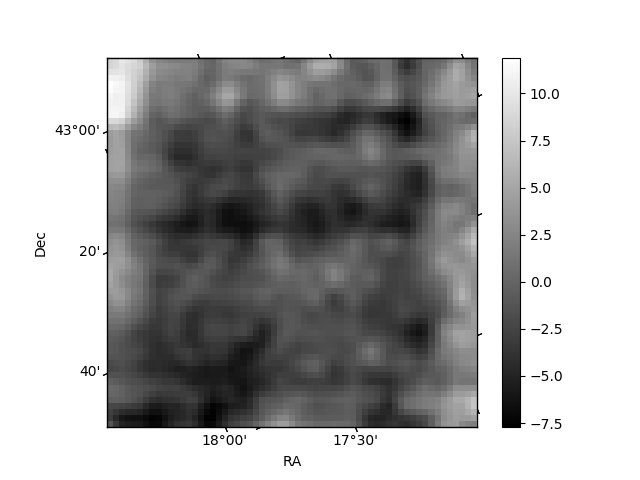
Quadrant B |
|---|---|---|---|
| Quadrant D | 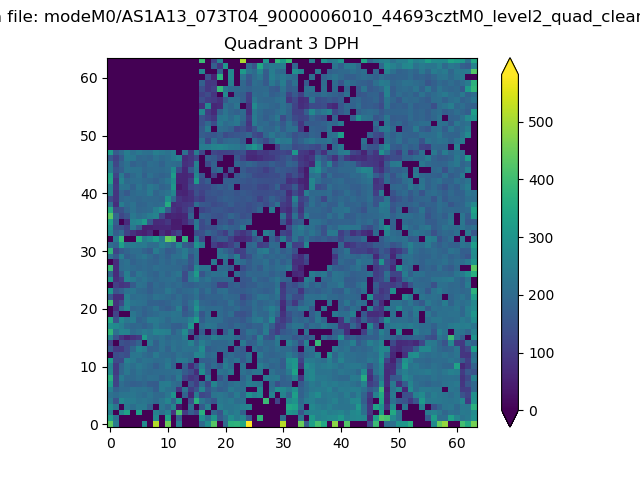 |
 |
Quadrant C |
| Plot type | Count rate plots | Images |
|---|---|---|
| Comparison with Poisson distribution Blue bars denote a histogram of data divided into 1 sec bins. Red curve is a Poisson curve with rate = median count rate of data. |
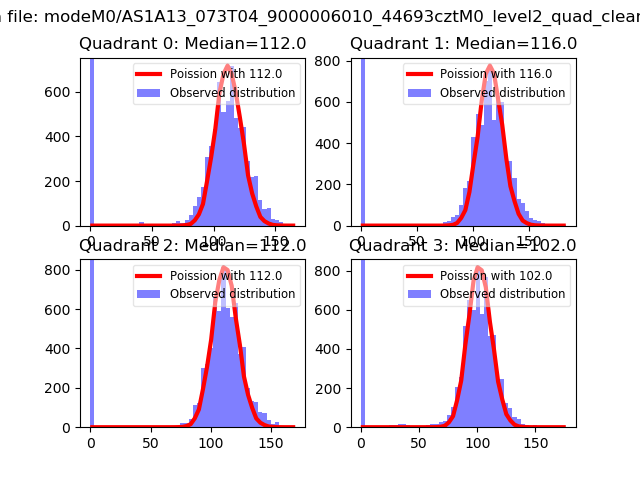 |
 |
| Quadrant-wise count rates Data is divided into 100 sec bins |
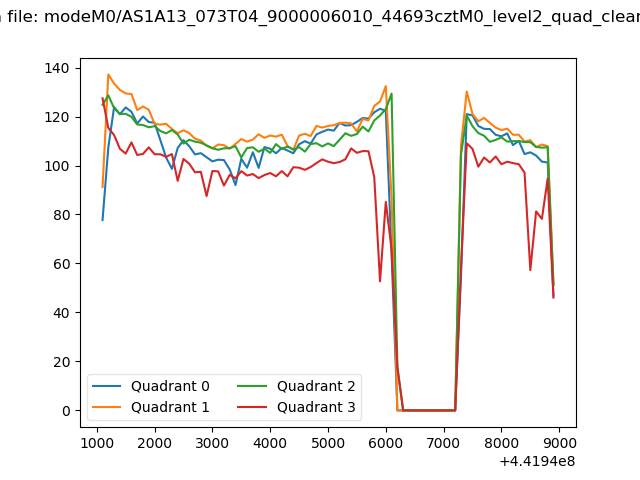 |
|
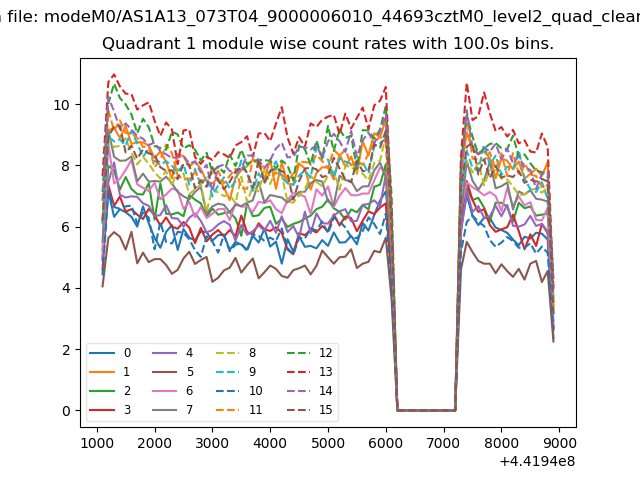
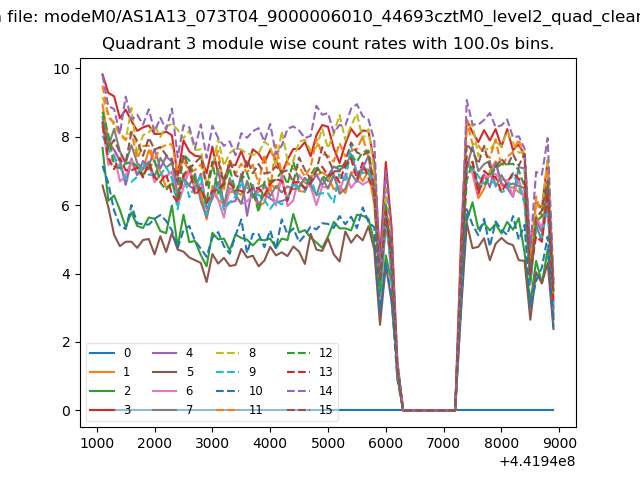
| Module-wise count rates for Quadrant A Data is divided into 100 sec bins |
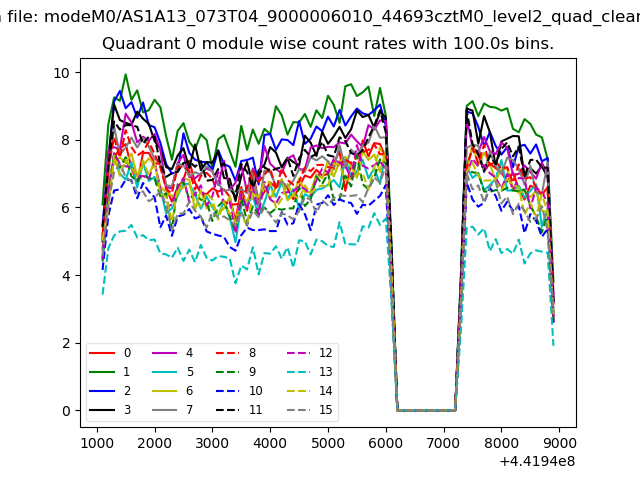 |
 |
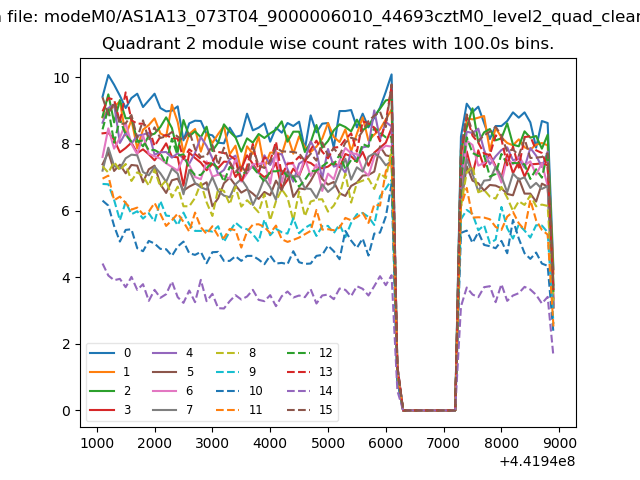
| Module-wise count rates for Quadrant B Data is divided into 100 sec bins |
 |
 |
| Module-wise count rates for Quadrant C Data is divided into 100 sec bins |
 |
 |
| Module-wise count rates for Quadrant D Data is divided into 100 sec bins |
 |
 |
| Parameter | Plot |
|---|---|
| CZT HV Monitor | 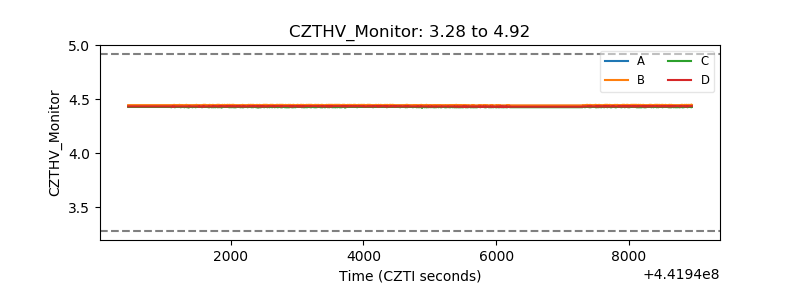 |
| D_VDD | 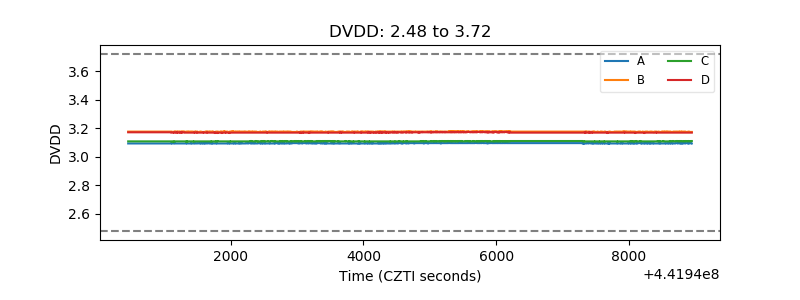 |
| Temperature 1 | 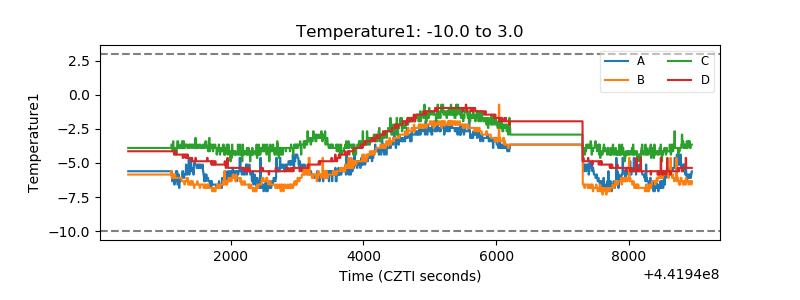 |
| Veto HV Monitor | 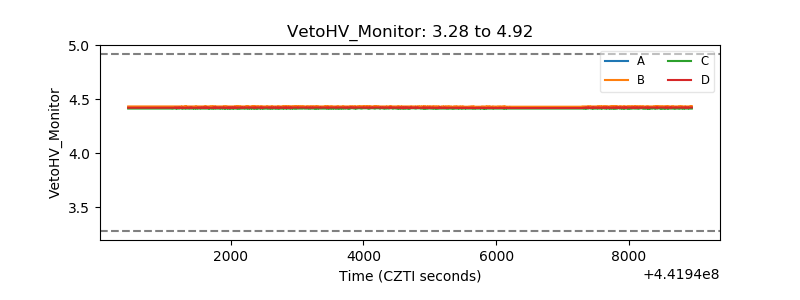 |
| Veto LLD | 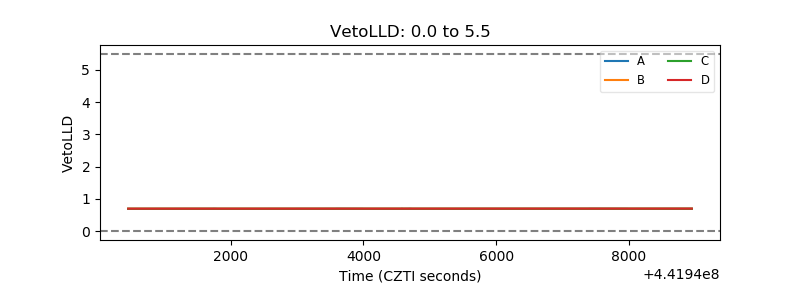 |
| Alpha Counter | 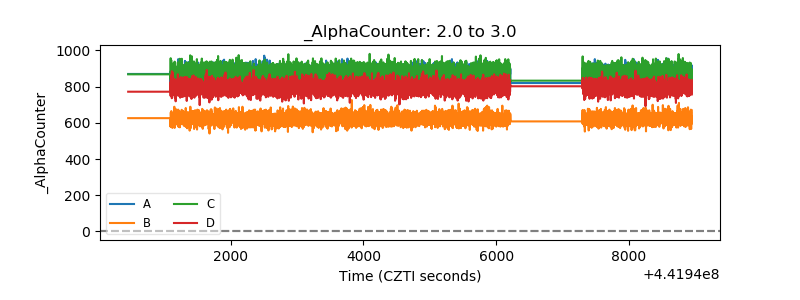 |
| _CPM_Rate | 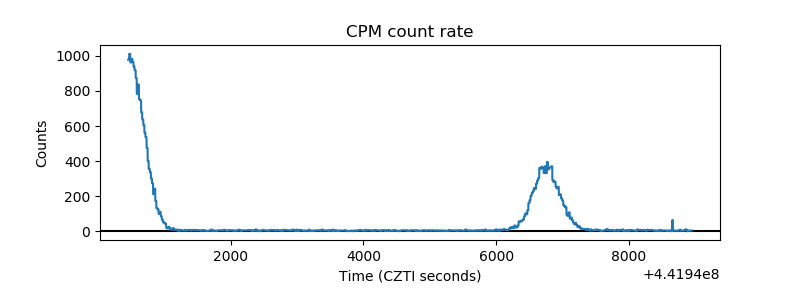 |
| CZT Counter | 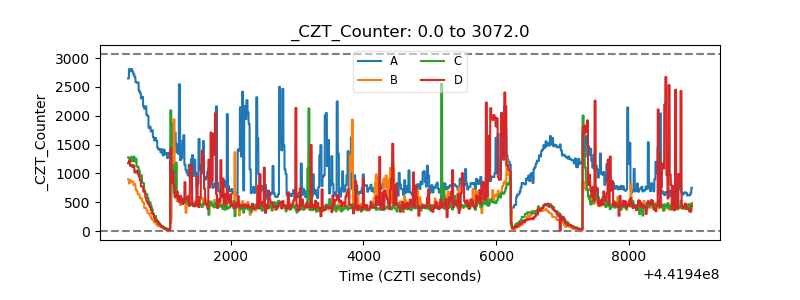 |
| +2.5 Volts monitor | 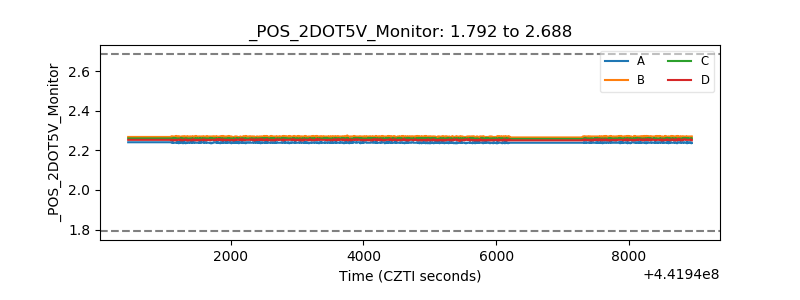 |
| +5 Volts monitor | 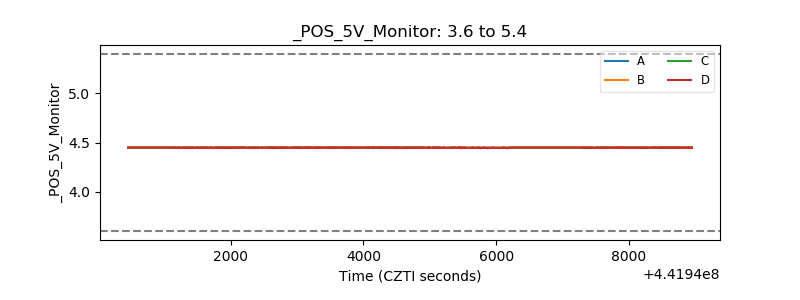 |
| _ROLL_ROT | 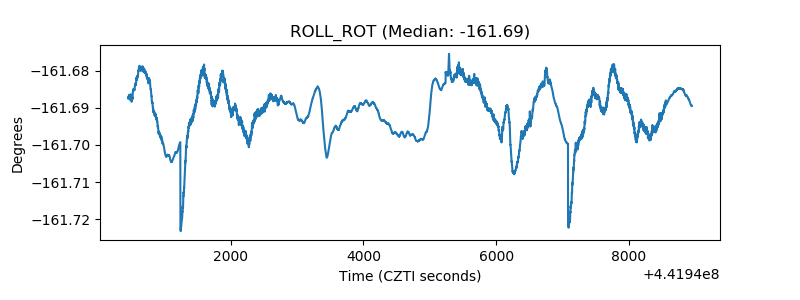 |
| _Roll_DEC | 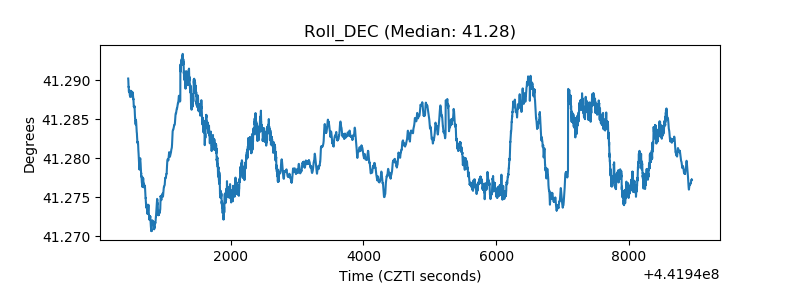 |
| _Roll_RA | 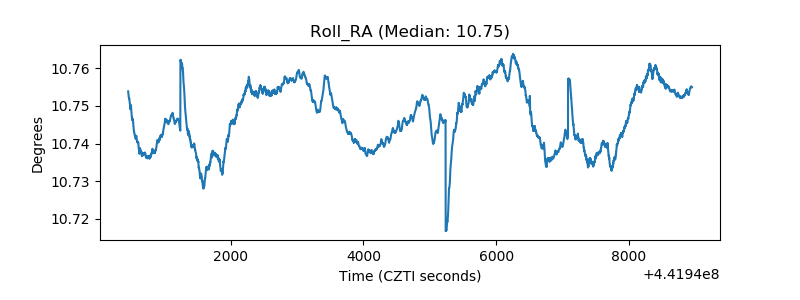 |
| Veto Counter | 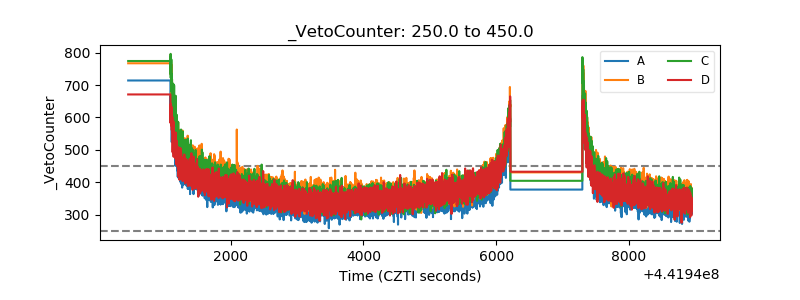 |