| Param | Original file | Final file |
|---|---|---|
| Filename | modeM0/AS1A13_073T04_9000006010_44694cztM0_level2.fits | modeM0/AS1A13_073T04_9000006010_44694cztM0_level2_quad_clean.evt |
| Size (bytes) | 511,136,640 | 110,260,800 |
| Size | 487.5 MB | 105.2 MB |
| Events in quadrant A | 6,257,024 | 715,034 |
| Events in quadrant B | 4,049,289 | 737,550 |
| Events in quadrant C | 3,134,377 | 747,335 |
| Events in quadrant D | 4,942,734 | 656,569 |
| Mode SS | |||
|---|---|---|---|
| Quadrant | BADHDUFLAG | Total packets | Discarded packets |
| A | 0 | 140 | 0 |
| B | 0 | 140 | 0 |
| C | 0 | 140 | 0 |
| D | 0 | 140 | 0 |
| Mode M9 | |||
|---|---|---|---|
| Quadrant | BADHDUFLAG | Total packets | Discarded packets |
| A | 0 | 8 | 0 |
| B | 0 | 8 | 0 |
| C | 0 | 8 | 0 |
| D | 0 | 8 | 0 |
| Mode M0 | |||
|---|---|---|---|
| Quadrant | BADHDUFLAG | Total packets | Discarded packets |
| A | 0 | 24110 | 1 |
| B | 0 | 16728 | 1 |
| C | 0 | 14407 | 1 |
| D | 0 | 19451 | 1 |
| Quadrant | Total seconds | Saturated seconds | Saturation percentage |
|---|---|---|---|
| A | 6920 | 432 | 6.242775% |
| B | 6921 | 386 | 5.577229% |
| C | 6921 | 61 | 0.881376% |
| D | 6921 | 418 | 6.039590% |
Noise dominated data is calculated using 1-second bins in cleaned event files. If a bin has >2000 counts, and if more than 50% of those come from <1% of pixels, then it is considered to be noise-dominated and hence unusable.
| Quadrant | # 1 sec bins | Bins with >0 counts | Bins with >2000 counts | High rate bins dominated by noise | Noise dominated (total time) | Noise dominated (detector-on time) | Marked lightcurve |
|---|---|---|---|---|---|---|---|
| A | 7695 | 6921 | 181 | 181 | 2.35% | 2.62% | 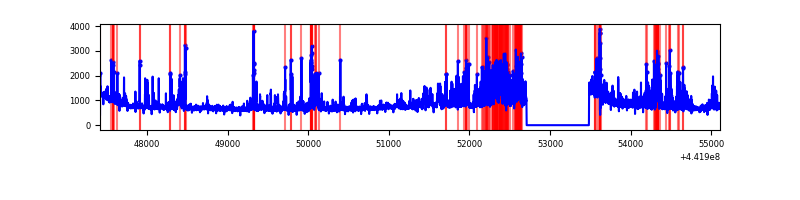 |
| B | 7696 | 6921 | 166 | 166 | 2.16% | 2.40% | 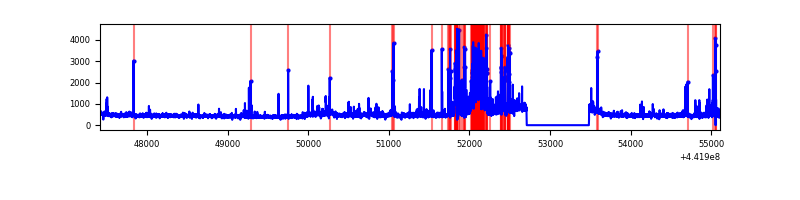 |
| C | 7696 | 6922 | 4 | 4 | 0.05% | 0.06% | 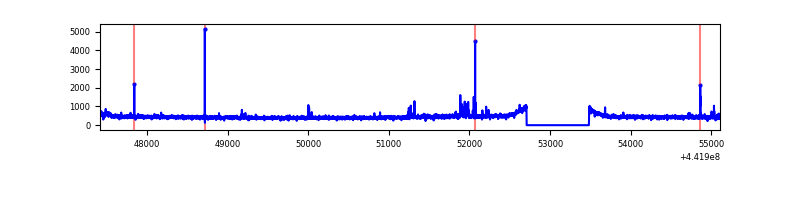 |
| D | 7696 | 6922 | 295 | 295 | 3.83% | 4.26% | 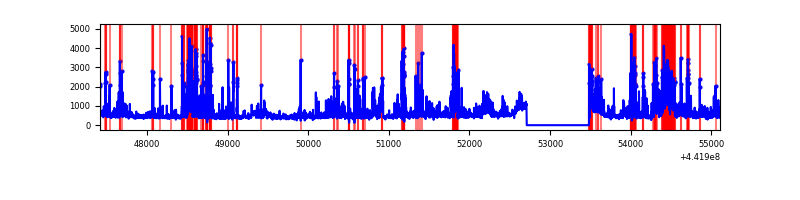 |
Top three noisy pixels from each quadrant. If the there are fewer than three noisy pixels in the level2.evt file, extra rows are filled as -1
| Pixel properties | Quadrant properties | ||||||
|---|---|---|---|---|---|---|---|
| Quadrant | DetID | PixID | Counts | Sigma | Mean | Median | Sigma |
| A | 10 | 83 | 1992728 | 12440.6 | 766 | 748 | 160.1 |
| A | 15 | 223 | 1165782 | 7276.04 | 766 | 748 | 160.1 |
| A | 12 | 227 | 61397 | 378.77 | 766 | 748 | 160.1 |
| B | 5 | 255 | 766544 | 5054.23 | 768 | 744 | 151.5 |
| B | 0 | 186 | 78929 | 516.02 | 768 | 744 | 151.5 |
| B | 0 | 190 | 67998 | 443.87 | 768 | 744 | 151.5 |
| C | 3 | 233 | 40500 | 220.47 | 771 | 777 | 180.2 |
| C | 14 | 254 | 38923 | 211.72 | 771 | 777 | 180.2 |
| C | 15 | 208 | 37256 | 202.47 | 771 | 777 | 180.2 |
| D | 13 | 249 | 640030 | 3490.24 | 745 | 722 | 183.2 |
| D | 11 | 241 | 385284 | 2099.48 | 745 | 722 | 183.2 |
| D | 2 | 249 | 353005 | 1923.25 | 745 | 722 | 183.2 |
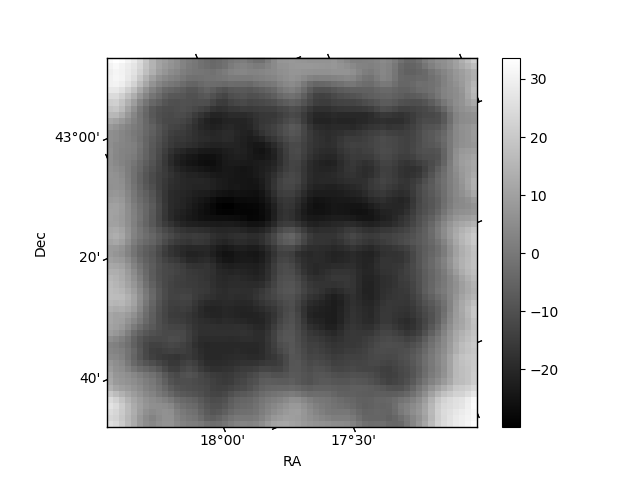
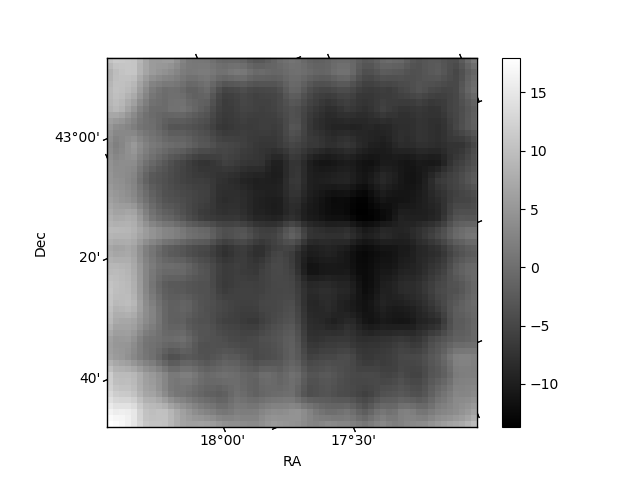
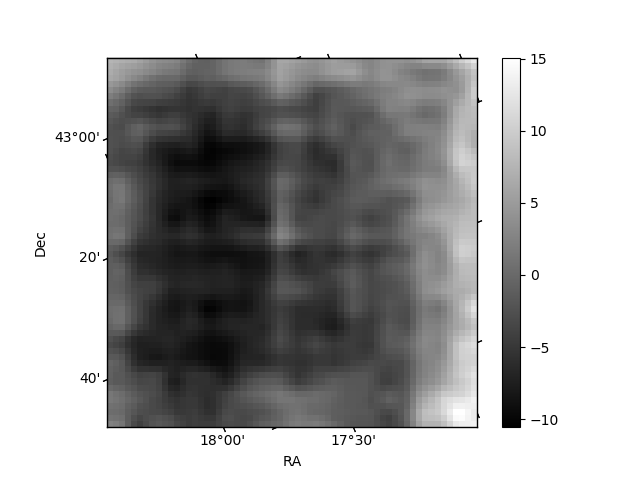
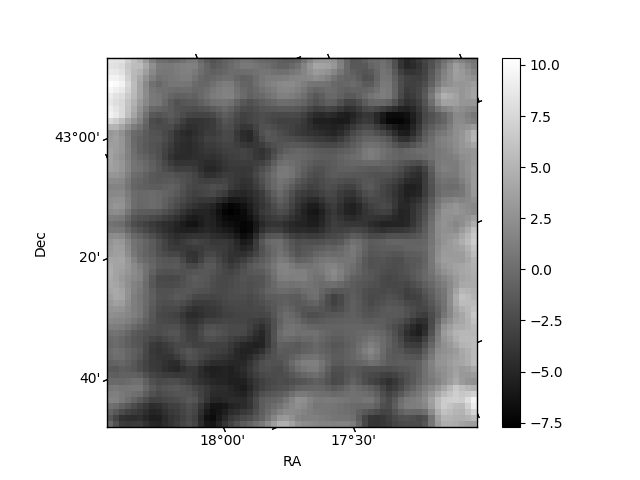
Histogram calculated using DETX and DETY for each event in the final _common_clean file
| Quadrant A | 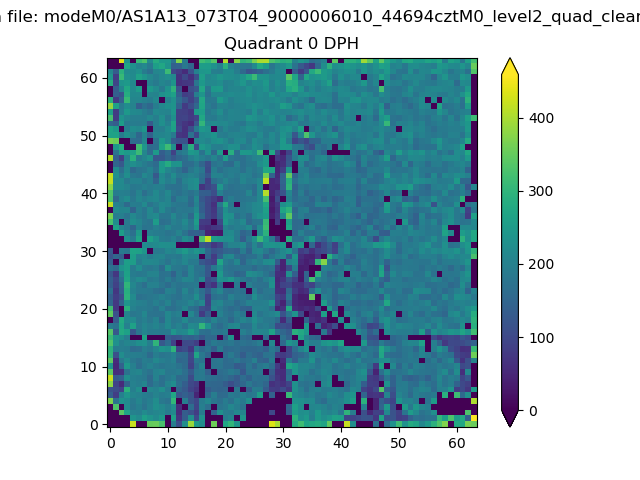 |
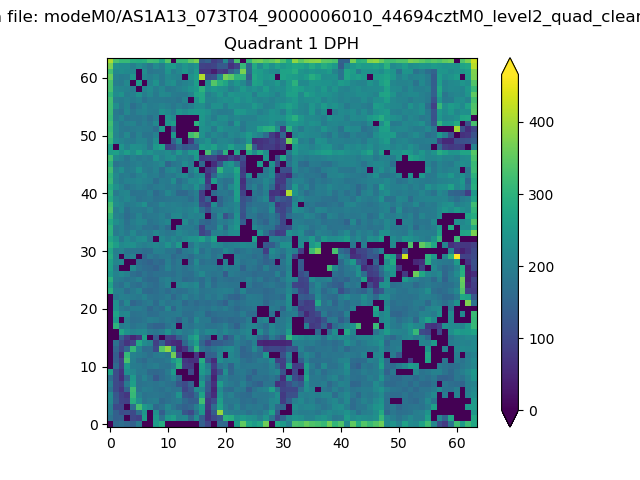 |
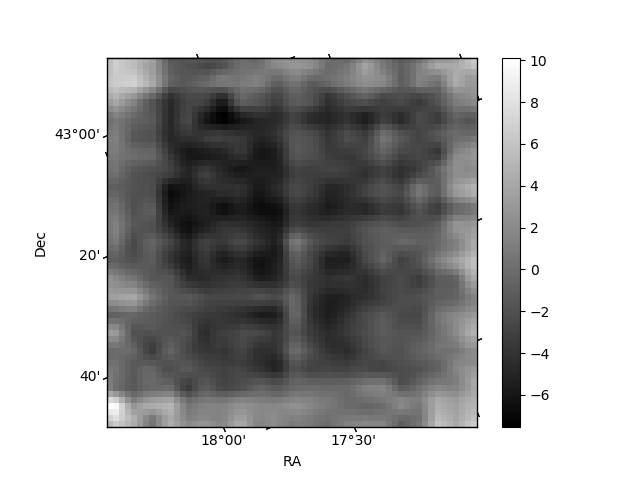
Quadrant B |
|---|---|---|---|
| Quadrant D | 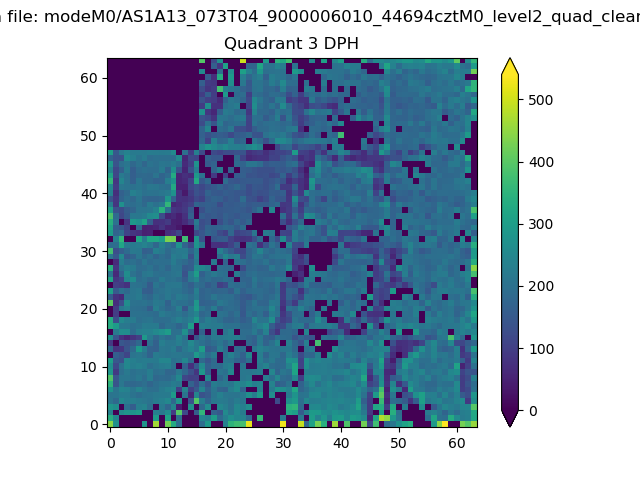 |
 |
Quadrant C |
| Plot type | Count rate plots | Images |
|---|---|---|
| Comparison with Poisson distribution Blue bars denote a histogram of data divided into 1 sec bins. Red curve is a Poisson curve with rate = median count rate of data. |
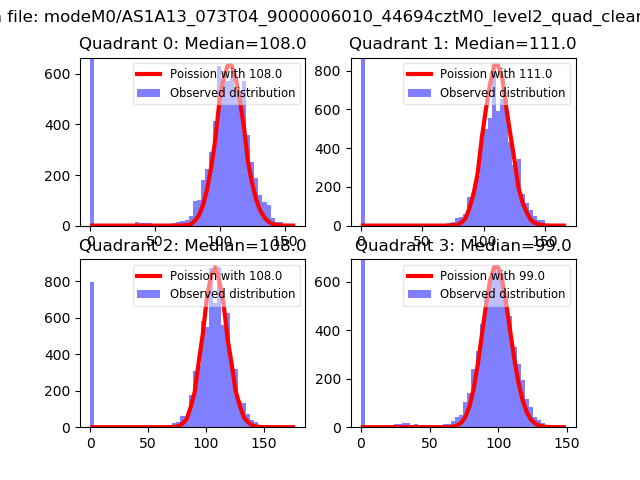 |
 |
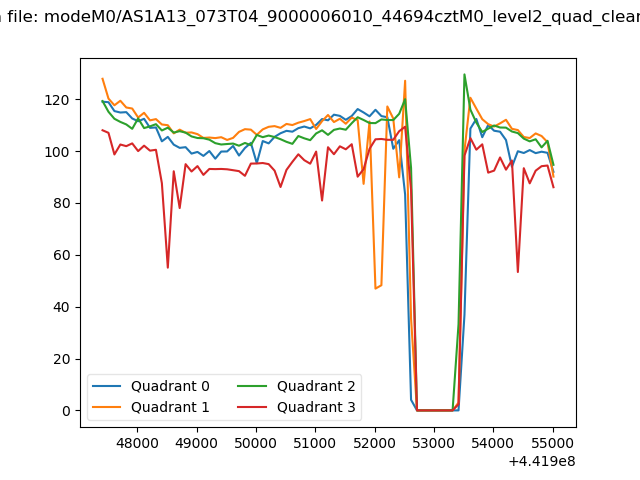
| Quadrant-wise count rates Data is divided into 100 sec bins |
 |
|
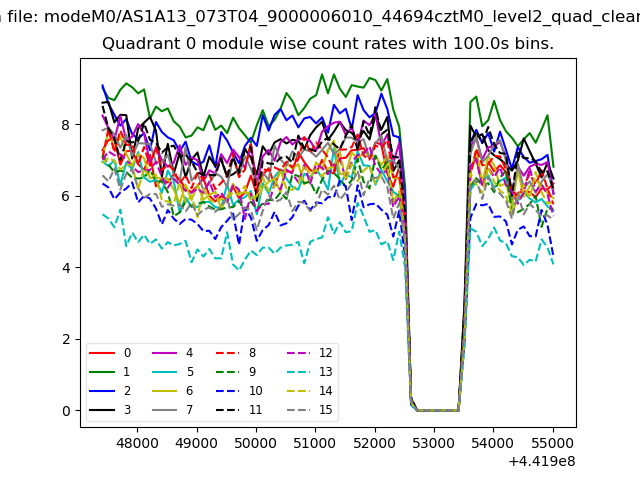
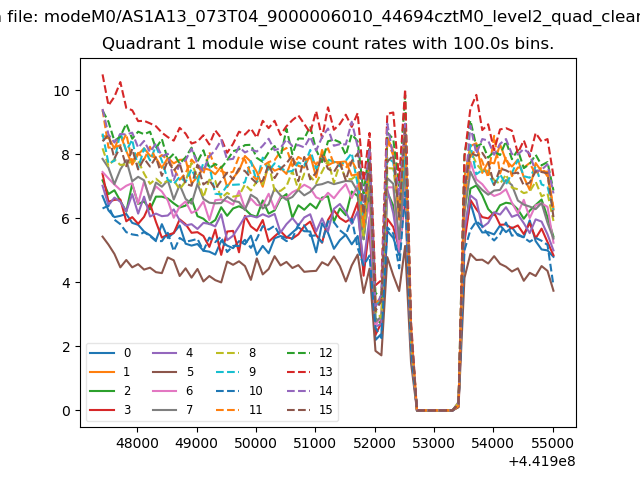
| Module-wise count rates for Quadrant A Data is divided into 100 sec bins |
 |
 |
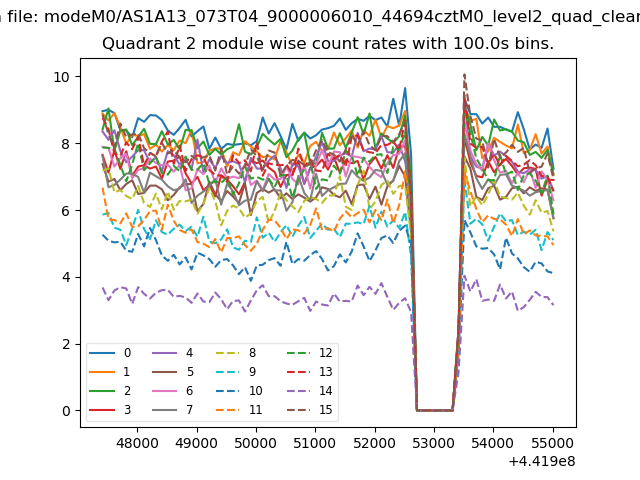
| Module-wise count rates for Quadrant B Data is divided into 100 sec bins |
 |
 |
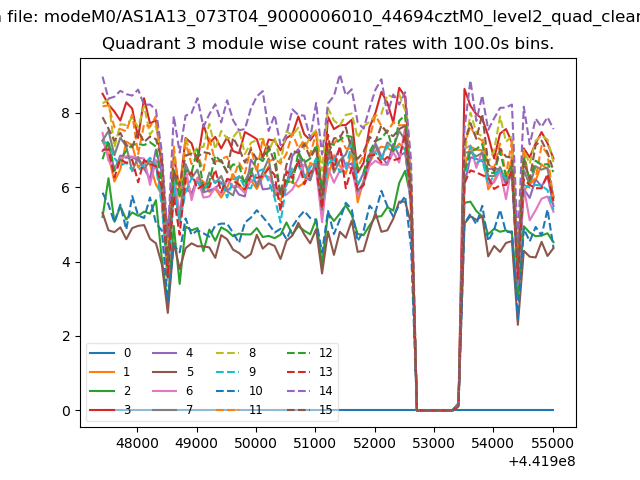
| Module-wise count rates for Quadrant C Data is divided into 100 sec bins |
 |
 |
| Module-wise count rates for Quadrant D Data is divided into 100 sec bins |
 |
 |
| Parameter | Plot |
|---|---|
| CZT HV Monitor | 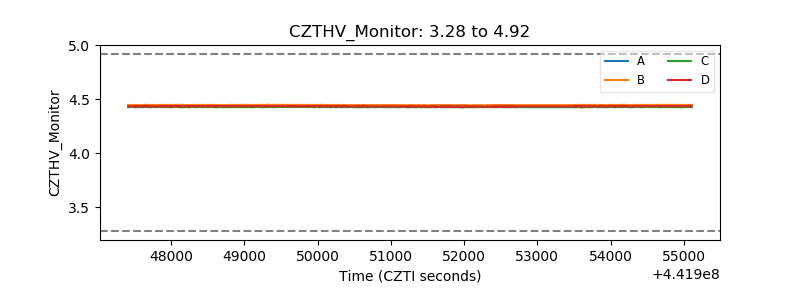 |
| D_VDD | 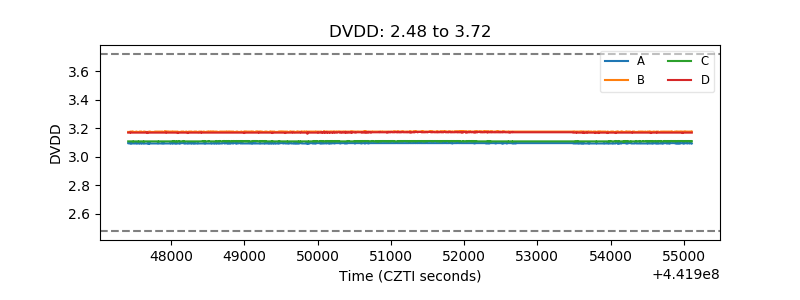 |
| Temperature 1 | 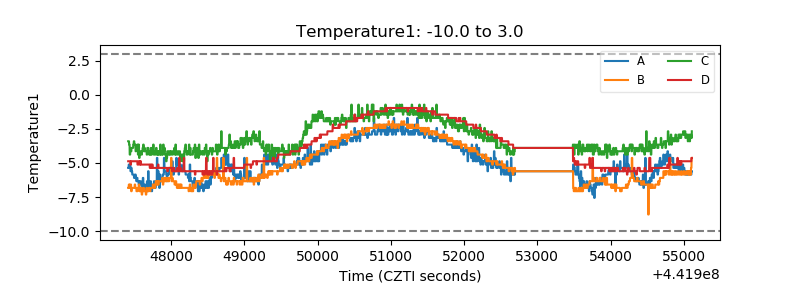 |
| Veto HV Monitor | 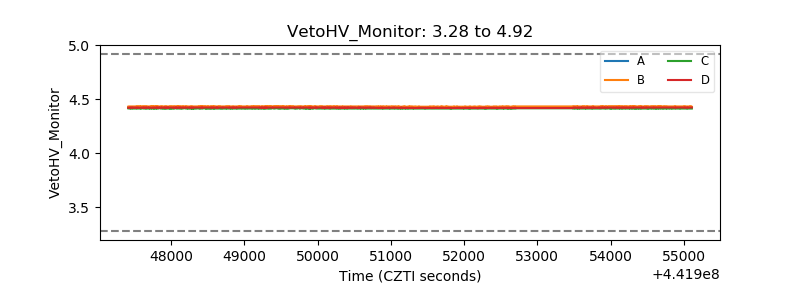 |
| Veto LLD |  |
| Alpha Counter | 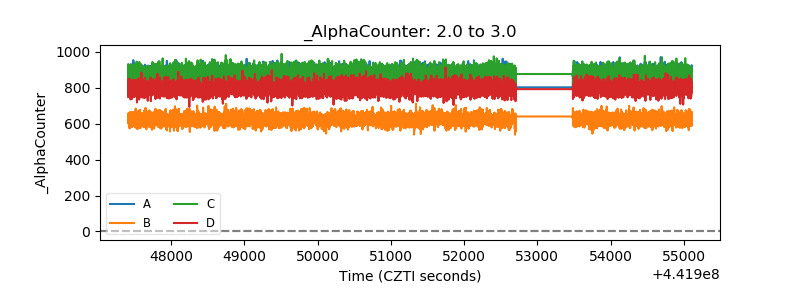 |
| _CPM_Rate | 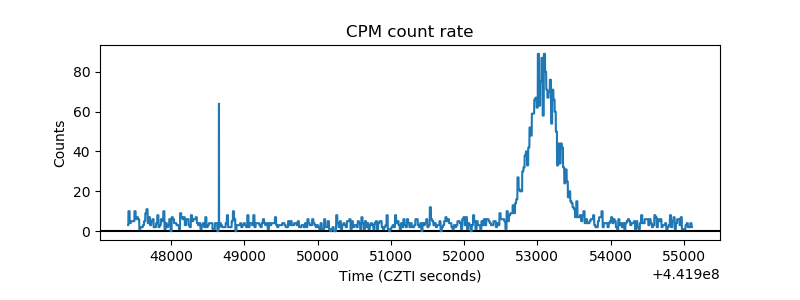 |
| CZT Counter | 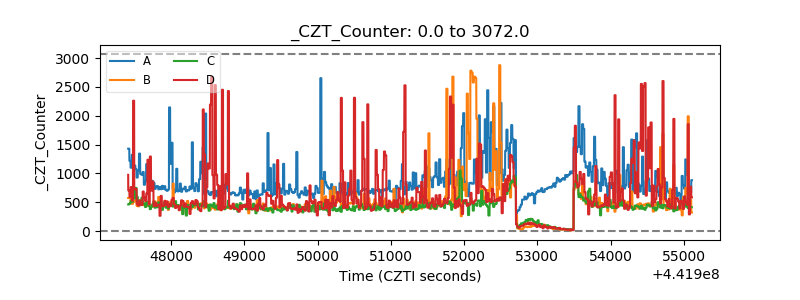 |
| +2.5 Volts monitor | 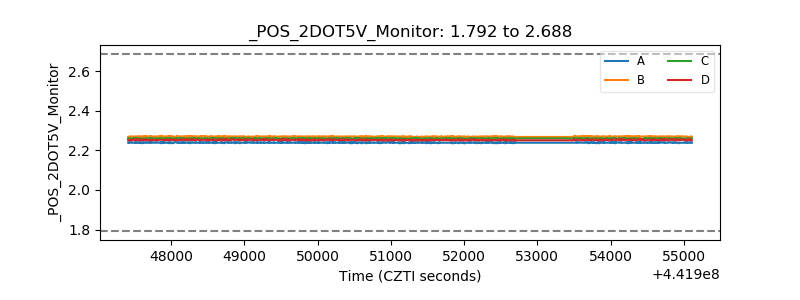 |
| +5 Volts monitor | 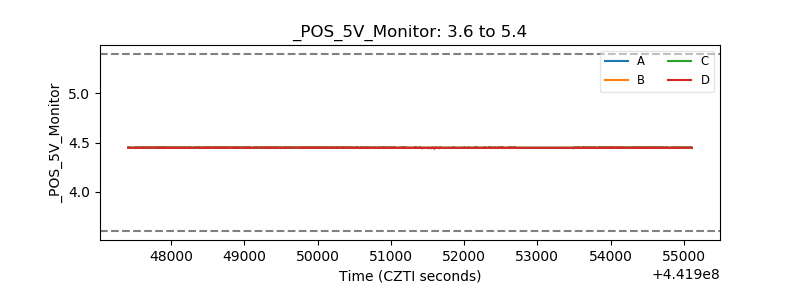 |
| _ROLL_ROT | 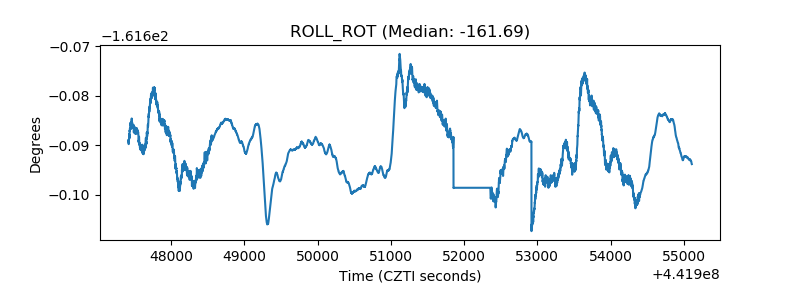 |
| _Roll_DEC | 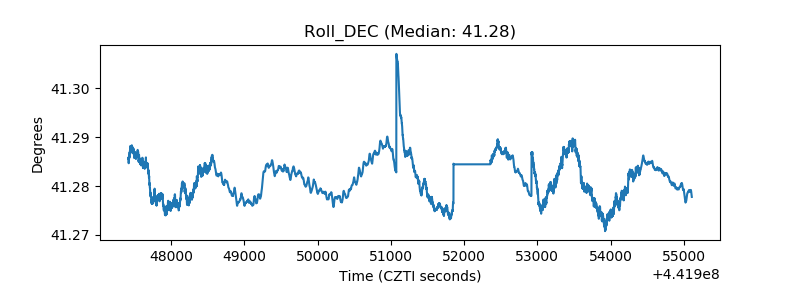 |
| _Roll_RA | 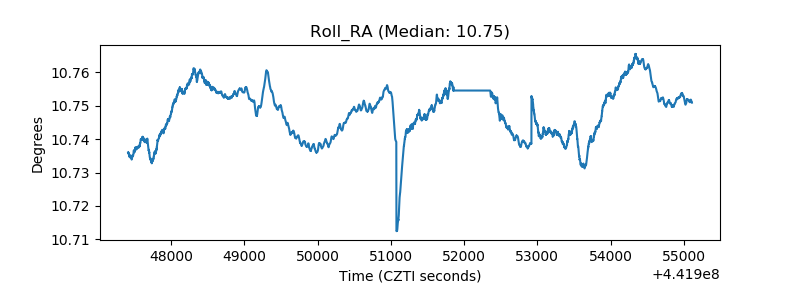 |
| Veto Counter | 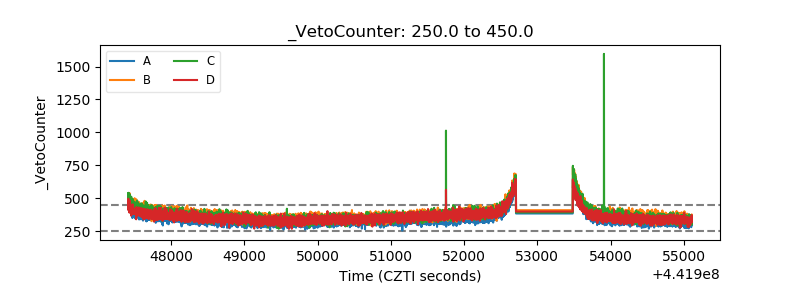 |