| Param | Original file | Final file |
|---|---|---|
| Filename | modeM0/AS1A13_073T04_9000006010_44696cztM0_level2.fits | modeM0/AS1A13_073T04_9000006010_44696cztM0_level2_quad_clean.evt |
| Size (bytes) | 547,902,720 | 60,442,560 |
| Size | 522.5 MB | 57.6 MB |
| Events in quadrant A | 4,642,198 | 464,444 |
| Events in quadrant B | 2,304,399 | 491,307 |
| Events in quadrant C | 1,905,907 | 476,369 |
| Events in quadrant D | 11,069,750 | 73,577 |
| Mode SS | |||
|---|---|---|---|
| Quadrant | BADHDUFLAG | Total packets | Discarded packets |
| A | 0 | 92 | 0 |
| B | 0 | 92 | 0 |
| C | 0 | 92 | 0 |
| D | 0 | 92 | 0 |
| Mode M0 | |||
|---|---|---|---|
| Quadrant | BADHDUFLAG | Total packets | Discarded packets |
| A | 0 | 17355 | 0 |
| B | 0 | 10128 | 0 |
| C | 0 | 9273 | 0 |
| D | 0 | 36062 | 0 |
| Quadrant | Total seconds | Saturated seconds | Saturation percentage |
|---|---|---|---|
| A | 4616 | 301 | 6.520797% |
| B | 4616 | 40 | 0.866551% |
| C | 4617 | 2 | 0.043318% |
| D | 4617 | 3974 | 86.073208% |
Noise dominated data is calculated using 1-second bins in cleaned event files. If a bin has >2000 counts, and if more than 50% of those come from <1% of pixels, then it is considered to be noise-dominated and hence unusable.
| Quadrant | # 1 sec bins | Bins with >0 counts | Bins with >2000 counts | High rate bins dominated by noise | Noise dominated (total time) | Noise dominated (detector-on time) | Marked lightcurve |
|---|---|---|---|---|---|---|---|
| A | 4616 | 4616 | 242 | 242 | 5.24% | 5.24% | 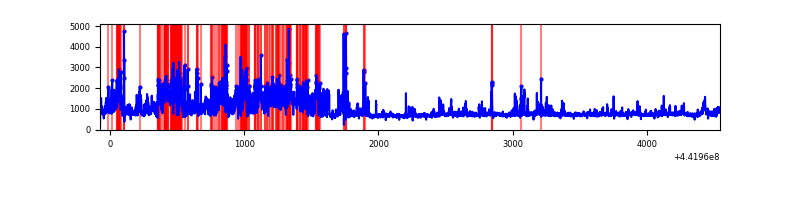 |
| B | 4616 | 4616 | 33 | 33 | 0.71% | 0.71% | 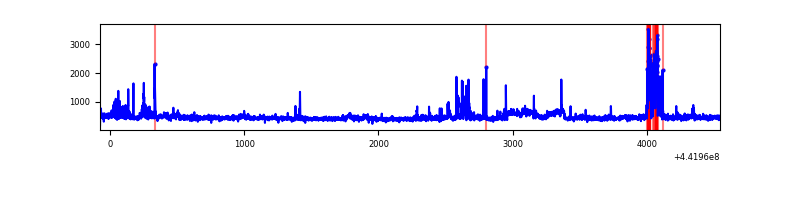 |
| C | 4617 | 4617 | 1 | 1 | 0.02% | 0.02% | 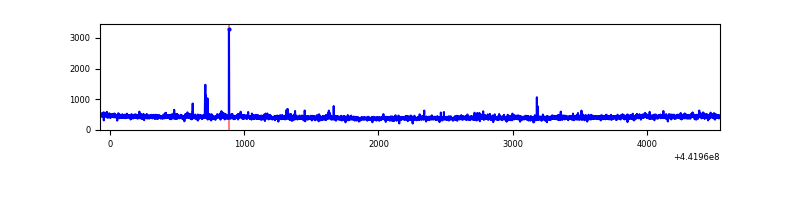 |
| D | 4617 | 4617 | 3478 | 3478 | 75.33% | 75.33% | 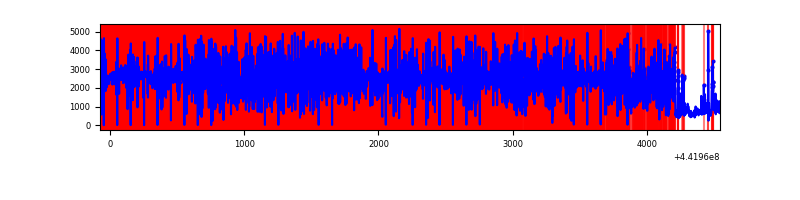 |
Top three noisy pixels from each quadrant. If the there are fewer than three noisy pixels in the level2.evt file, extra rows are filled as -1
| Pixel properties | Quadrant properties | ||||||
|---|---|---|---|---|---|---|---|
| Quadrant | DetID | PixID | Counts | Sigma | Mean | Median | Sigma |
| A | 15 | 223 | 1225508 | 12228.4 | 480 | 469 | 100.2 |
| A | 10 | 83 | 1201767 | 11991.42 | 480 | 469 | 100.2 |
| A | 10 | 248 | 345788 | 3446.99 | 480 | 469 | 100.2 |
| B | 0 | 219 | 140732 | 1451.17 | 483 | 468 | 96.7 |
| B | 0 | 190 | 120757 | 1244.51 | 483 | 468 | 96.7 |
| B | 0 | 183 | 61599 | 632.46 | 483 | 468 | 96.7 |
| C | 14 | 254 | 12575 | 107.11 | 477 | 482 | 112.9 |
| C | 3 | 233 | 10173 | 85.84 | 477 | 482 | 112.9 |
| C | 15 | 208 | 6002 | 48.89 | 477 | 482 | 112.9 |
| D | 1 | 52 | 9184596 | 180742.86 | 193 | 187 | 50.8 |
| D | 11 | 241 | 574412 | 11300.35 | 193 | 187 | 50.8 |
| D | 5 | 222 | 198915 | 3910.83 | 193 | 187 | 50.8 |
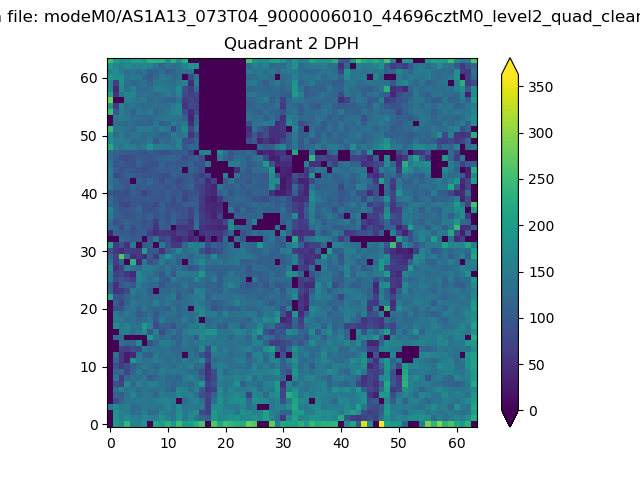
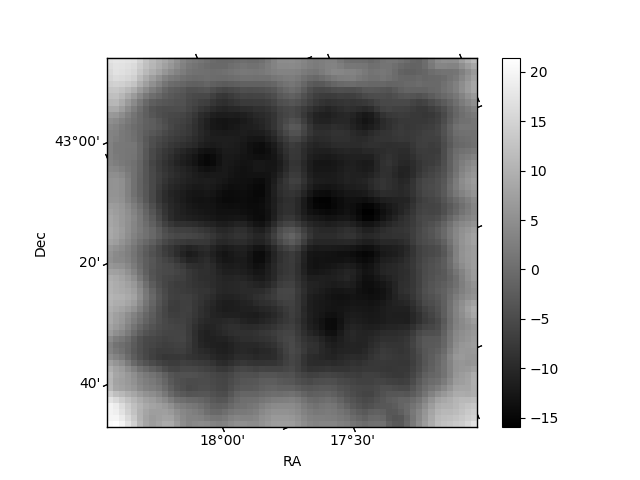
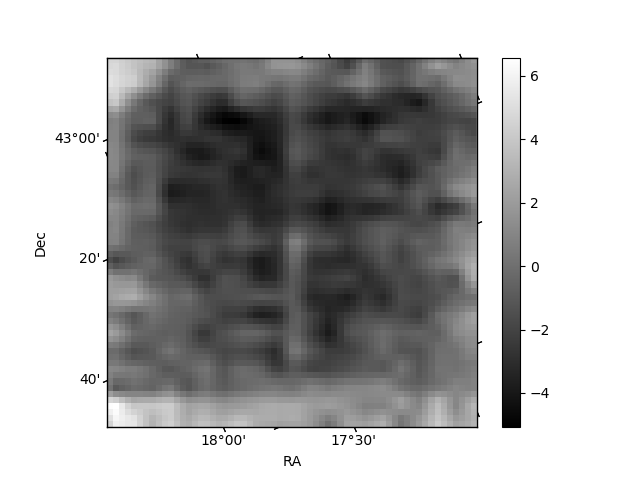
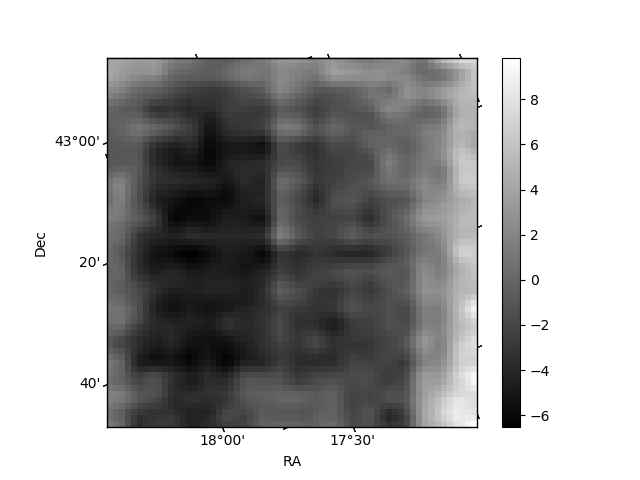
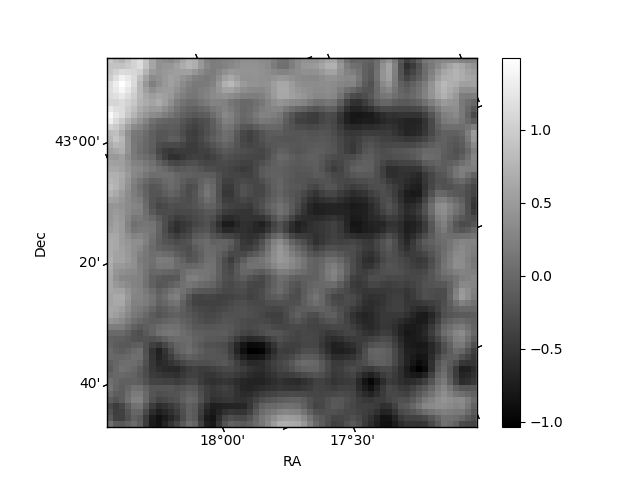
Histogram calculated using DETX and DETY for each event in the final _common_clean file
| Quadrant A | 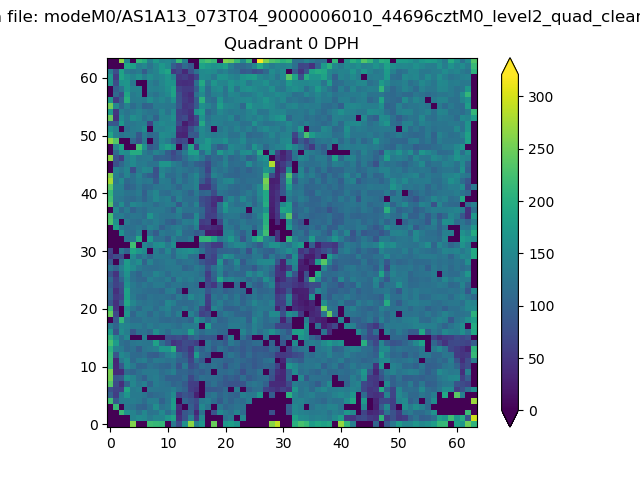 |
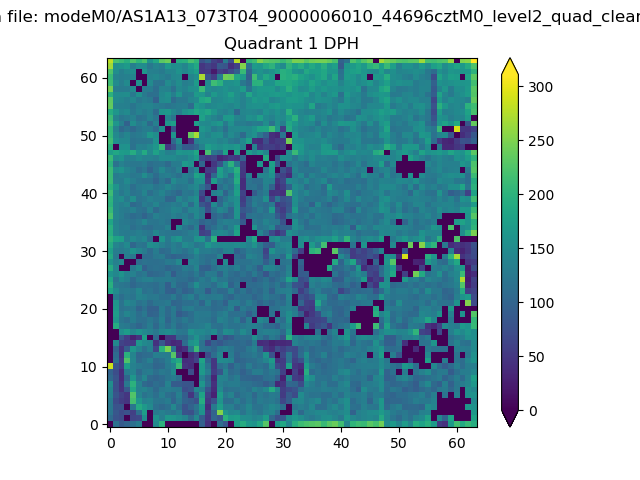 |
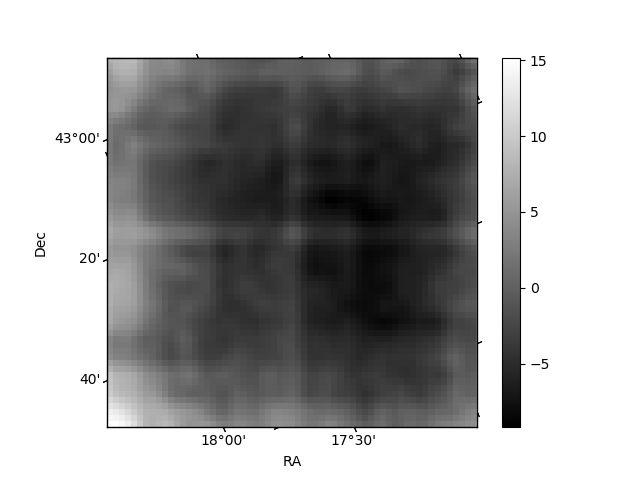
Quadrant B |
|---|---|---|---|
| Quadrant D | 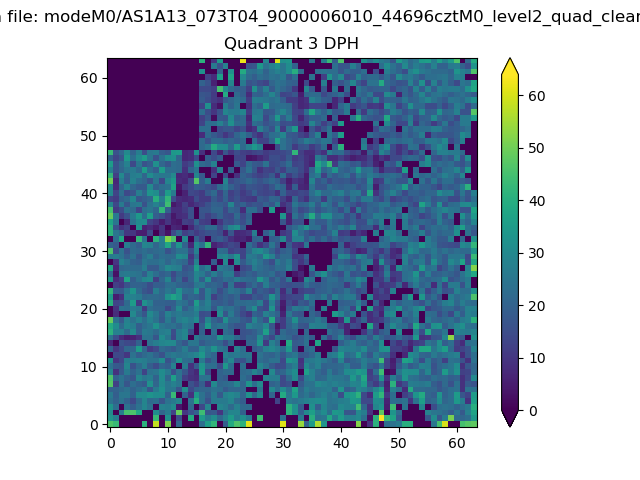 |
 |
Quadrant C |
| Plot type | Count rate plots | Images |
|---|---|---|
| Comparison with Poisson distribution Blue bars denote a histogram of data divided into 1 sec bins. Red curve is a Poisson curve with rate = median count rate of data. |
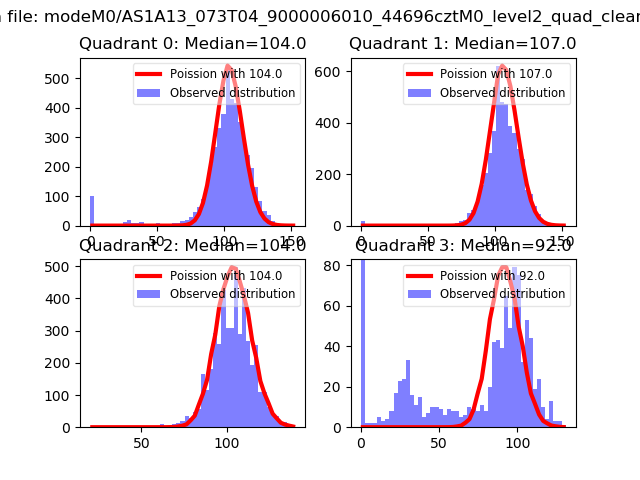 |
 |
| Quadrant-wise count rates Data is divided into 100 sec bins |
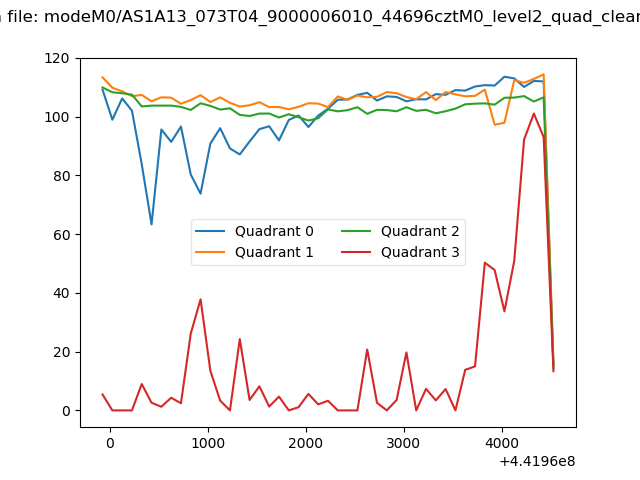 |
|
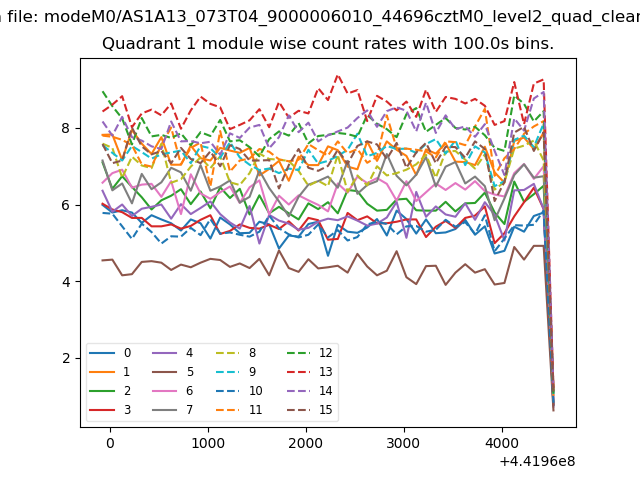
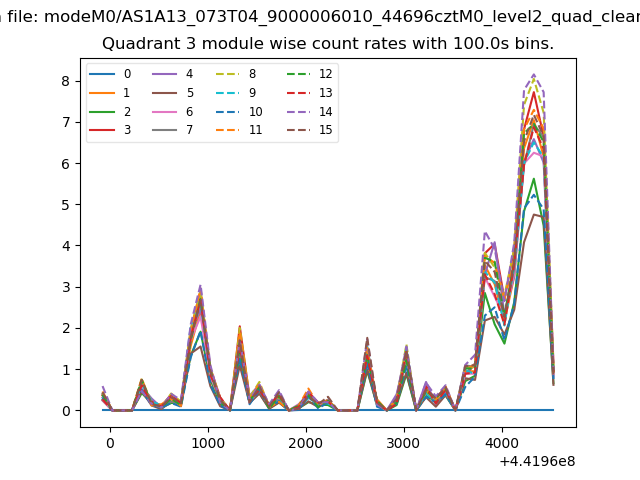
| Module-wise count rates for Quadrant A Data is divided into 100 sec bins |
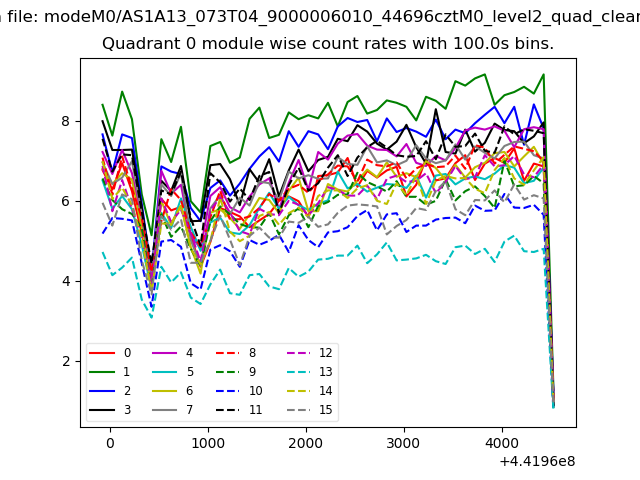 |
 |
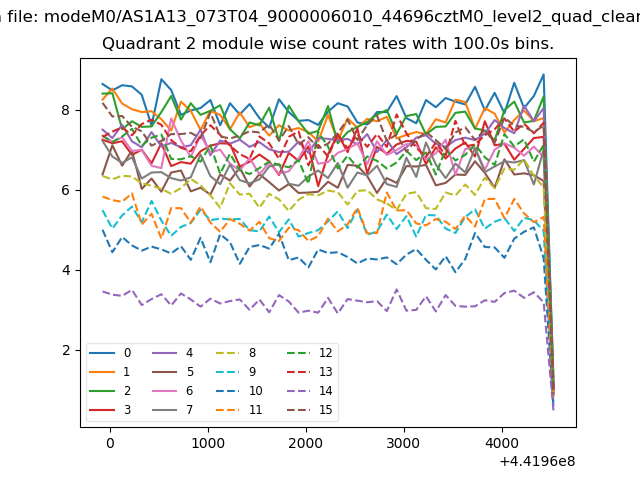
| Module-wise count rates for Quadrant B Data is divided into 100 sec bins |
 |
 |
| Module-wise count rates for Quadrant C Data is divided into 100 sec bins |
 |
 |
| Module-wise count rates for Quadrant D Data is divided into 100 sec bins |
 |
 |
| Parameter | Plot |
|---|---|
| CZT HV Monitor | 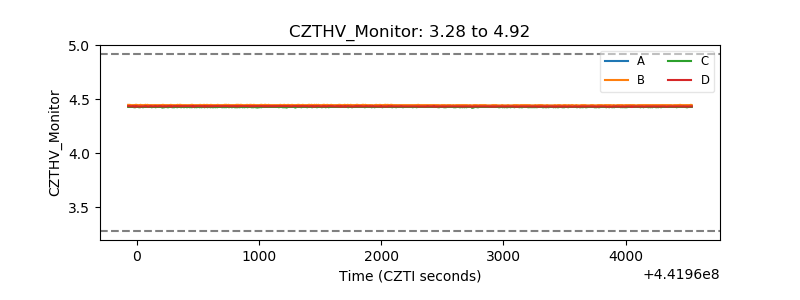 |
| D_VDD | 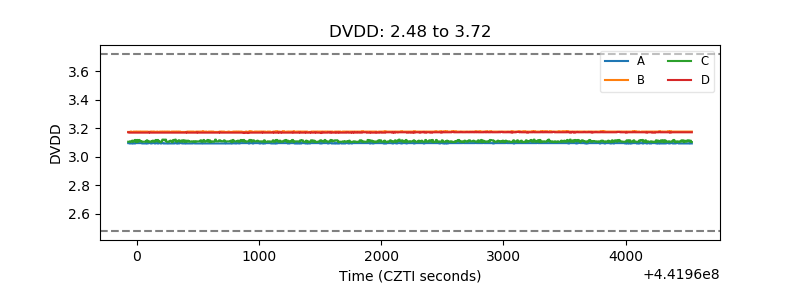 |
| Temperature 1 | 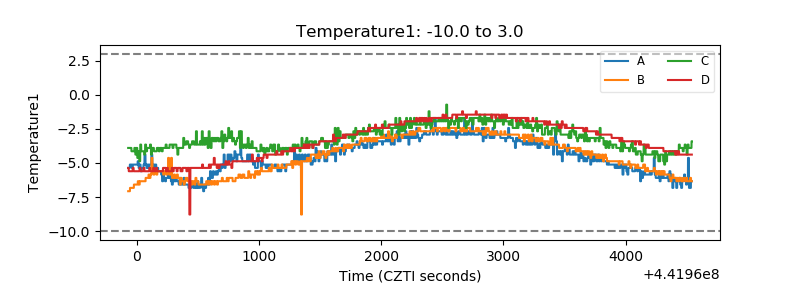 |
| Veto HV Monitor | 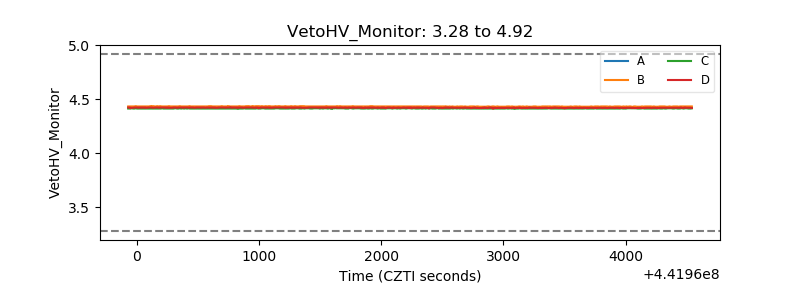 |
| Veto LLD | 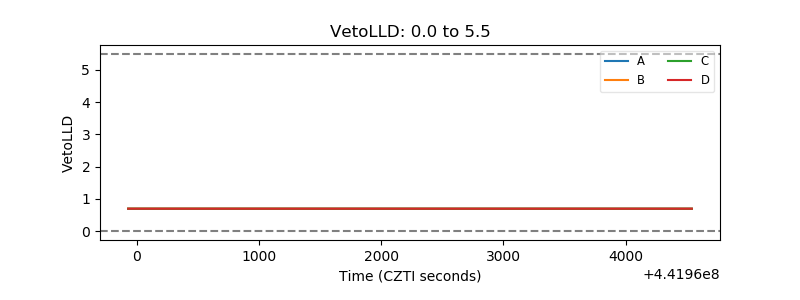 |
| Alpha Counter |  |
| _CPM_Rate | 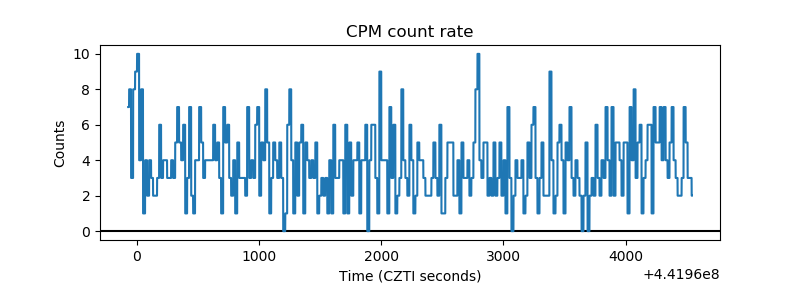 |
| CZT Counter | 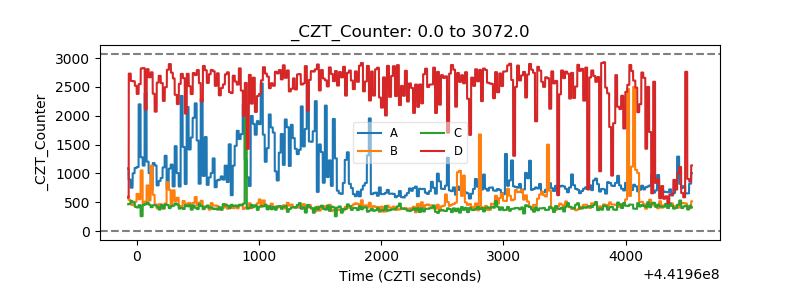 |
| +2.5 Volts monitor | 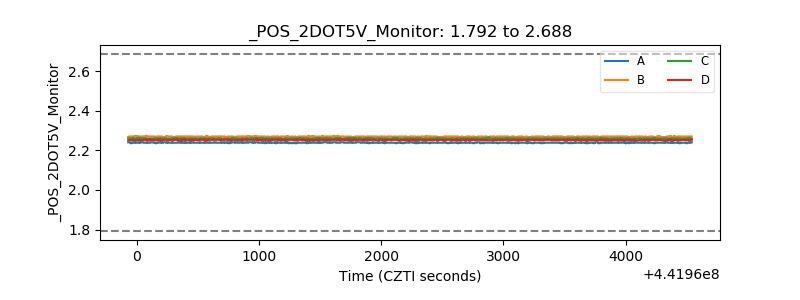 |
| +5 Volts monitor | 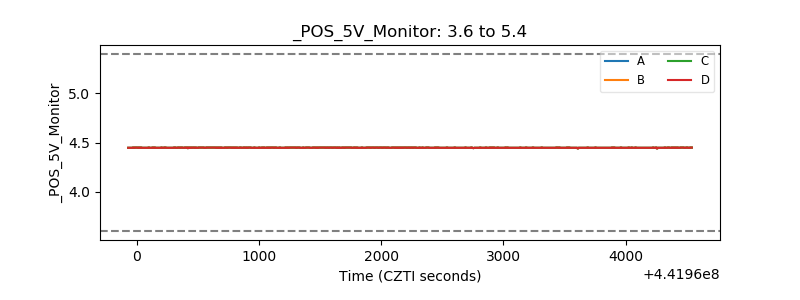 |
| _ROLL_ROT | 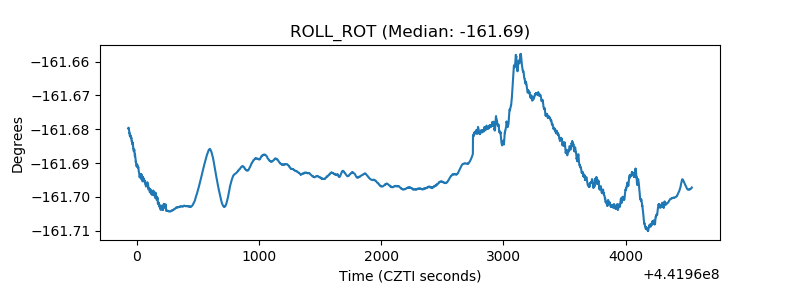 |
| _Roll_DEC | 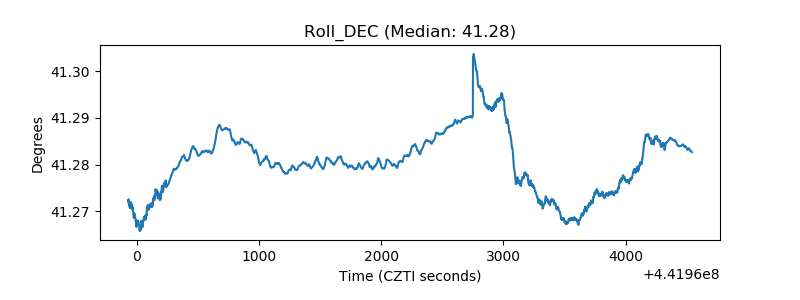 |
| _Roll_RA | 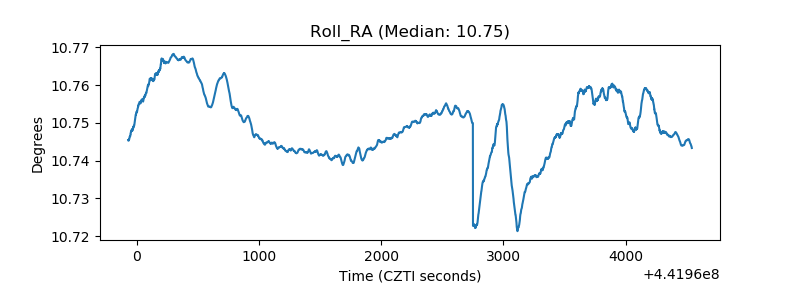 |
| Veto Counter | 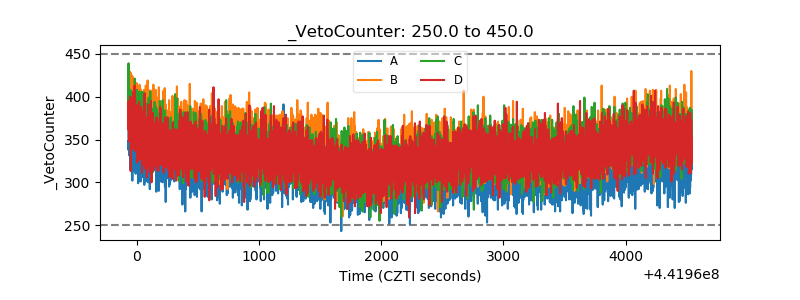 |