| Param | Original file | Final file |
|---|---|---|
| Filename | modeM0/AS1A13_077T01_9000006014_44706cztM0_level2.fits | modeM0/AS1A13_077T01_9000006014_44706cztM0_level2_quad_clean.evt |
| Size (bytes) | 565,796,160 | 114,586,560 |
| Size | 539.6 MB | 109.3 MB |
| Events in quadrant A | 5,343,838 | 788,905 |
| Events in quadrant B | 3,811,707 | 820,415 |
| Events in quadrant C | 3,112,115 | 774,156 |
| Events in quadrant D | 8,158,167 | 619,914 |
| Mode M9 | |||
|---|---|---|---|
| Quadrant | BADHDUFLAG | Total packets | Discarded packets |
| A | 0 | 14 | 0 |
| B | 0 | 15 | 0 |
| C | 0 | 15 | 0 |
| D | 0 | 15 | 0 |
| Mode M0 | |||
|---|---|---|---|
| Quadrant | BADHDUFLAG | Total packets | Discarded packets |
| A | 0 | 21354 | 2 |
| B | 0 | 15671 | 2 |
| C | 0 | 13946 | 3 |
| D | 0 | 28947 | 2 |
| Mode SS | |||
|---|---|---|---|
| Quadrant | BADHDUFLAG | Total packets | Discarded packets |
| A | 0 | 136 | 0 |
| B | 0 | 136 | 0 |
| C | 0 | 136 | 0 |
| D | 0 | 136 | 0 |
| Quadrant | Total seconds | Saturated seconds | Saturation percentage |
|---|---|---|---|
| A | 6688 | 172 | 2.571770% |
| B | 6688 | 129 | 1.928828% |
| C | 6687 | 34 | 0.508449% |
| D | 6687 | 1072 | 16.031105% |
Noise dominated data is calculated using 1-second bins in cleaned event files. If a bin has >2000 counts, and if more than 50% of those come from <1% of pixels, then it is considered to be noise-dominated and hence unusable.
| Quadrant | # 1 sec bins | Bins with >0 counts | Bins with >2000 counts | High rate bins dominated by noise | Noise dominated (total time) | Noise dominated (detector-on time) | Marked lightcurve |
|---|---|---|---|---|---|---|---|
| A | 7898 | 6689 | 16 | 16 | 0.20% | 0.24% | 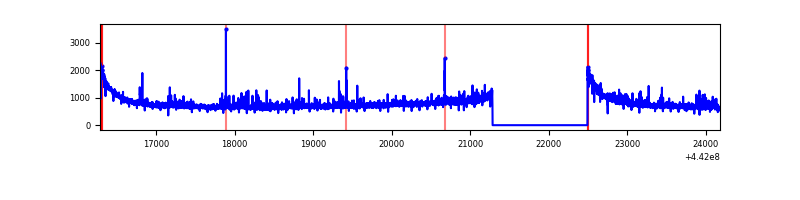 |
| B | 7898 | 6689 | 39 | 39 | 0.49% | 0.58% | 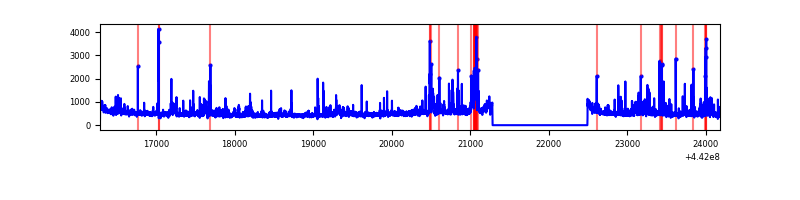 |
| C | 7897 | 6688 | 2 | 2 | 0.03% | 0.03% | 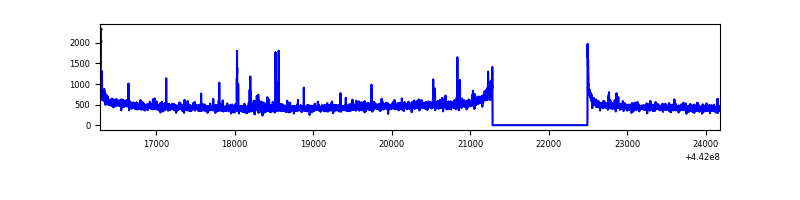 |
| D | 7897 | 6688 | 814 | 814 | 10.31% | 12.17% | 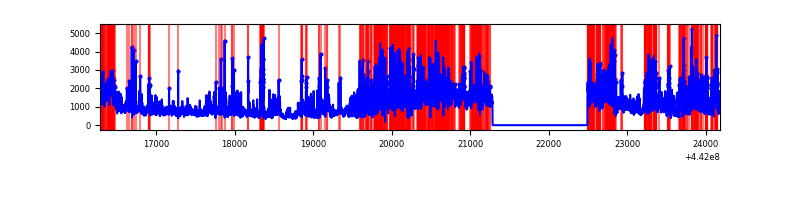 |
Top three noisy pixels from each quadrant. If the there are fewer than three noisy pixels in the level2.evt file, extra rows are filled as -1
| Pixel properties | Quadrant properties | ||||||
|---|---|---|---|---|---|---|---|
| Quadrant | DetID | PixID | Counts | Sigma | Mean | Median | Sigma |
| A | 10 | 83 | 2143845 | 13304.1 | 782 | 770 | 161.1 |
| A | 15 | 223 | 106792 | 658.18 | 782 | 770 | 161.1 |
| A | 13 | 248 | 28507 | 172.19 | 782 | 770 | 161.1 |
| B | 0 | 189 | 123641 | 805.94 | 786 | 763 | 152.5 |
| B | 0 | 190 | 102590 | 667.87 | 786 | 763 | 152.5 |
| B | 0 | 229 | 99687 | 648.83 | 786 | 763 | 152.5 |
| C | 3 | 233 | 38659 | 208.34 | 769 | 775 | 181.8 |
| C | 14 | 254 | 26263 | 140.17 | 769 | 775 | 181.8 |
| C | 12 | 2 | 24859 | 132.45 | 769 | 775 | 181.8 |
| D | 11 | 241 | 1805052 | 9982.13 | 718 | 697 | 180.8 |
| D | 1 | 52 | 1001183 | 5534.93 | 718 | 697 | 180.8 |
| D | 13 | 249 | 919822 | 5084.82 | 718 | 697 | 180.8 |
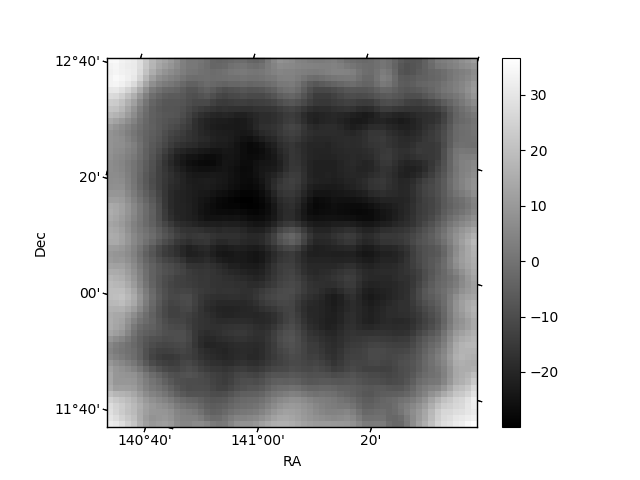
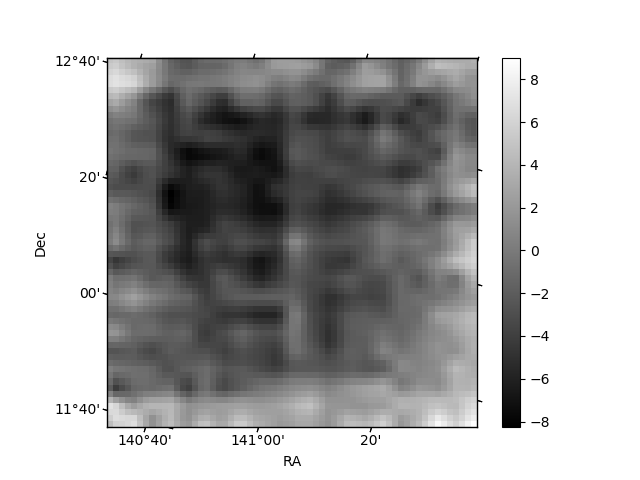
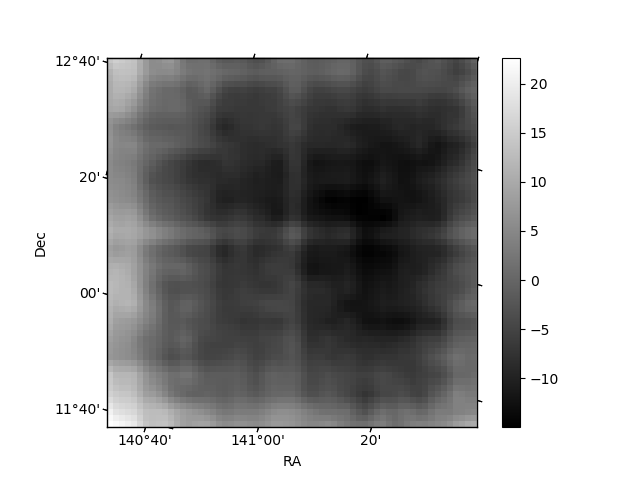
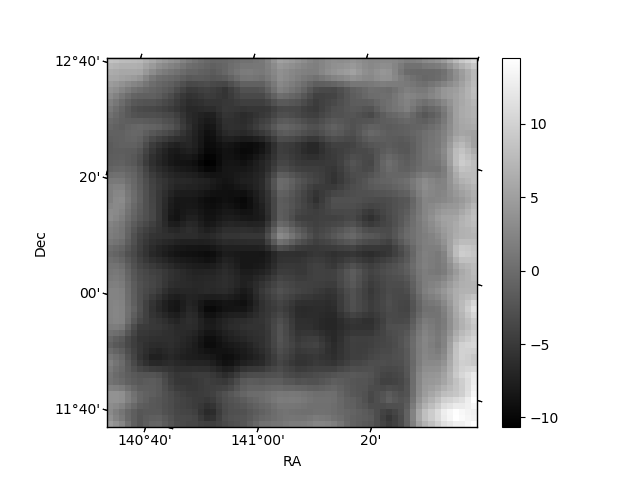
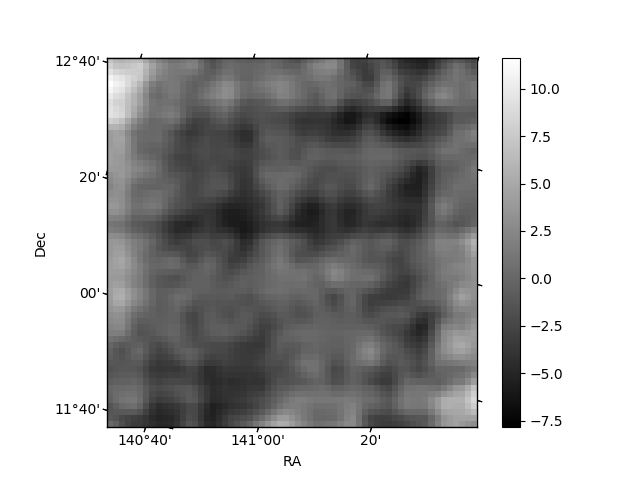
Histogram calculated using DETX and DETY for each event in the final _common_clean file
| Quadrant A | 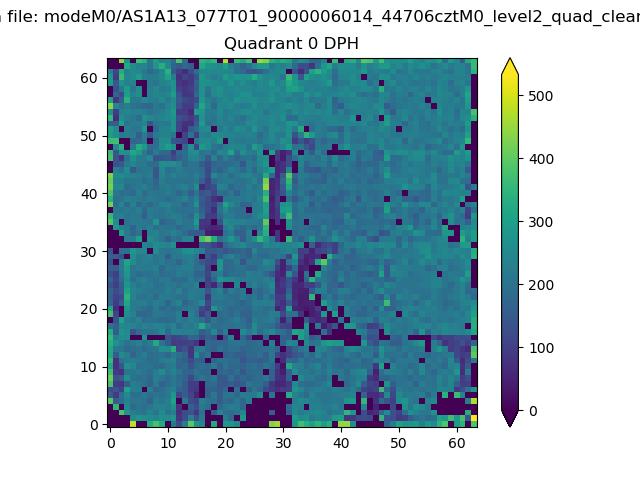 |
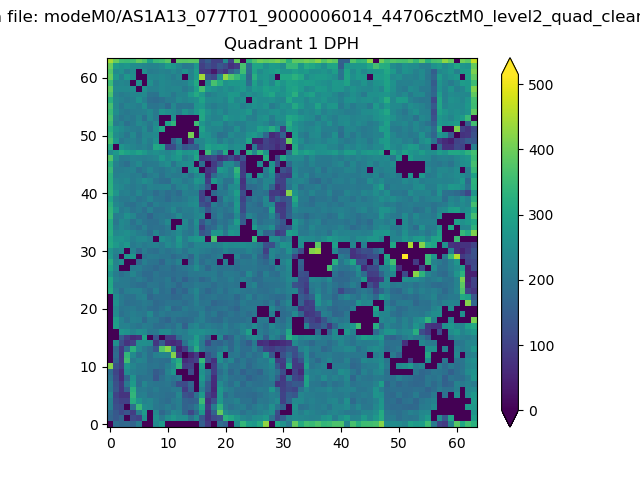 |
Quadrant B |
|---|---|---|---|
| Quadrant D | 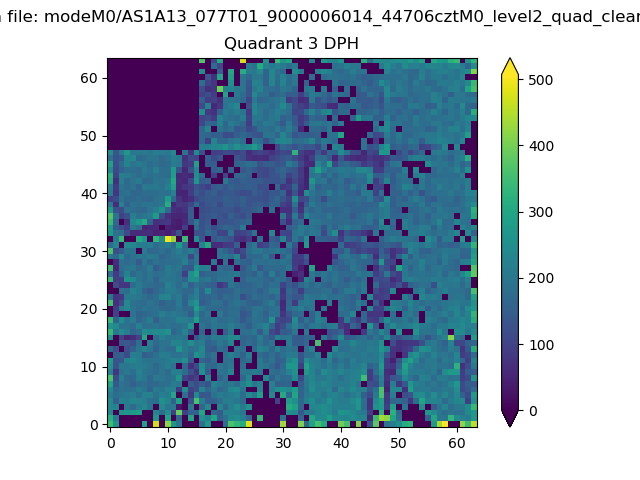 |
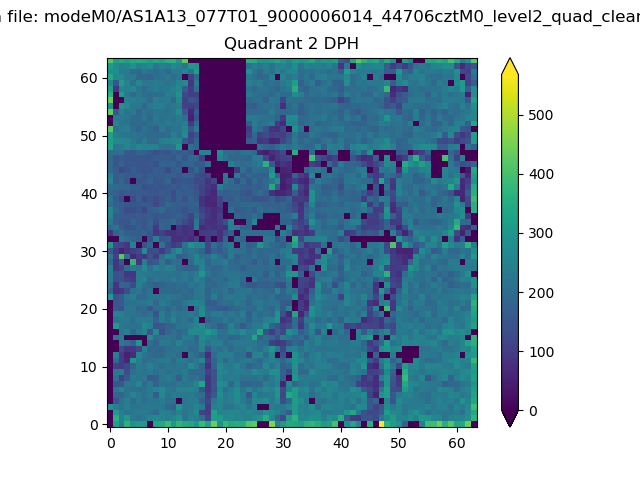 |
Quadrant C |
| Plot type | Count rate plots | Images |
|---|---|---|
| Comparison with Poisson distribution Blue bars denote a histogram of data divided into 1 sec bins. Red curve is a Poisson curve with rate = median count rate of data. |
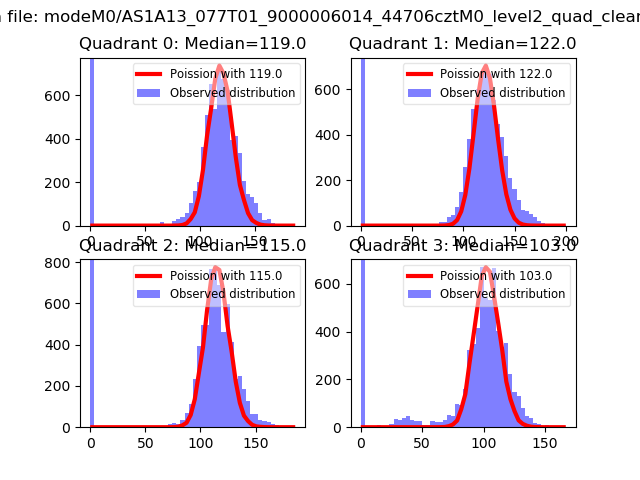 |
 |
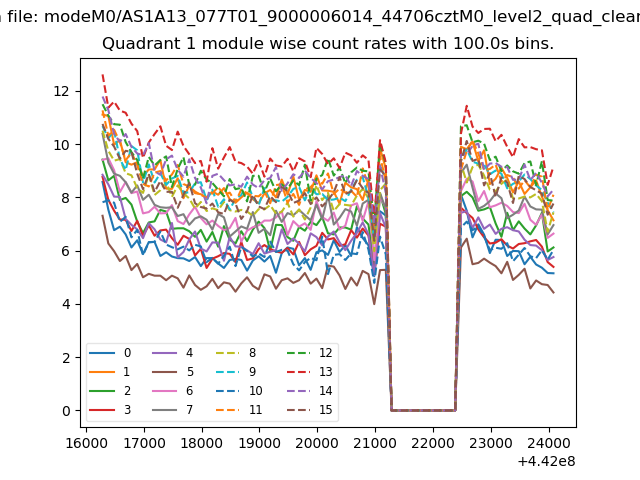
| Quadrant-wise count rates Data is divided into 100 sec bins |
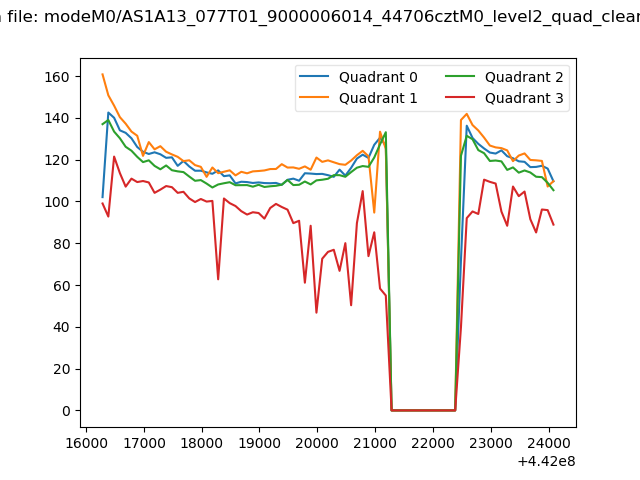 |
|
| Module-wise count rates for Quadrant A Data is divided into 100 sec bins |
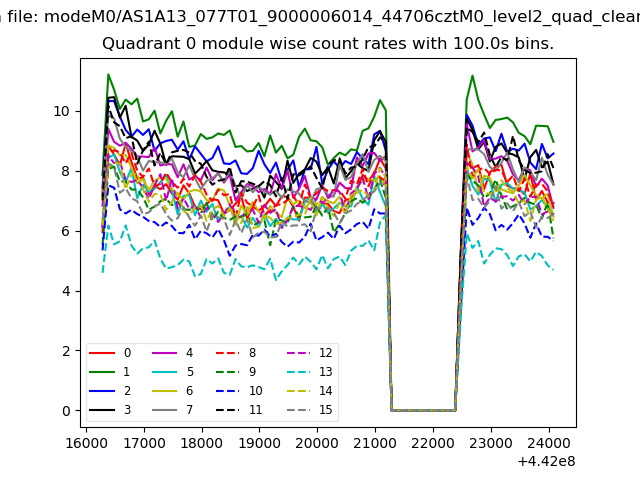 |
 |
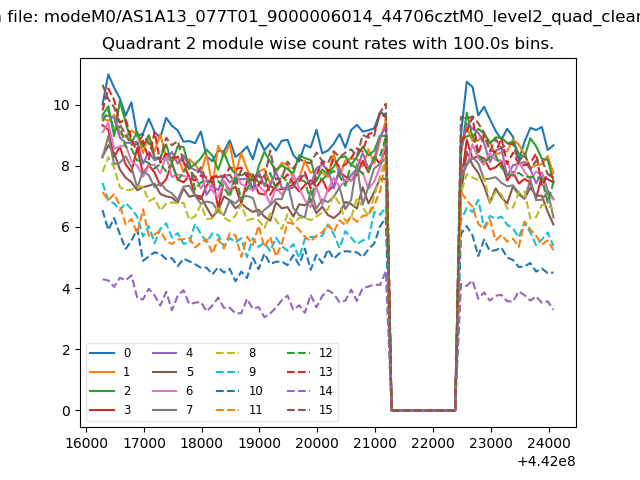
| Module-wise count rates for Quadrant B Data is divided into 100 sec bins |
 |
 |
| Module-wise count rates for Quadrant C Data is divided into 100 sec bins |
 |
 |
| Module-wise count rates for Quadrant D Data is divided into 100 sec bins |
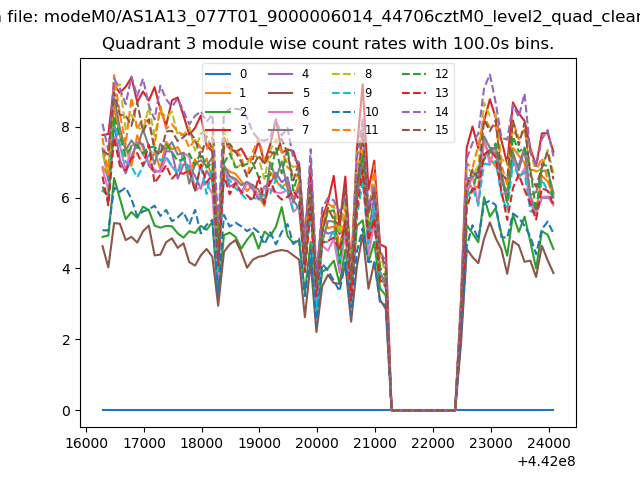 |
 |
| Parameter | Plot |
|---|---|
| CZT HV Monitor | 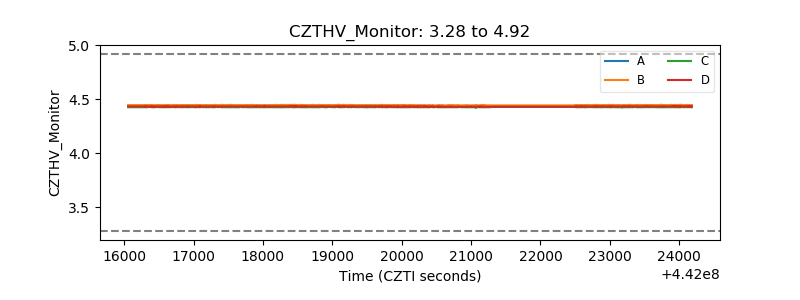 |
| D_VDD | 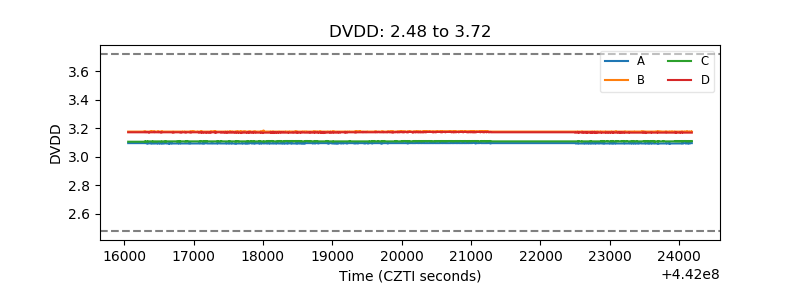 |
| Temperature 1 | 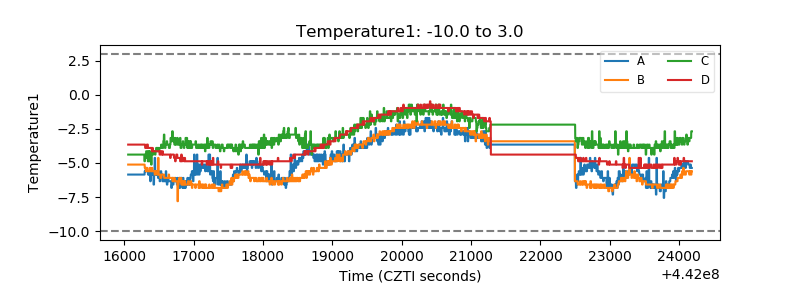 |
| Veto HV Monitor |  |
| Veto LLD | 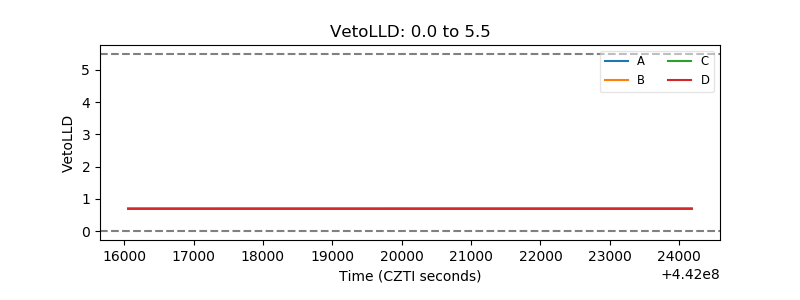 |
| Alpha Counter | 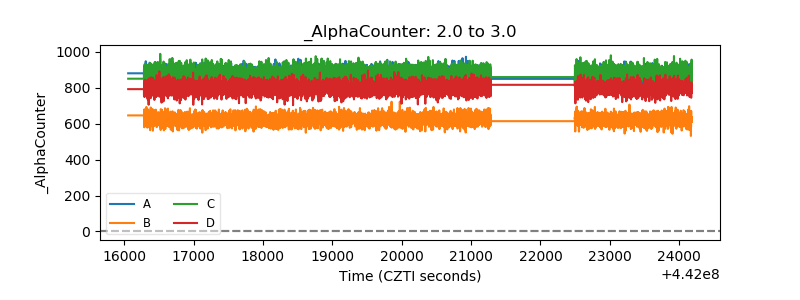 |
| _CPM_Rate | 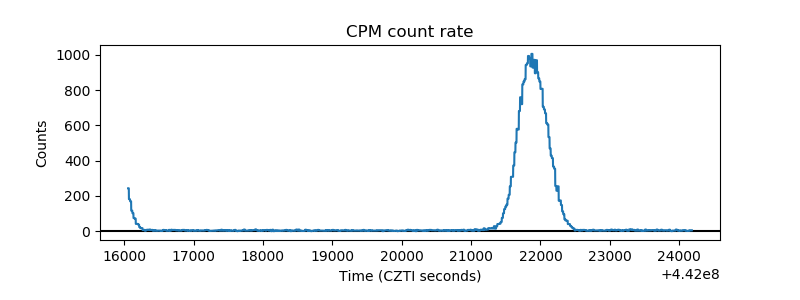 |
| CZT Counter | 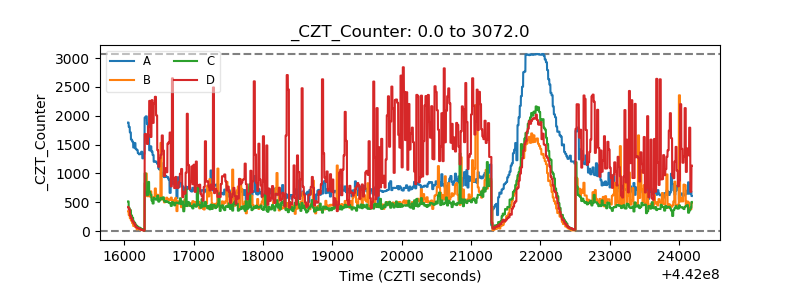 |
| +2.5 Volts monitor | 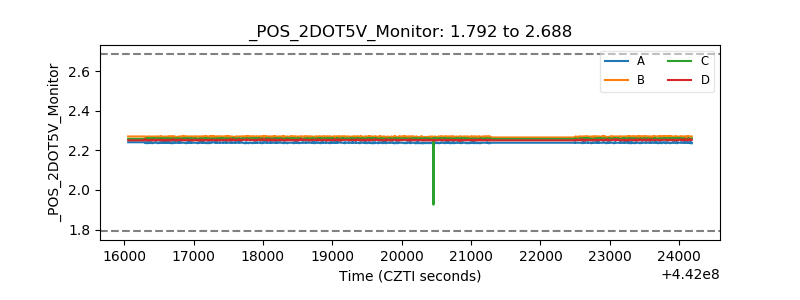 |
| +5 Volts monitor | 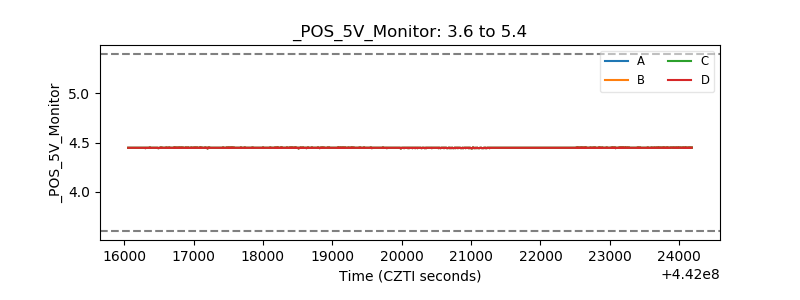 |
| _ROLL_ROT | 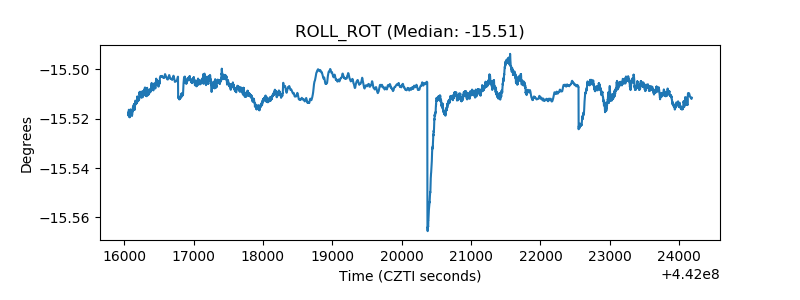 |
| _Roll_DEC | 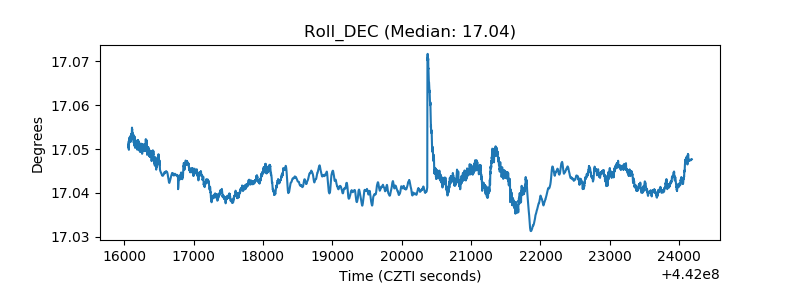 |
| _Roll_RA | 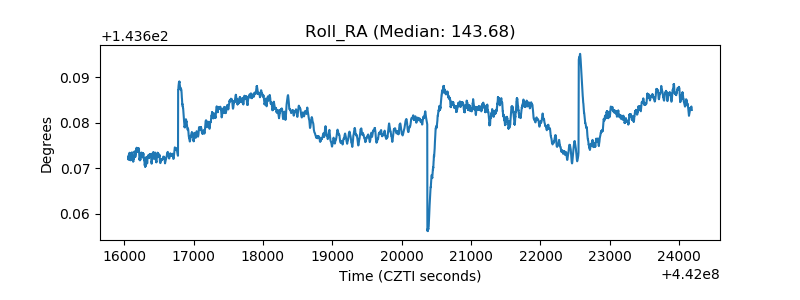 |
| Veto Counter | 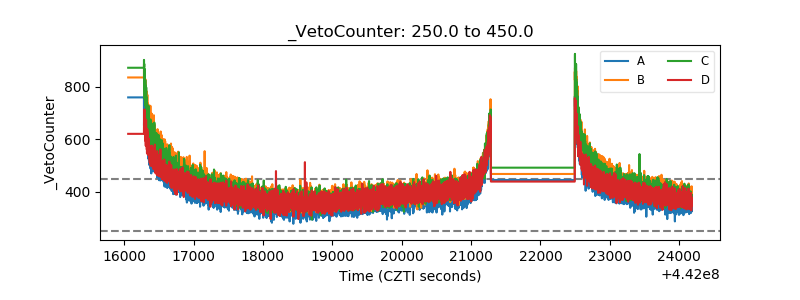 |