| Param | Original file | Final file |
|---|---|---|
| Filename | modeM0/AS1A13_077T01_9000006014_44707cztM0_level2.fits | modeM0/AS1A13_077T01_9000006014_44707cztM0_level2_quad_clean.evt |
| Size (bytes) | 622,425,600 | 110,989,440 |
| Size | 593.6 MB | 105.8 MB |
| Events in quadrant A | 5,236,855 | 777,478 |
| Events in quadrant B | 4,440,650 | 794,256 |
| Events in quadrant C | 3,077,724 | 765,485 |
| Events in quadrant D | 9,760,717 | 551,440 |
| Mode M9 | |||
|---|---|---|---|
| Quadrant | BADHDUFLAG | Total packets | Discarded packets |
| A | 0 | 13 | 0 |
| B | 0 | 14 | 0 |
| C | 0 | 14 | 0 |
| D | 0 | 14 | 0 |
| Mode M0 | |||
|---|---|---|---|
| Quadrant | BADHDUFLAG | Total packets | Discarded packets |
| A | 0 | 21199 | 2 |
| B | 0 | 17819 | 2 |
| C | 0 | 14041 | 2 |
| D | 0 | 33731 | 2 |
| Mode SS | |||
|---|---|---|---|
| Quadrant | BADHDUFLAG | Total packets | Discarded packets |
| A | 0 | 138 | 0 |
| B | 0 | 138 | 0 |
| C | 0 | 138 | 0 |
| D | 0 | 138 | 0 |
| Quadrant | Total seconds | Saturated seconds | Saturation percentage |
|---|---|---|---|
| A | 6771 | 193 | 2.850391% |
| B | 6771 | 290 | 4.282971% |
| C | 6771 | 35 | 0.516910% |
| D | 6771 | 1674 | 24.723084% |
Noise dominated data is calculated using 1-second bins in cleaned event files. If a bin has >2000 counts, and if more than 50% of those come from <1% of pixels, then it is considered to be noise-dominated and hence unusable.
| Quadrant | # 1 sec bins | Bins with >0 counts | Bins with >2000 counts | High rate bins dominated by noise | Noise dominated (total time) | Noise dominated (detector-on time) | Marked lightcurve |
|---|---|---|---|---|---|---|---|
| A | 7896 | 6772 | 10 | 10 | 0.13% | 0.15% | 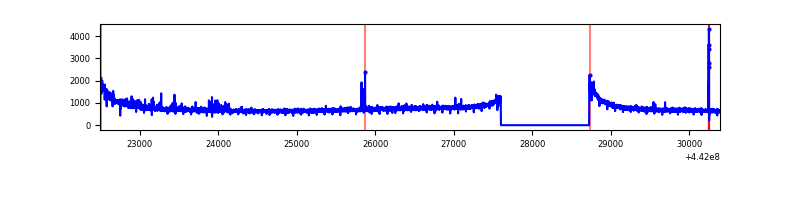 |
| B | 7896 | 6772 | 110 | 110 | 1.39% | 1.62% | 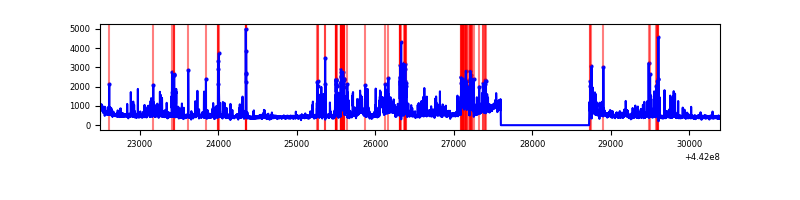 |
| C | 7896 | 6772 | 2 | 2 | 0.03% | 0.03% | 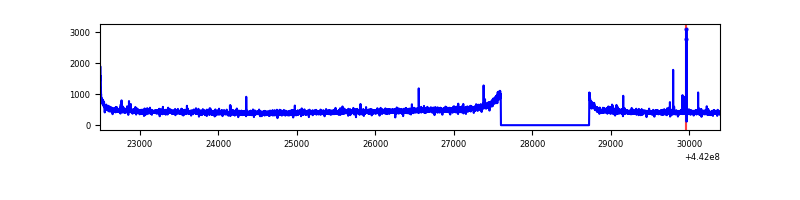 |
| D | 7896 | 6772 | 1433 | 1433 | 18.15% | 21.16% | 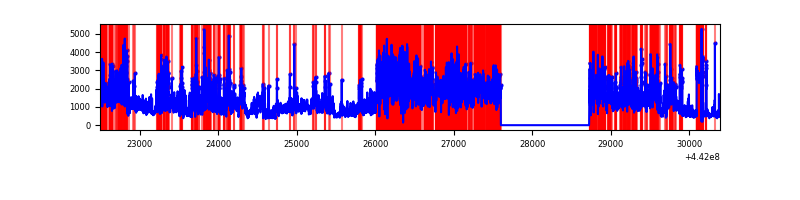 |
Top three noisy pixels from each quadrant. If the there are fewer than three noisy pixels in the level2.evt file, extra rows are filled as -1
| Pixel properties | Quadrant properties | ||||||
|---|---|---|---|---|---|---|---|
| Quadrant | DetID | PixID | Counts | Sigma | Mean | Median | Sigma |
| A | 10 | 83 | 2092850 | 12747.44 | 787 | 773 | 164.1 |
| A | 15 | 223 | 51277 | 307.73 | 787 | 773 | 164.1 |
| A | 13 | 31 | 19973 | 116.99 | 787 | 773 | 164.1 |
| B | 5 | 255 | 764493 | 4915.84 | 786 | 763 | 155.4 |
| B | 5 | 172 | 138799 | 888.48 | 786 | 763 | 155.4 |
| B | 0 | 189 | 136186 | 871.66 | 786 | 763 | 155.4 |
| C | 14 | 254 | 17580 | 92.25 | 774 | 781 | 182.1 |
| C | 3 | 233 | 12358 | 63.57 | 774 | 781 | 182.1 |
| C | 9 | 146 | 8938 | 44.79 | 774 | 781 | 182.1 |
| D | 1 | 52 | 3530298 | 20430.27 | 687 | 663 | 172.8 |
| D | 11 | 241 | 1931783 | 11177.73 | 687 | 663 | 172.8 |
| D | 1 | 47 | 436911 | 2525.1 | 687 | 663 | 172.8 |
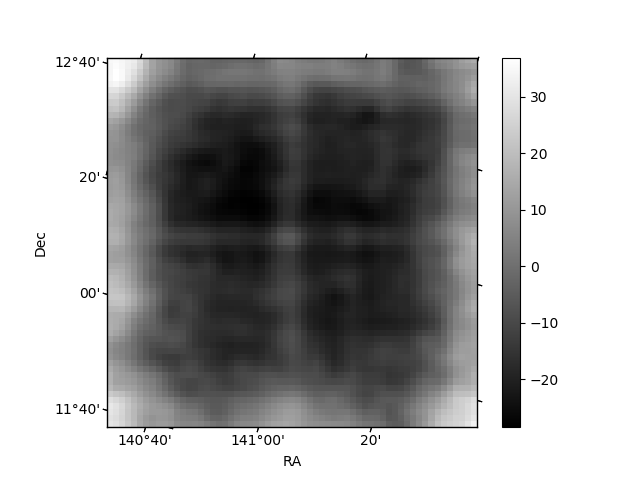
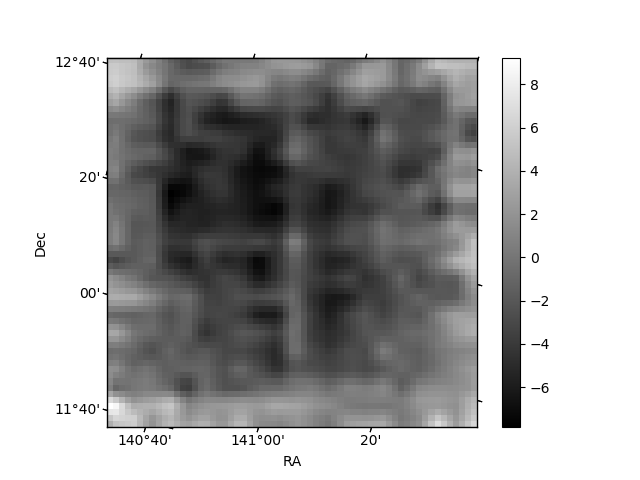
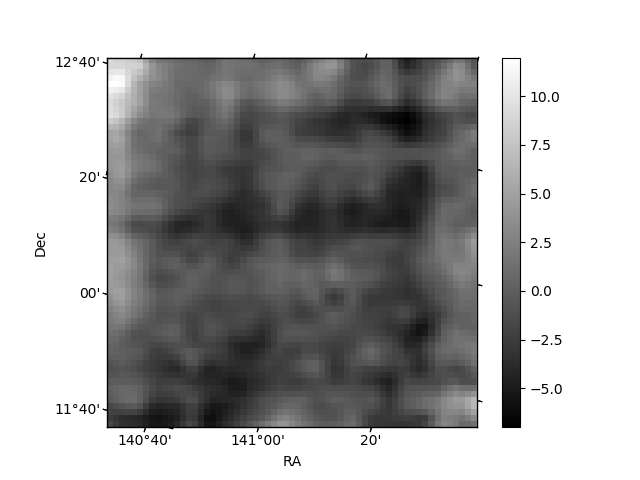
Histogram calculated using DETX and DETY for each event in the final _common_clean file
| Quadrant A | 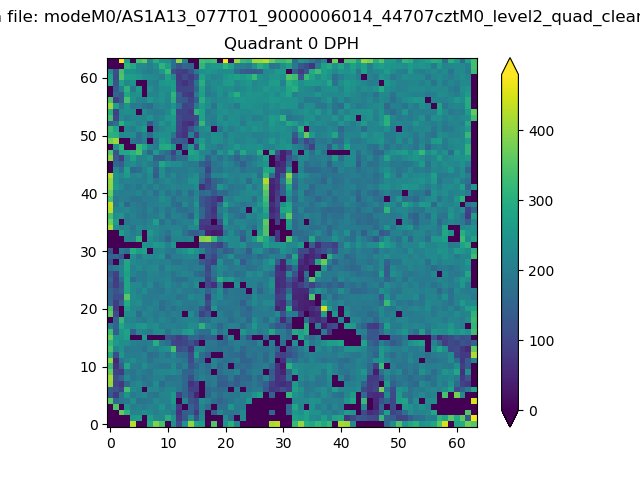 |
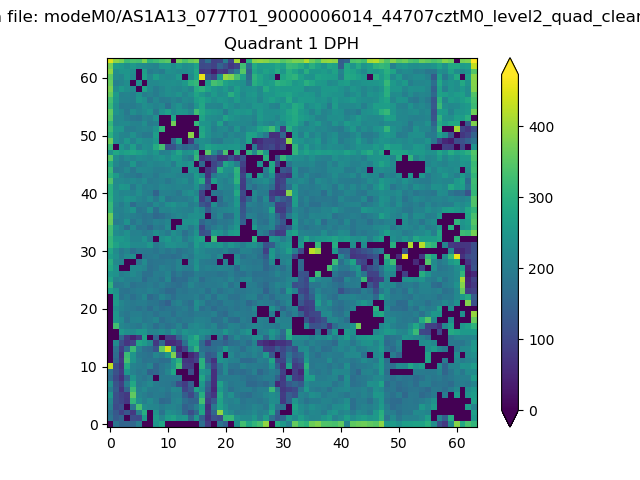 |
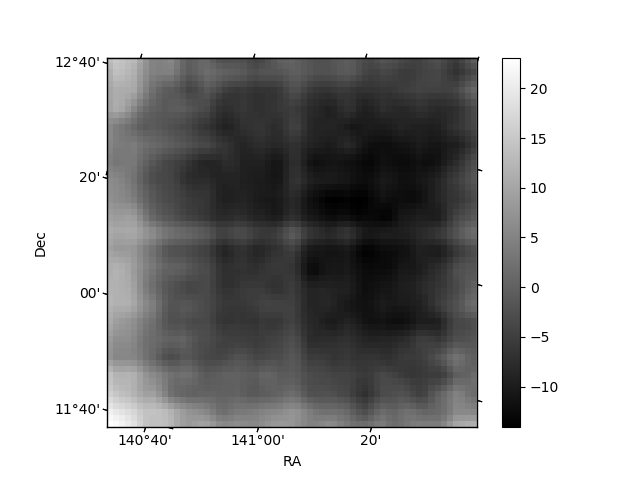
Quadrant B |
|---|---|---|---|
| Quadrant D | 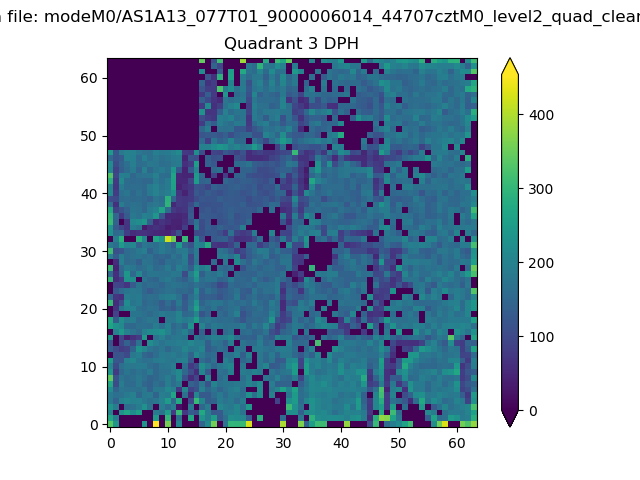 |
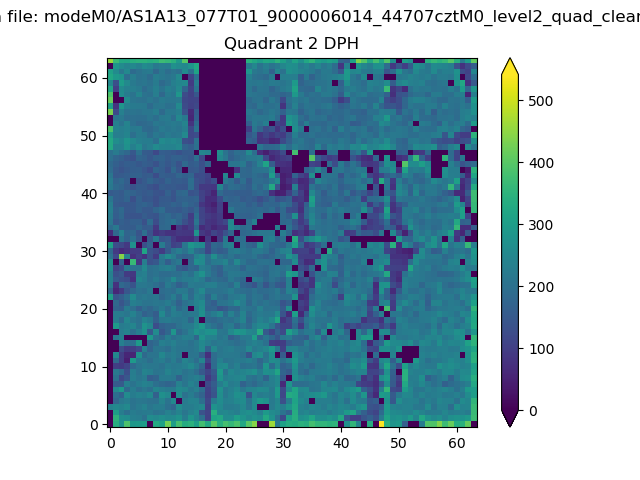 |
Quadrant C |
| Plot type | Count rate plots | Images |
|---|---|---|
| Comparison with Poisson distribution Blue bars denote a histogram of data divided into 1 sec bins. Red curve is a Poisson curve with rate = median count rate of data. |
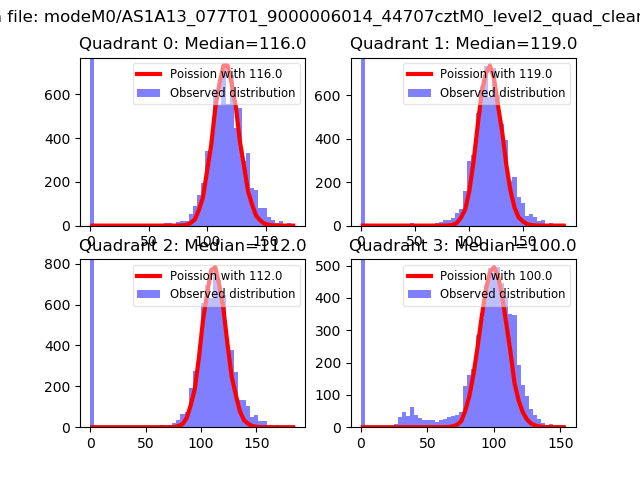 |
 |
| Quadrant-wise count rates Data is divided into 100 sec bins |
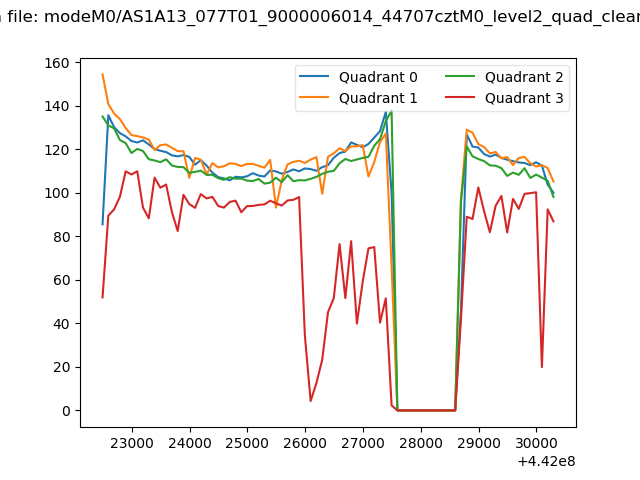 |
|
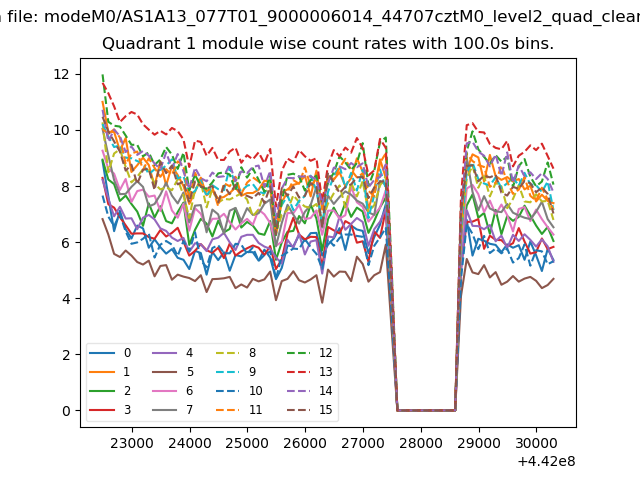
| Module-wise count rates for Quadrant A Data is divided into 100 sec bins |
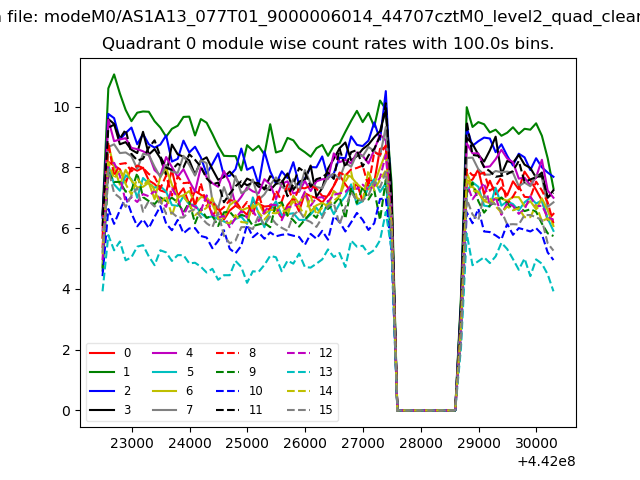 |
 |
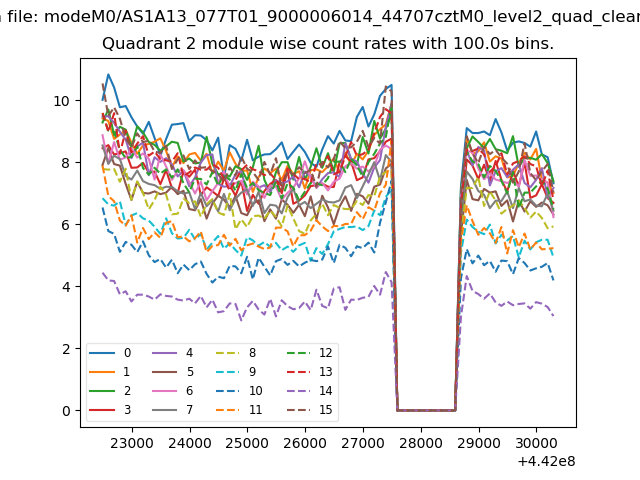
| Module-wise count rates for Quadrant B Data is divided into 100 sec bins |
 |
 |
| Module-wise count rates for Quadrant C Data is divided into 100 sec bins |
 |
 |
| Module-wise count rates for Quadrant D Data is divided into 100 sec bins |
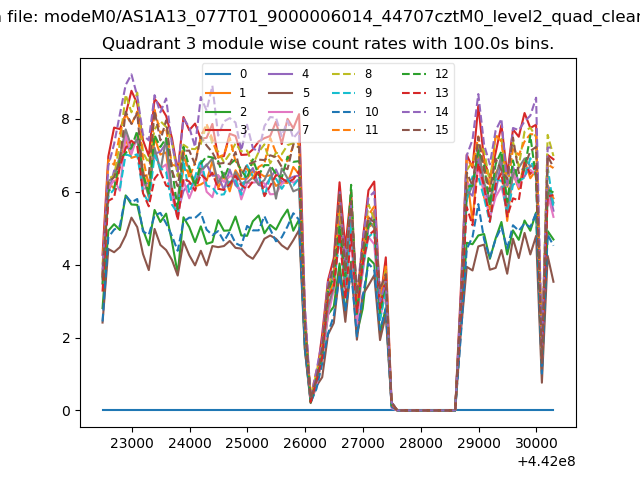 |
 |
| Parameter | Plot |
|---|---|
| CZT HV Monitor | 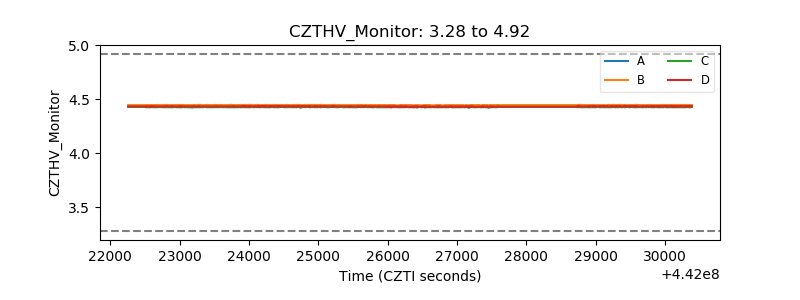 |
| D_VDD | 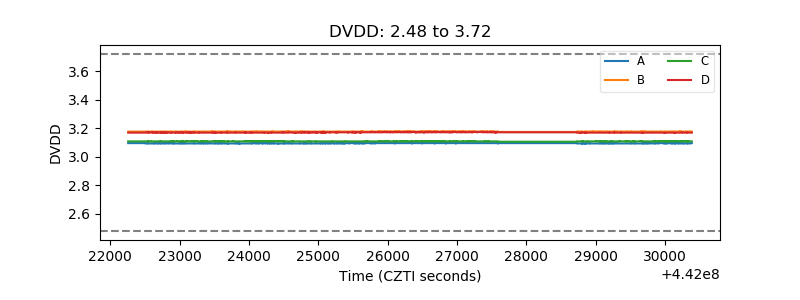 |
| Temperature 1 | 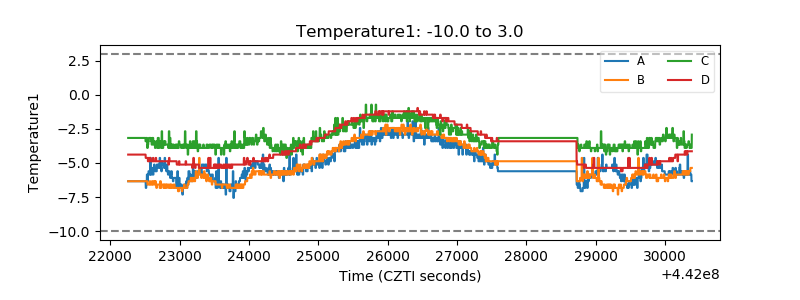 |
| Veto HV Monitor | 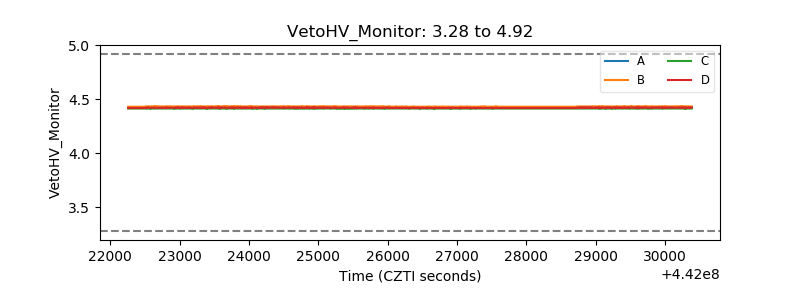 |
| Veto LLD | 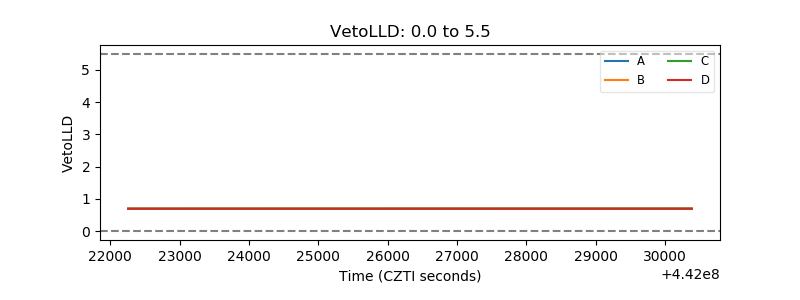 |
| Alpha Counter | 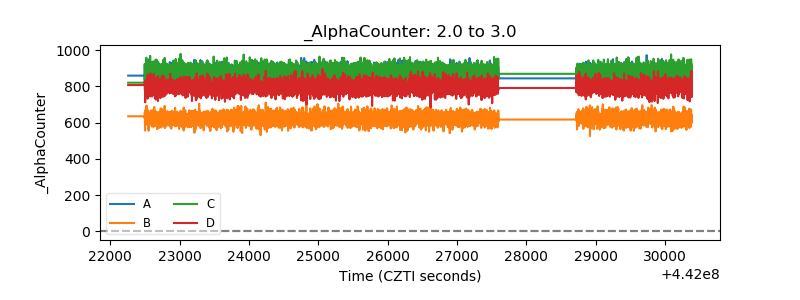 |
| _CPM_Rate | 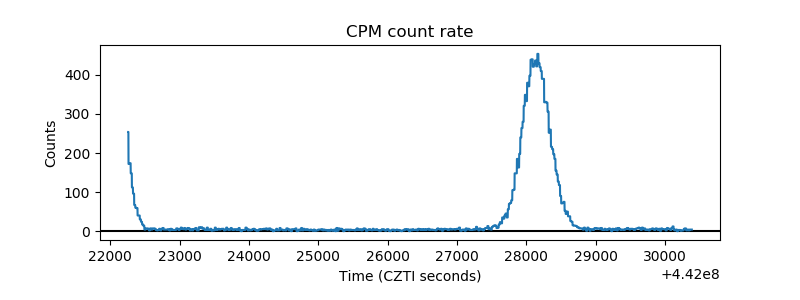 |
| CZT Counter | 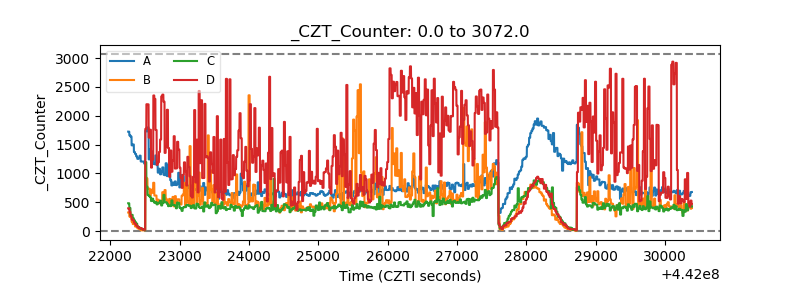 |
| +2.5 Volts monitor | 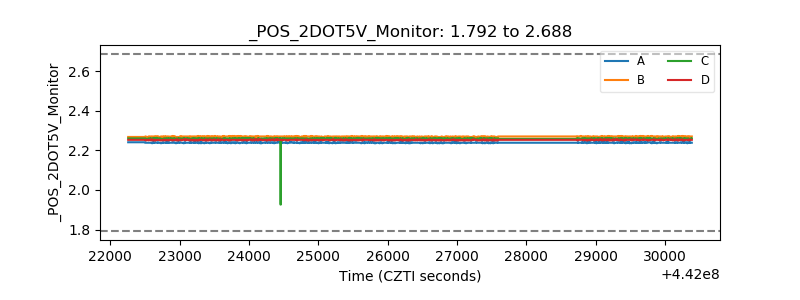 |
| +5 Volts monitor | 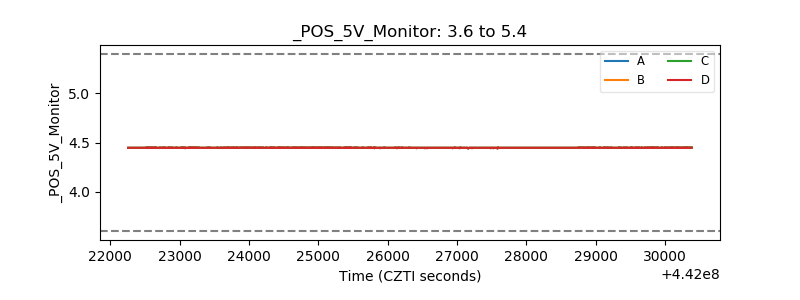 |
| _ROLL_ROT | 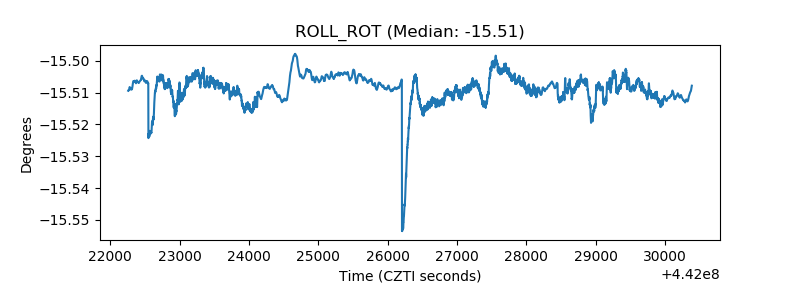 |
| _Roll_DEC | 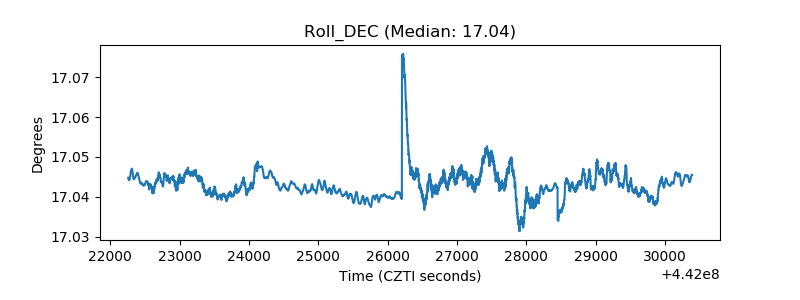 |
| _Roll_RA | 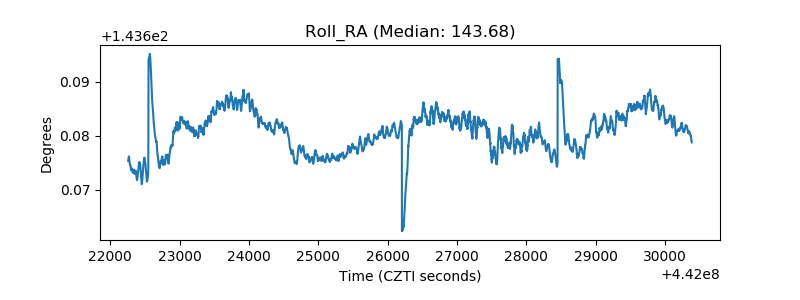 |
| Veto Counter | 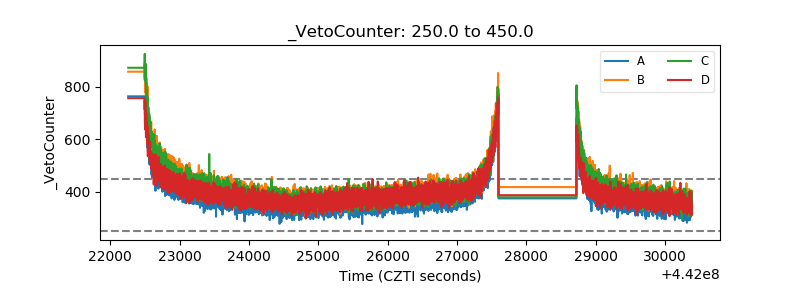 |