| Param | Original file | Final file |
|---|---|---|
| Filename | modeM0/AS1A13_077T01_9000006014_44708cztM0_level2.fits | modeM0/AS1A13_077T01_9000006014_44708cztM0_level2_quad_clean.evt |
| Size (bytes) | 553,389,120 | 112,489,920 |
| Size | 527.8 MB | 107.3 MB |
| Events in quadrant A | 5,235,649 | 758,734 |
| Events in quadrant B | 4,320,863 | 773,668 |
| Events in quadrant C | 3,103,281 | 755,910 |
| Events in quadrant D | 7,287,732 | 635,507 |
| Mode M9 | |||
|---|---|---|---|
| Quadrant | BADHDUFLAG | Total packets | Discarded packets |
| A | 0 | 12 | 0 |
| B | 0 | 13 | 0 |
| C | 0 | 13 | 0 |
| D | 0 | 13 | 0 |
| Mode M0 | |||
|---|---|---|---|
| Quadrant | BADHDUFLAG | Total packets | Discarded packets |
| A | 0 | 21432 | 2 |
| B | 0 | 17563 | 2 |
| C | 0 | 14299 | 2 |
| D | 0 | 26455 | 2 |
| Mode SS | |||
|---|---|---|---|
| Quadrant | BADHDUFLAG | Total packets | Discarded packets |
| A | 0 | 140 | 0 |
| B | 0 | 140 | 0 |
| C | 0 | 140 | 0 |
| D | 0 | 140 | 0 |
| Quadrant | Total seconds | Saturated seconds | Saturation percentage |
|---|---|---|---|
| A | 6926 | 221 | 3.190875% |
| B | 6926 | 342 | 4.937915% |
| C | 6926 | 48 | 0.693041% |
| D | 6926 | 865 | 12.489171% |
Noise dominated data is calculated using 1-second bins in cleaned event files. If a bin has >2000 counts, and if more than 50% of those come from <1% of pixels, then it is considered to be noise-dominated and hence unusable.
| Quadrant | # 1 sec bins | Bins with >0 counts | Bins with >2000 counts | High rate bins dominated by noise | Noise dominated (total time) | Noise dominated (detector-on time) | Marked lightcurve |
|---|---|---|---|---|---|---|---|
| A | 7806 | 6927 | 9 | 9 | 0.12% | 0.13% | 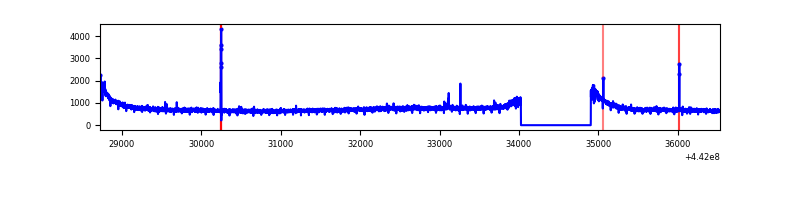 |
| B | 7806 | 6927 | 158 | 158 | 2.02% | 2.28% | 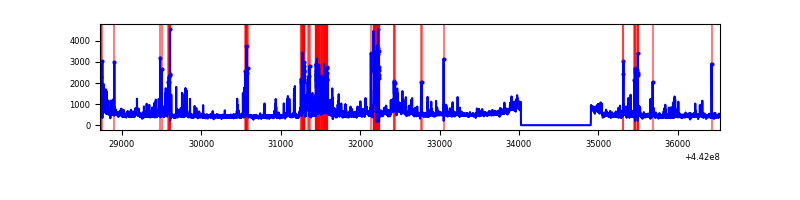 |
| C | 7806 | 6927 | 2 | 2 | 0.03% | 0.03% | 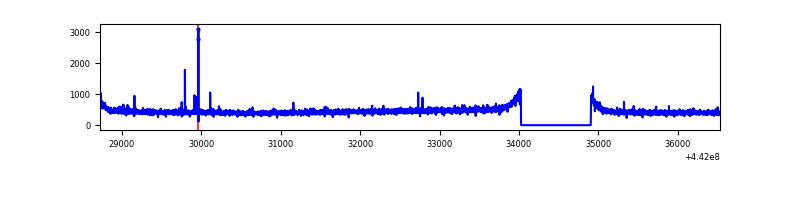 |
| D | 7806 | 6927 | 763 | 763 | 9.77% | 11.01% | 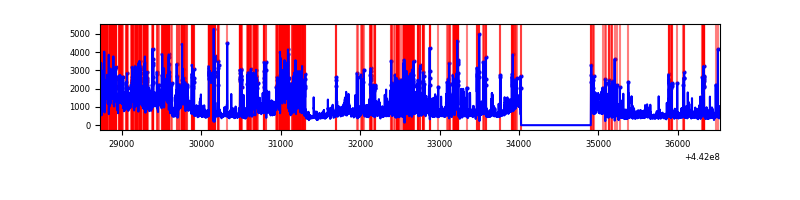 |
Top three noisy pixels from each quadrant. If the there are fewer than three noisy pixels in the level2.evt file, extra rows are filled as -1
| Pixel properties | Quadrant properties | ||||||
|---|---|---|---|---|---|---|---|
| Quadrant | DetID | PixID | Counts | Sigma | Mean | Median | Sigma |
| A | 10 | 83 | 2102541 | 12620.81 | 798 | 780 | 166.5 |
| A | 13 | 31 | 20016 | 115.51 | 798 | 780 | 166.5 |
| A | 15 | 174 | 14140 | 80.23 | 798 | 780 | 166.5 |
| B | 5 | 255 | 508634 | 3234.14 | 788 | 765 | 157.0 |
| B | 5 | 172 | 201462 | 1278.05 | 788 | 765 | 157.0 |
| B | 0 | 189 | 190058 | 1205.43 | 788 | 765 | 157.0 |
| C | 14 | 254 | 18520 | 95.47 | 785 | 790 | 185.7 |
| C | 0 | 207 | 10138 | 50.33 | 785 | 790 | 185.7 |
| C | 3 | 233 | 9359 | 46.14 | 785 | 790 | 185.7 |
| D | 1 | 52 | 2102242 | 11168.06 | 748 | 724 | 188.2 |
| D | 11 | 241 | 866135 | 4599.04 | 748 | 724 | 188.2 |
| D | 3 | 13 | 362176 | 1920.86 | 748 | 724 | 188.2 |
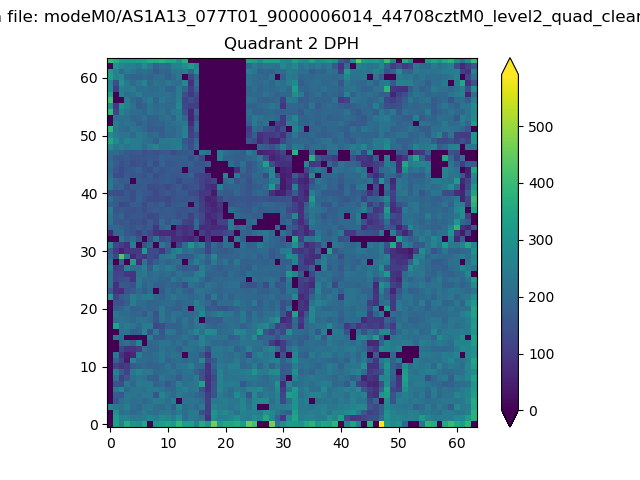
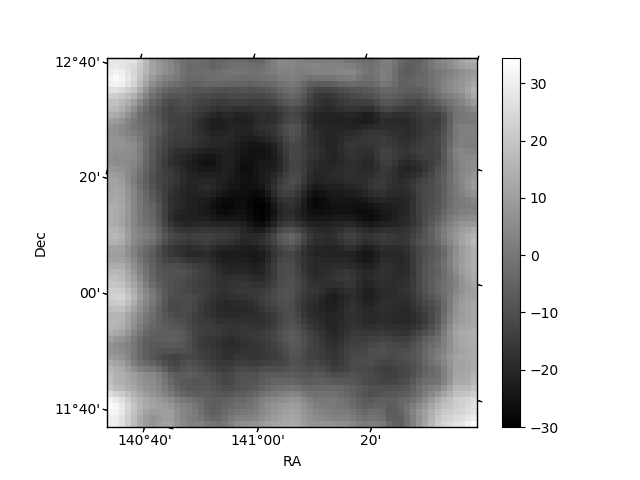
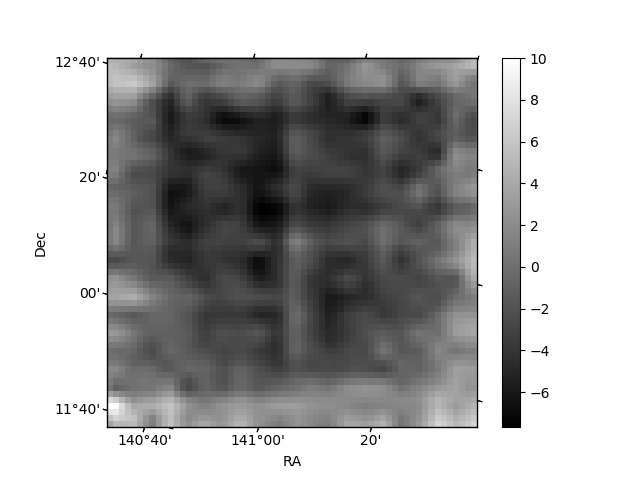
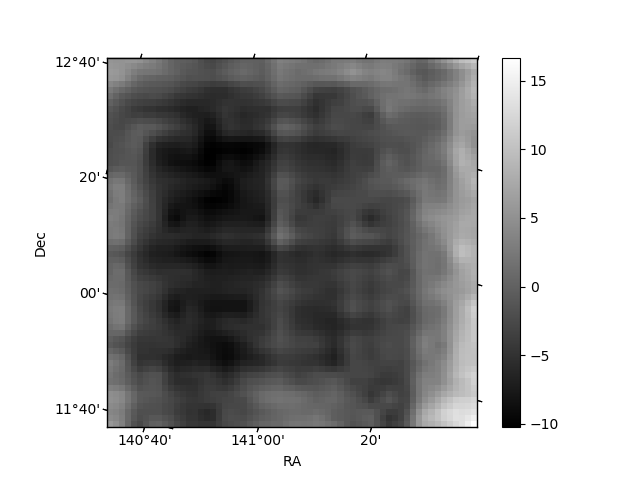
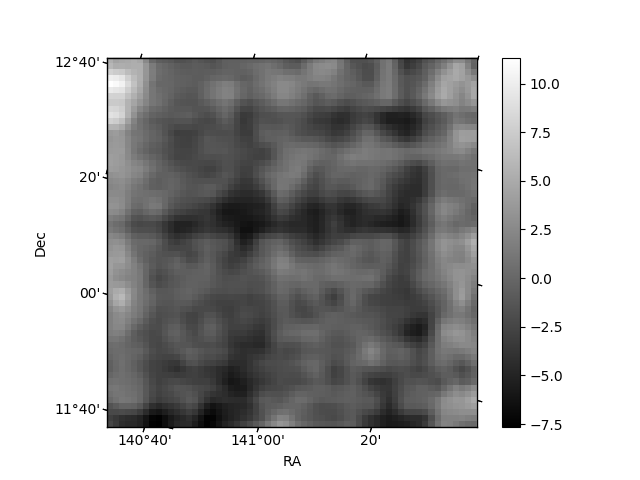
Histogram calculated using DETX and DETY for each event in the final _common_clean file
| Quadrant A | 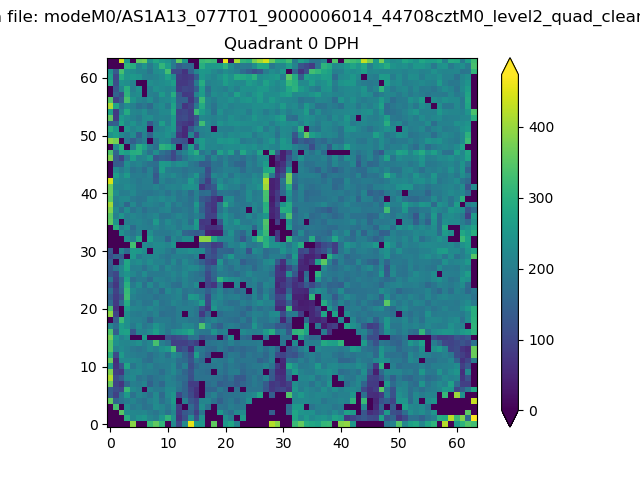 |
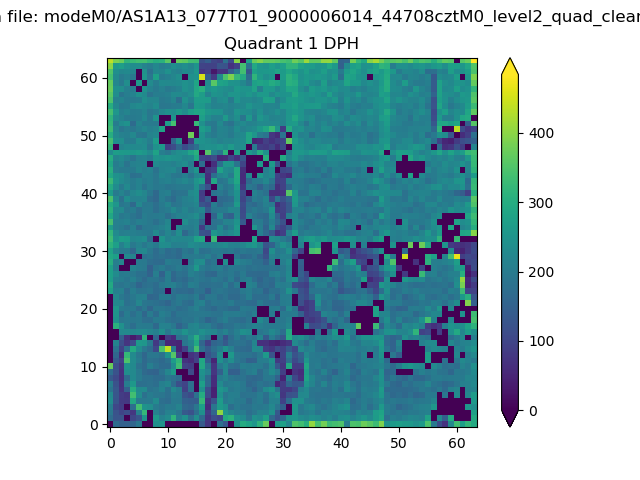 |
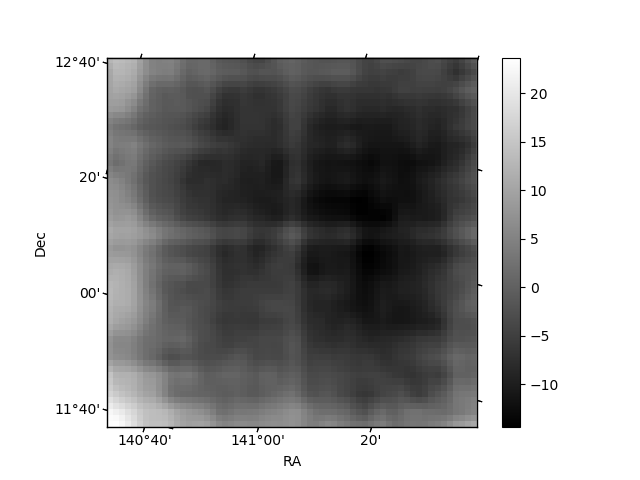
Quadrant B |
|---|---|---|---|
| Quadrant D | 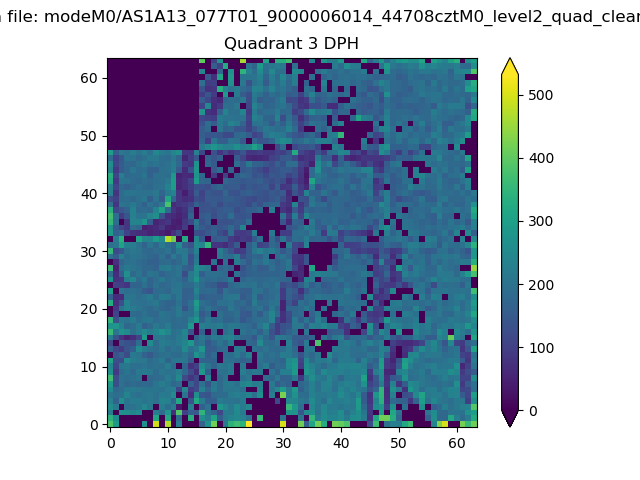 |
 |
Quadrant C |
| Plot type | Count rate plots | Images |
|---|---|---|
| Comparison with Poisson distribution Blue bars denote a histogram of data divided into 1 sec bins. Red curve is a Poisson curve with rate = median count rate of data. |
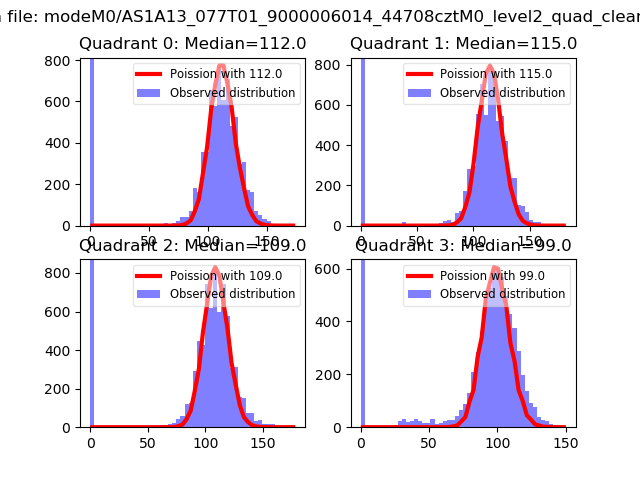 |
 |
| Quadrant-wise count rates Data is divided into 100 sec bins |
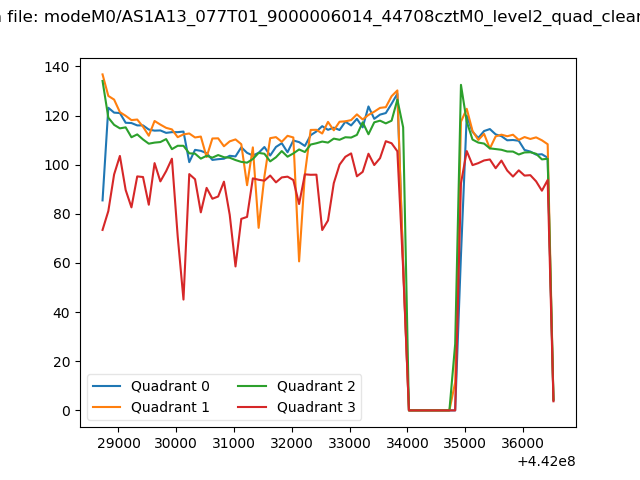 |
|
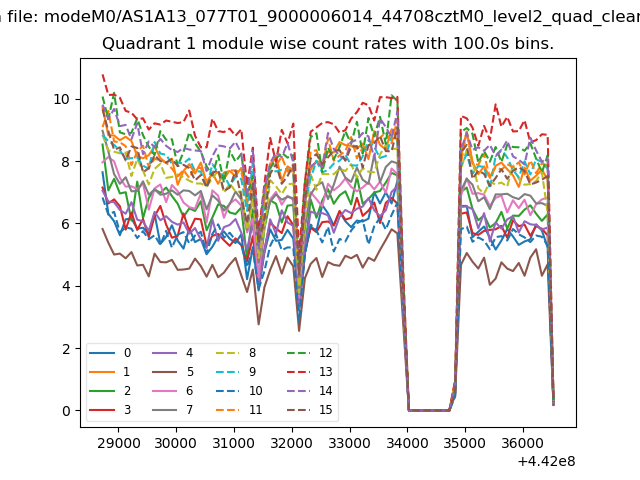
| Module-wise count rates for Quadrant A Data is divided into 100 sec bins |
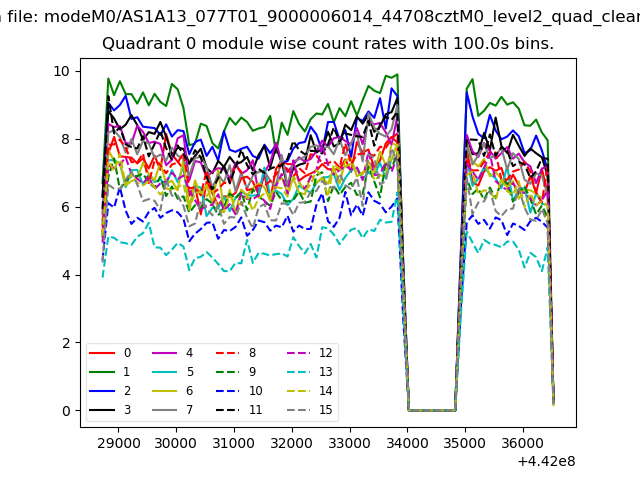 |
 |
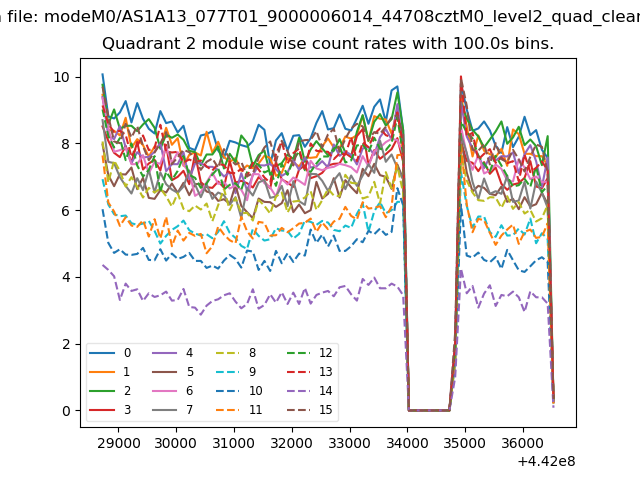
| Module-wise count rates for Quadrant B Data is divided into 100 sec bins |
 |
 |
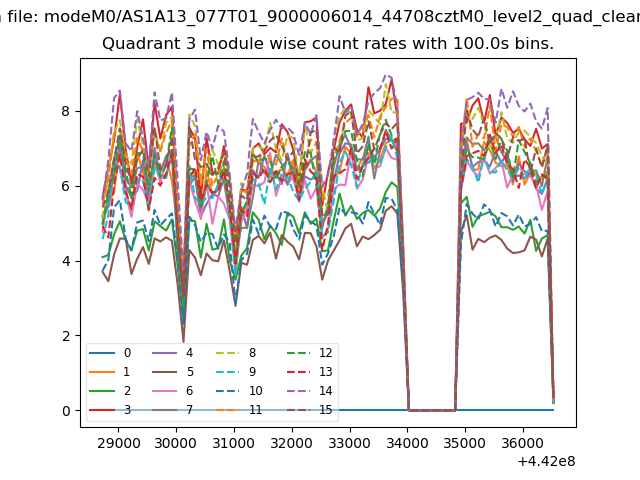
| Module-wise count rates for Quadrant C Data is divided into 100 sec bins |
 |
 |
| Module-wise count rates for Quadrant D Data is divided into 100 sec bins |
 |
 |
| Parameter | Plot |
|---|---|
| CZT HV Monitor | 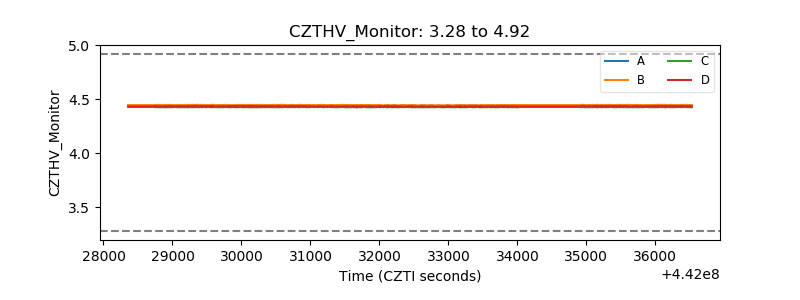 |
| D_VDD | 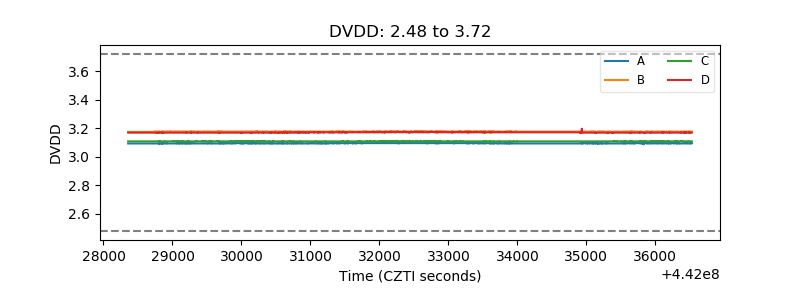 |
| Temperature 1 | 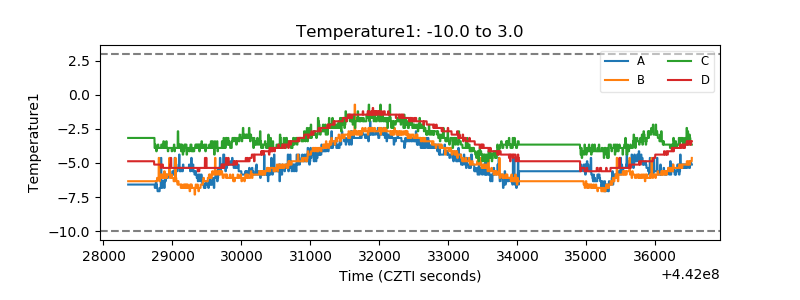 |
| Veto HV Monitor | 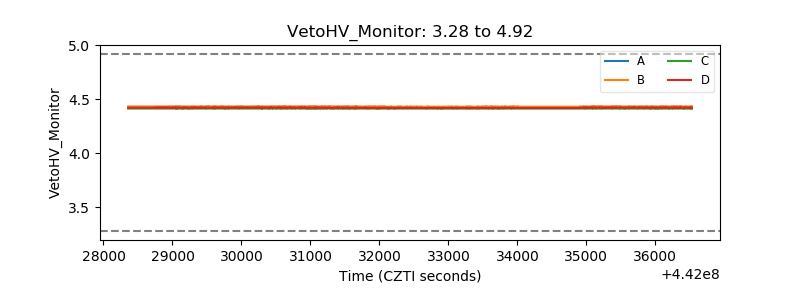 |
| Veto LLD | 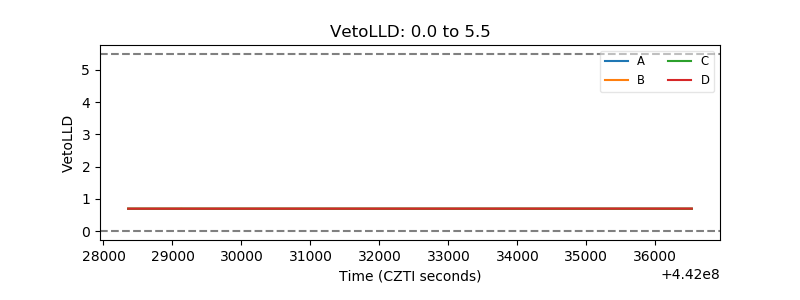 |
| Alpha Counter | 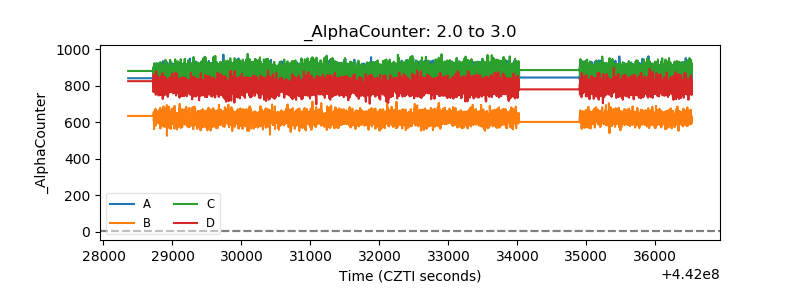 |
| _CPM_Rate | 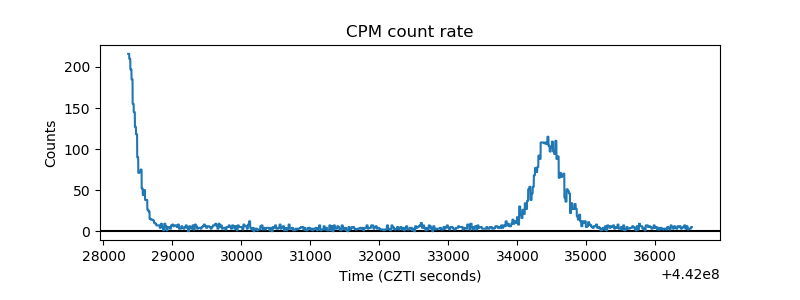 |
| CZT Counter | 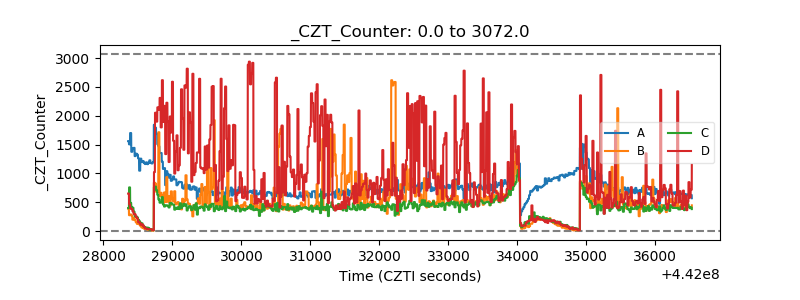 |
| +2.5 Volts monitor | 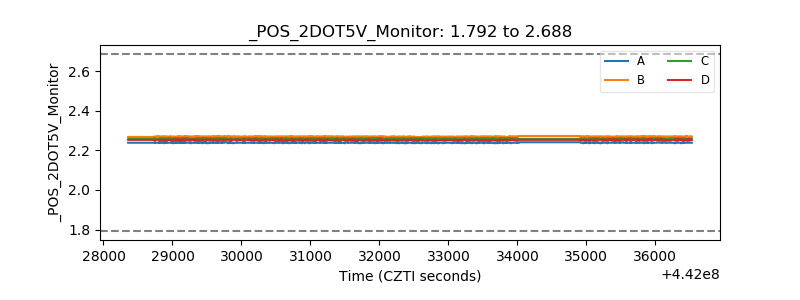 |
| +5 Volts monitor | 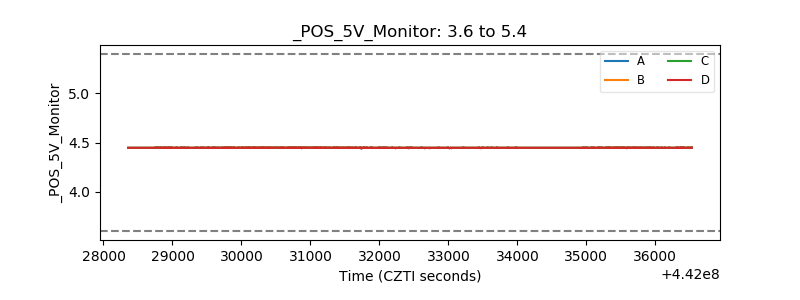 |
| _ROLL_ROT | 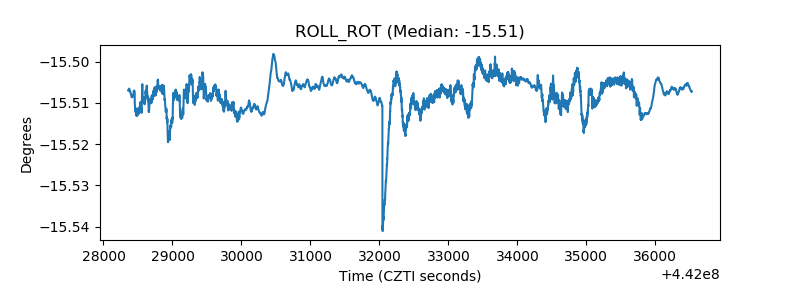 |
| _Roll_DEC | 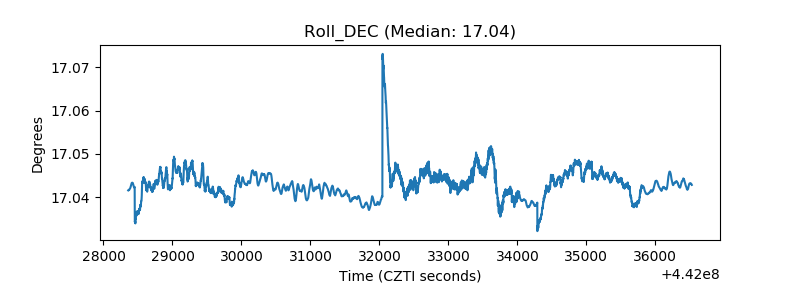 |
| _Roll_RA | 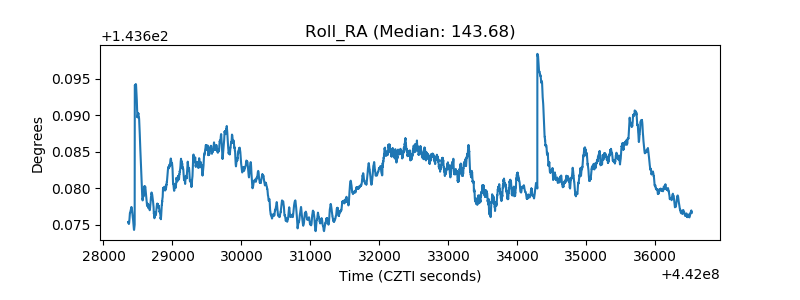 |
| Veto Counter | 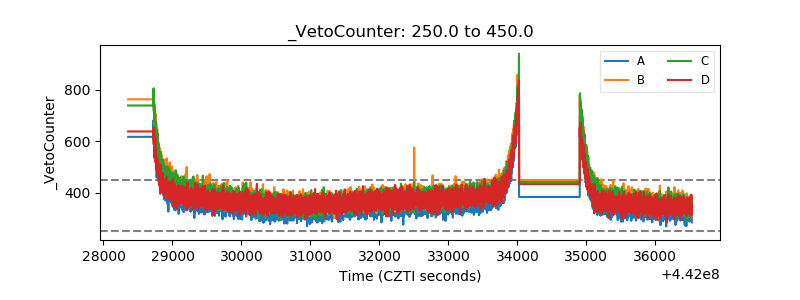 |