| Param | Original file | Final file |
|---|---|---|
| Filename | modeM0/AS1A13_077T01_9000006014_44709cztM0_level2.fits | modeM0/AS1A13_077T01_9000006014_44709cztM0_level2_quad_clean.evt |
| Size (bytes) | 544,484,160 | 116,749,440 |
| Size | 519.3 MB | 111.3 MB |
| Events in quadrant A | 6,033,669 | 750,401 |
| Events in quadrant B | 3,790,355 | 808,391 |
| Events in quadrant C | 3,310,786 | 779,068 |
| Events in quadrant D | 6,447,688 | 683,604 |
| Mode M9 | |||
|---|---|---|---|
| Quadrant | BADHDUFLAG | Total packets | Discarded packets |
| A | 0 | 4 | 0 |
| B | 0 | 4 | 0 |
| C | 0 | 4 | 0 |
| D | 0 | 4 | 0 |
| Mode M0 | |||
|---|---|---|---|
| Quadrant | BADHDUFLAG | Total packets | Discarded packets |
| A | 0 | 24255 | 2 |
| B | 0 | 16258 | 2 |
| C | 0 | 15268 | 2 |
| D | 0 | 24281 | 2 |
| Mode SS | |||
|---|---|---|---|
| Quadrant | BADHDUFLAG | Total packets | Discarded packets |
| A | 0 | 150 | 0 |
| B | 0 | 150 | 0 |
| C | 0 | 150 | 0 |
| D | 0 | 150 | 0 |
| Quadrant | Total seconds | Saturated seconds | Saturation percentage |
|---|---|---|---|
| A | 7375 | 645 | 8.745763% |
| B | 7376 | 256 | 3.470716% |
| C | 7376 | 117 | 1.586226% |
| D | 7376 | 554 | 7.510846% |
Noise dominated data is calculated using 1-second bins in cleaned event files. If a bin has >2000 counts, and if more than 50% of those come from <1% of pixels, then it is considered to be noise-dominated and hence unusable.
| Quadrant | # 1 sec bins | Bins with >0 counts | Bins with >2000 counts | High rate bins dominated by noise | Noise dominated (total time) | Noise dominated (detector-on time) | Marked lightcurve |
|---|---|---|---|---|---|---|---|
| A | 7805 | 7376 | 229 | 229 | 2.93% | 3.10% | 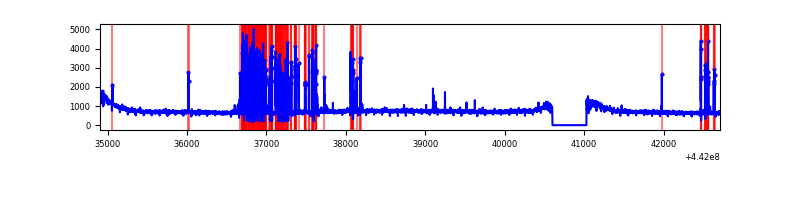 |
| B | 7806 | 7377 | 22 | 22 | 0.28% | 0.30% | 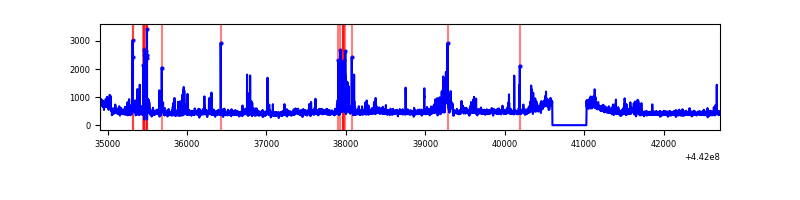 |
| C | 7806 | 7377 | 1 | 1 | 0.01% | 0.01% | 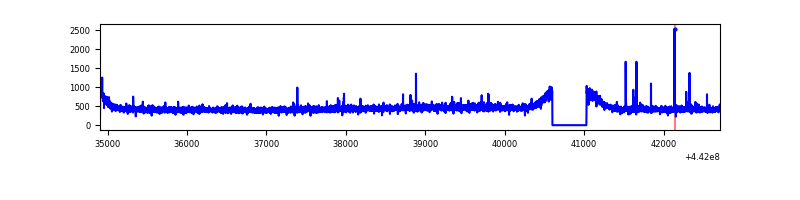 |
| D | 7806 | 7377 | 306 | 306 | 3.92% | 4.15% | 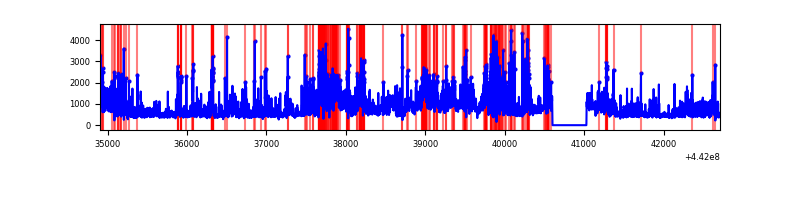 |
Top three noisy pixels from each quadrant. If the there are fewer than three noisy pixels in the level2.evt file, extra rows are filled as -1
| Pixel properties | Quadrant properties | ||||||
|---|---|---|---|---|---|---|---|
| Quadrant | DetID | PixID | Counts | Sigma | Mean | Median | Sigma |
| A | 10 | 83 | 2058114 | 11955.57 | 825 | 806 | 172.1 |
| A | 15 | 223 | 720517 | 4182.44 | 825 | 806 | 172.1 |
| A | 10 | 248 | 56182 | 321.8 | 825 | 806 | 172.1 |
| B | 0 | 189 | 117823 | 697.3 | 843 | 816 | 167.8 |
| B | 5 | 172 | 116936 | 692.01 | 843 | 816 | 167.8 |
| B | 0 | 190 | 65811 | 387.33 | 843 | 816 | 167.8 |
| C | 14 | 254 | 26740 | 130.44 | 834 | 838 | 198.6 |
| C | 3 | 233 | 9229 | 42.26 | 834 | 838 | 198.6 |
| C | 1 | 3 | 8734 | 39.76 | 834 | 838 | 198.6 |
| D | 1 | 52 | 1145592 | 5623.38 | 812 | 789 | 203.6 |
| D | 11 | 241 | 561286 | 2753.22 | 812 | 789 | 203.6 |
| D | 5 | 222 | 493028 | 2417.93 | 812 | 789 | 203.6 |
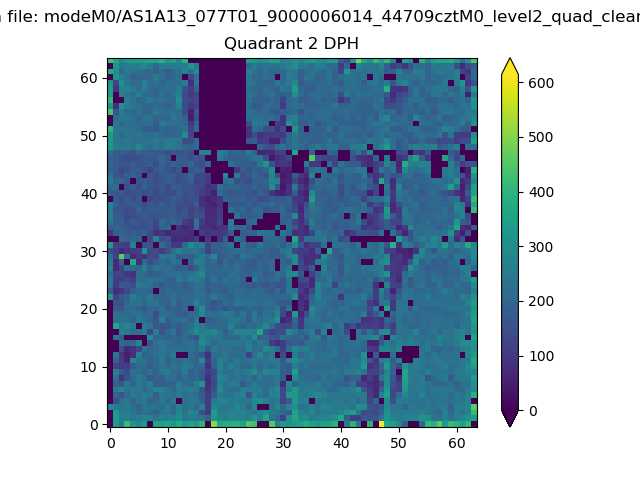
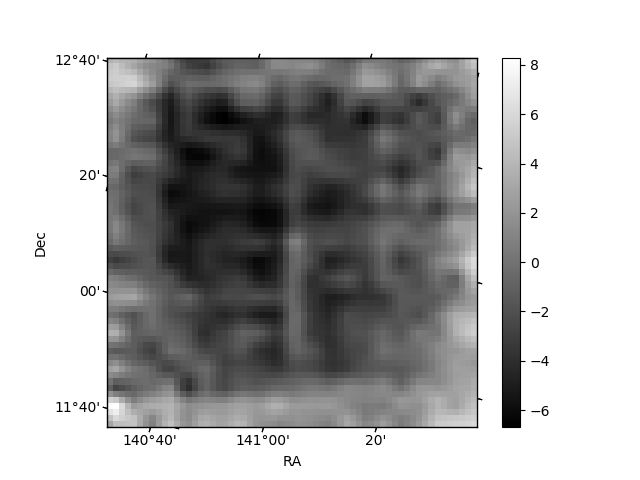
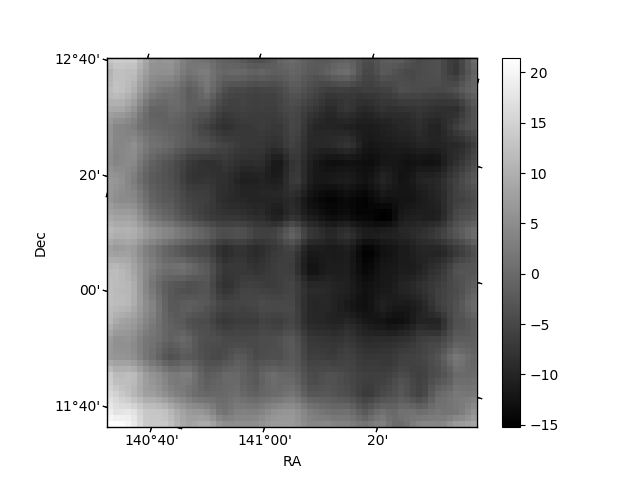
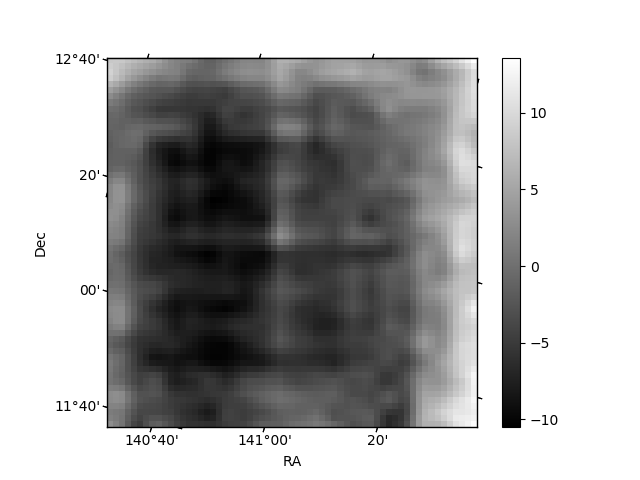
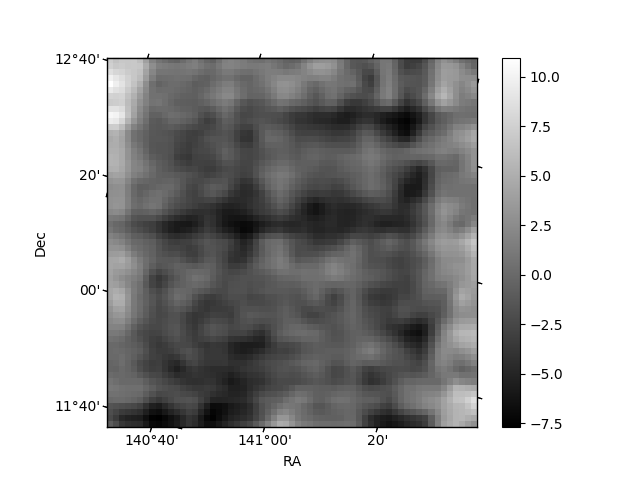
Histogram calculated using DETX and DETY for each event in the final _common_clean file
| Quadrant A | 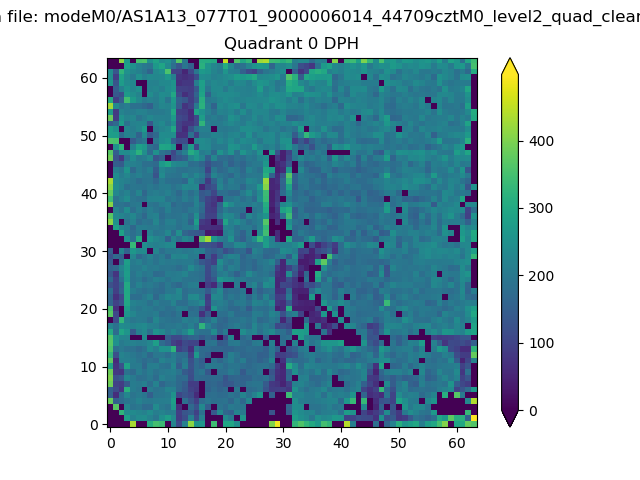 |
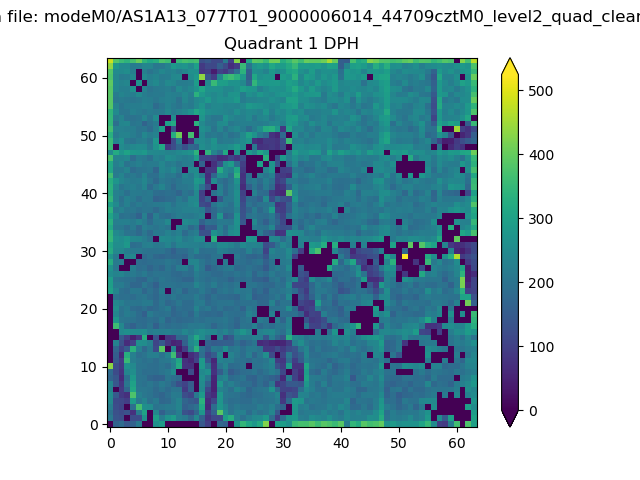 |
Quadrant B |
|---|---|---|---|
| Quadrant D | 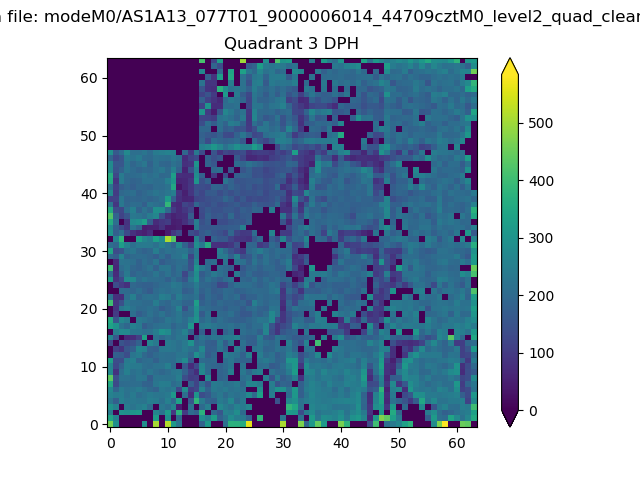 |
 |
Quadrant C |
| Plot type | Count rate plots | Images |
|---|---|---|
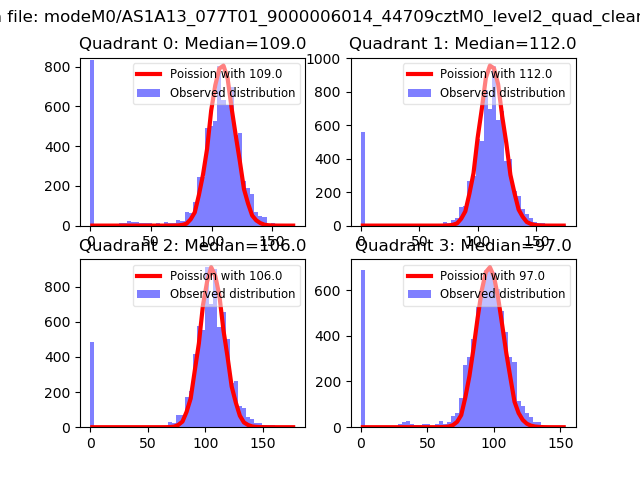
| Comparison with Poisson distribution Blue bars denote a histogram of data divided into 1 sec bins. Red curve is a Poisson curve with rate = median count rate of data. |
 |
 |
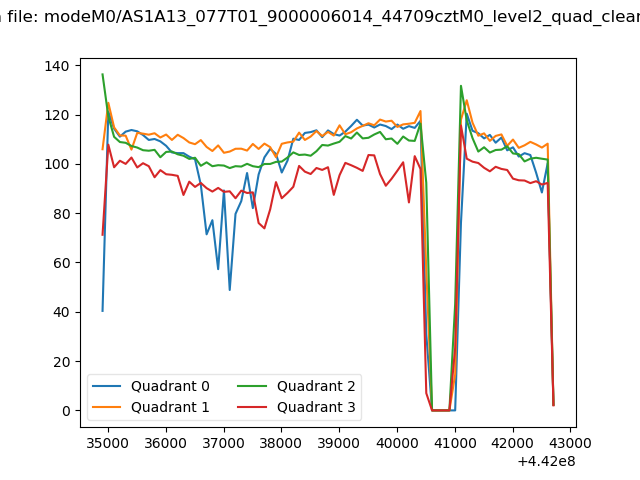
| Quadrant-wise count rates Data is divided into 100 sec bins |
 |
|
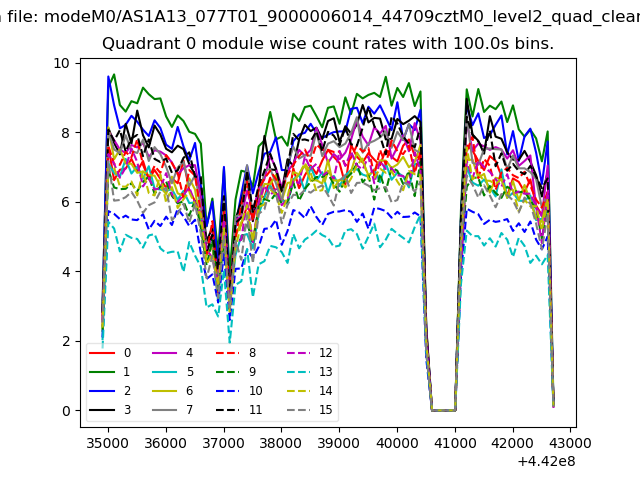
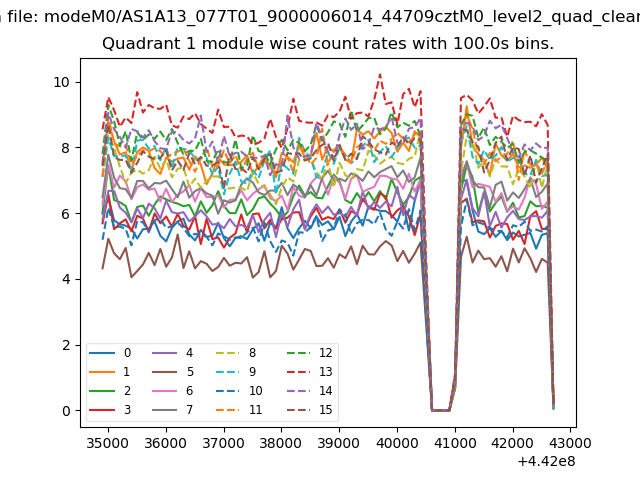
| Module-wise count rates for Quadrant A Data is divided into 100 sec bins |
 |
 |
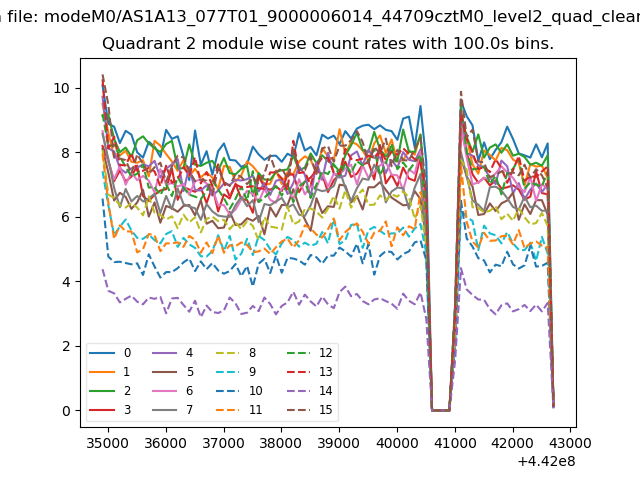
| Module-wise count rates for Quadrant B Data is divided into 100 sec bins |
 |
 |
| Module-wise count rates for Quadrant C Data is divided into 100 sec bins |
 |
 |
| Module-wise count rates for Quadrant D Data is divided into 100 sec bins |
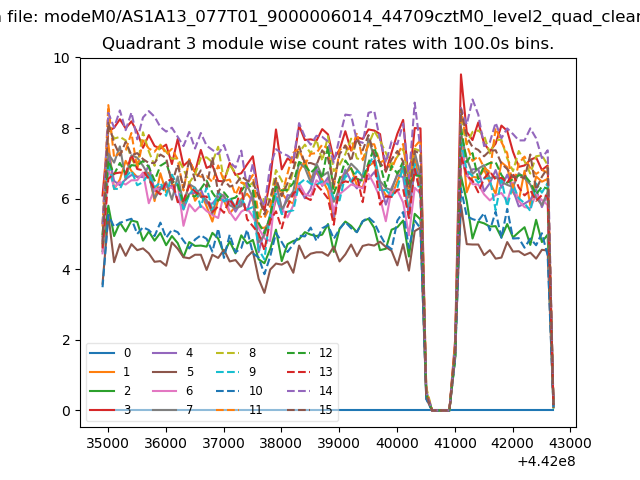 |
 |
| Parameter | Plot |
|---|---|
| CZT HV Monitor | 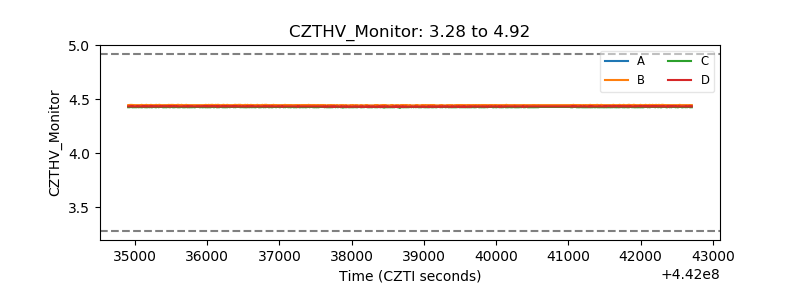 |
| D_VDD | 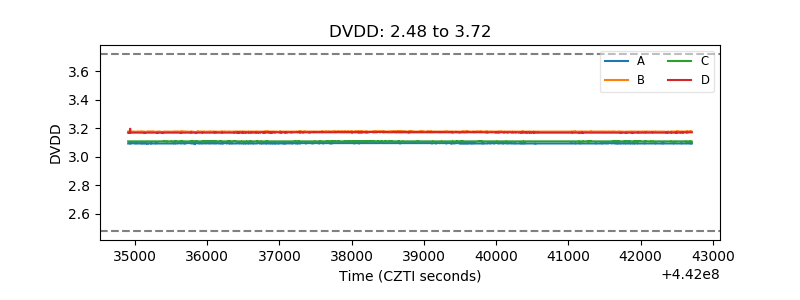 |
| Temperature 1 | 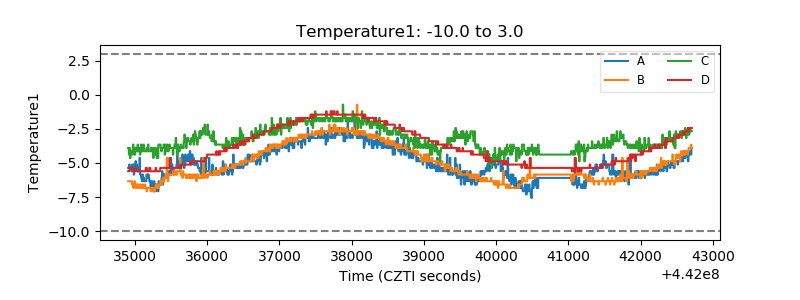 |
| Veto HV Monitor | 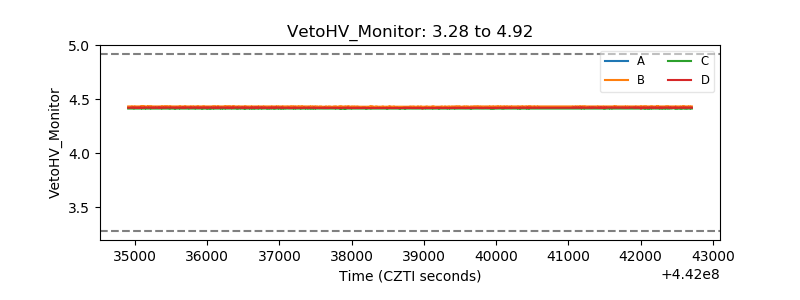 |
| Veto LLD | 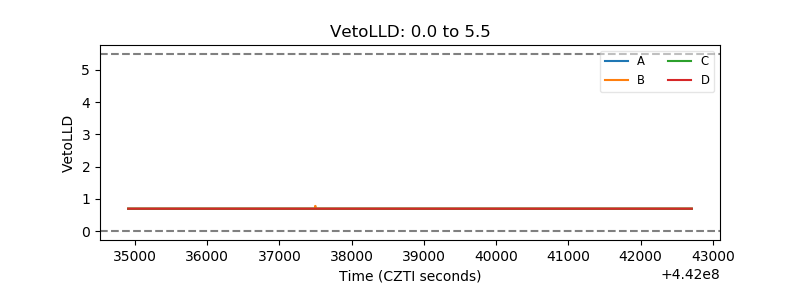 |
| Alpha Counter | 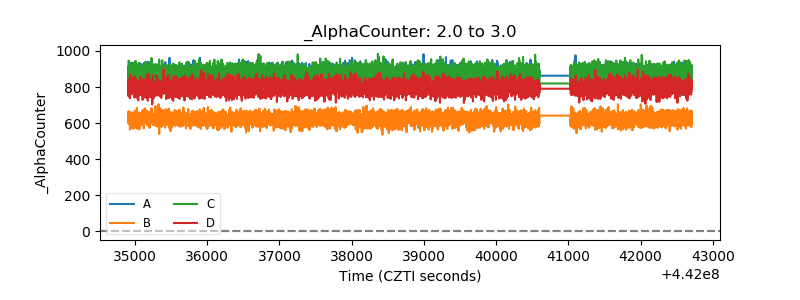 |
| _CPM_Rate | 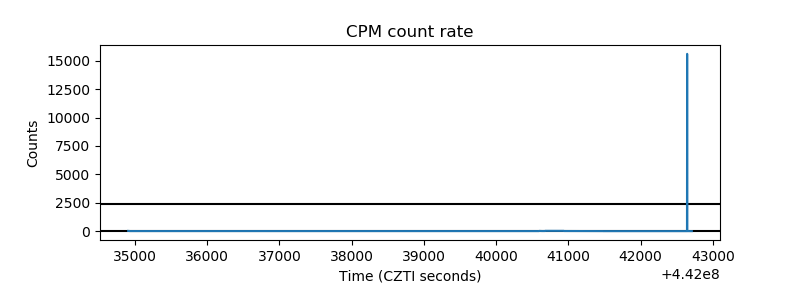 |
| CZT Counter | 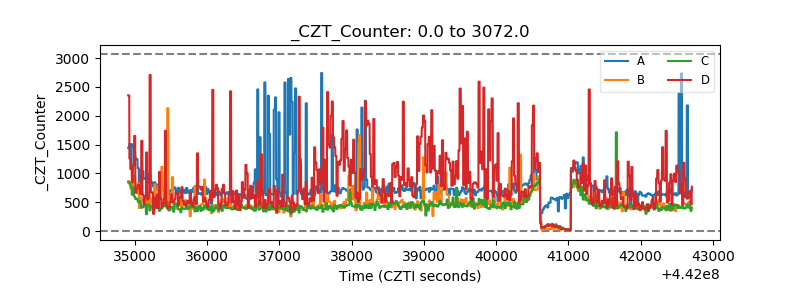 |
| +2.5 Volts monitor | 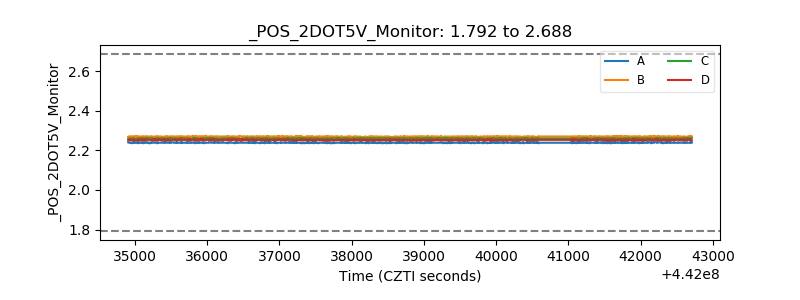 |
| +5 Volts monitor | 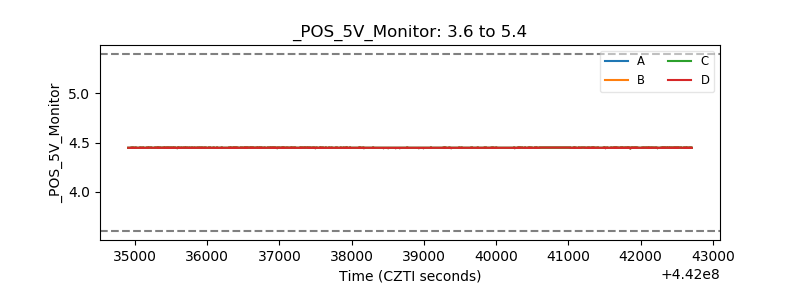 |
| _ROLL_ROT |  |
| _Roll_DEC | 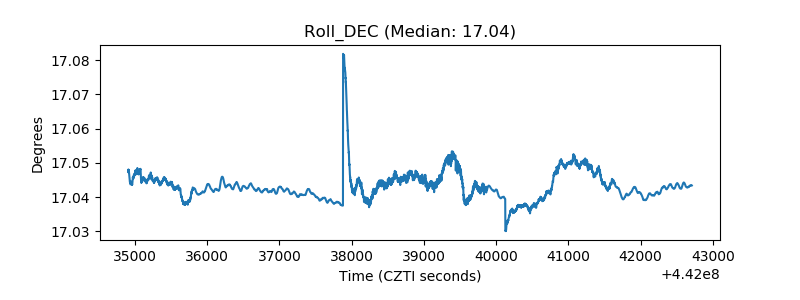 |
| _Roll_RA | 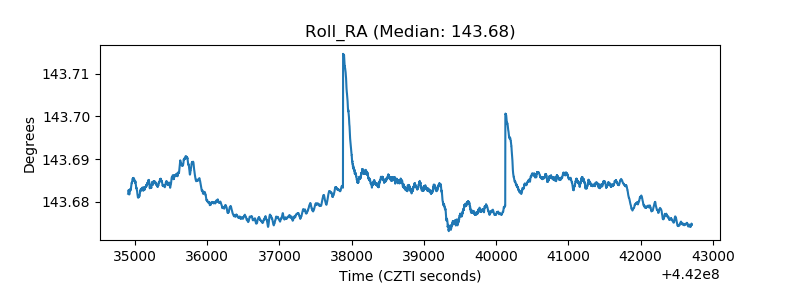 |
| Veto Counter |  |