| Param | Original file | Final file |
|---|---|---|
| Filename | modeM0/AS1A13_077T01_9000006014_44710cztM0_level2.fits | modeM0/AS1A13_077T01_9000006014_44710cztM0_level2_quad_clean.evt |
| Size (bytes) | 562,921,920 | 120,093,120 |
| Size | 536.8 MB | 114.5 MB |
| Events in quadrant A | 6,597,864 | 755,636 |
| Events in quadrant B | 3,730,826 | 840,908 |
| Events in quadrant C | 3,450,949 | 803,869 |
| Events in quadrant D | 6,462,903 | 702,733 |
| Mode M0 | |||
|---|---|---|---|
| Quadrant | BADHDUFLAG | Total packets | Discarded packets |
| A | 0 | 26369 | 5 |
| B | 0 | 16345 | 0 |
| C | 0 | 15965 | 0 |
| D | 0 | 24464 | 0 |
| Mode SS | |||
|---|---|---|---|
| Quadrant | BADHDUFLAG | Total packets | Discarded packets |
| A | 0 | 152 | 0 |
| B | 0 | 152 | 0 |
| C | 0 | 152 | 0 |
| D | 0 | 152 | 0 |
| Quadrant | Total seconds | Saturated seconds | Saturation percentage |
|---|---|---|---|
| A | 7667 | 829 | 10.812573% |
| B | 7667 | 137 | 1.786879% |
| C | 7667 | 51 | 0.665188% |
| D | 7668 | 564 | 7.355243% |
Noise dominated data is calculated using 1-second bins in cleaned event files. If a bin has >2000 counts, and if more than 50% of those come from <1% of pixels, then it is considered to be noise-dominated and hence unusable.
| Quadrant | # 1 sec bins | Bins with >0 counts | Bins with >2000 counts | High rate bins dominated by noise | Noise dominated (total time) | Noise dominated (detector-on time) | Marked lightcurve |
|---|---|---|---|---|---|---|---|
| A | 7666 | 7666 | 441 | 441 | 5.75% | 5.75% | 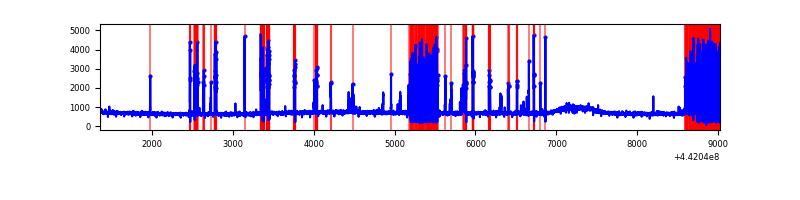 |
| B | 7667 | 7667 | 13 | 13 | 0.17% | 0.17% | 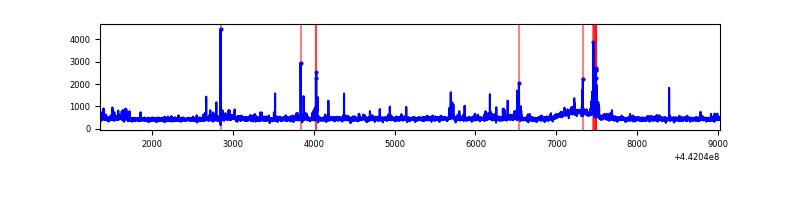 |
| C | 7667 | 7667 | 14 | 14 | 0.18% | 0.18% | 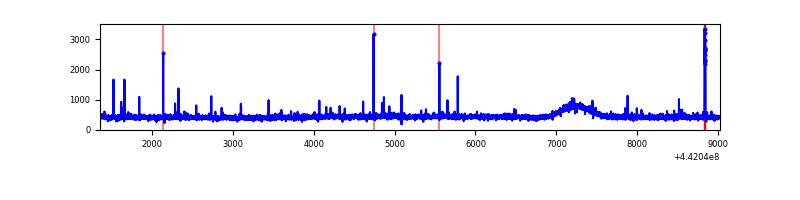 |
| D | 7668 | 7668 | 384 | 384 | 5.01% | 5.01% | 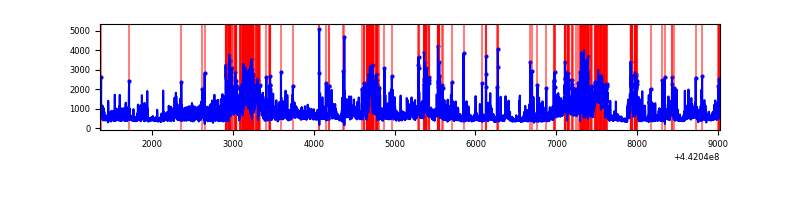 |
Top three noisy pixels from each quadrant. If the there are fewer than three noisy pixels in the level2.evt file, extra rows are filled as -1
| Pixel properties | Quadrant properties | ||||||
|---|---|---|---|---|---|---|---|
| Quadrant | DetID | PixID | Counts | Sigma | Mean | Median | Sigma |
| A | 10 | 83 | 1844448 | 10690.78 | 827 | 808 | 172.5 |
| A | 15 | 223 | 1541050 | 8931.45 | 827 | 808 | 172.5 |
| A | 3 | 137 | 9812 | 52.21 | 827 | 808 | 172.5 |
| B | 0 | 189 | 86476 | 500.59 | 864 | 837 | 171.1 |
| B | 0 | 219 | 54630 | 314.44 | 864 | 837 | 171.1 |
| B | 0 | 190 | 52830 | 303.92 | 864 | 837 | 171.1 |
| C | 1 | 3 | 46660 | 226.41 | 854 | 858 | 202.3 |
| C | 14 | 254 | 30532 | 146.69 | 854 | 858 | 202.3 |
| C | 0 | 207 | 20125 | 95.24 | 854 | 858 | 202.3 |
| D | 5 | 222 | 1259158 | 6041.22 | 832 | 809 | 208.3 |
| D | 13 | 249 | 535132 | 2565.23 | 832 | 809 | 208.3 |
| D | 5 | 235 | 316130 | 1513.83 | 832 | 809 | 208.3 |
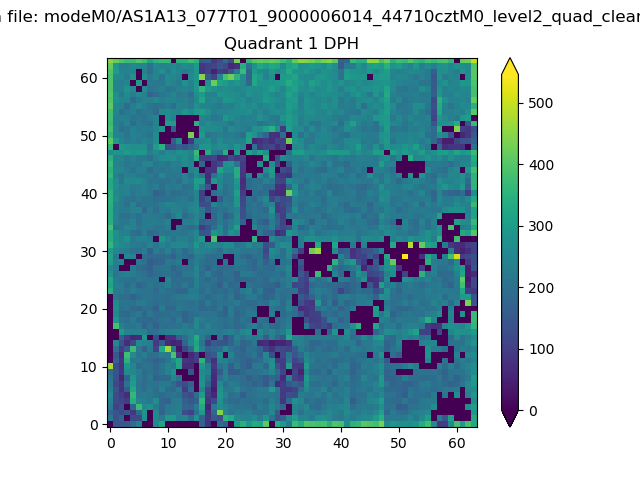
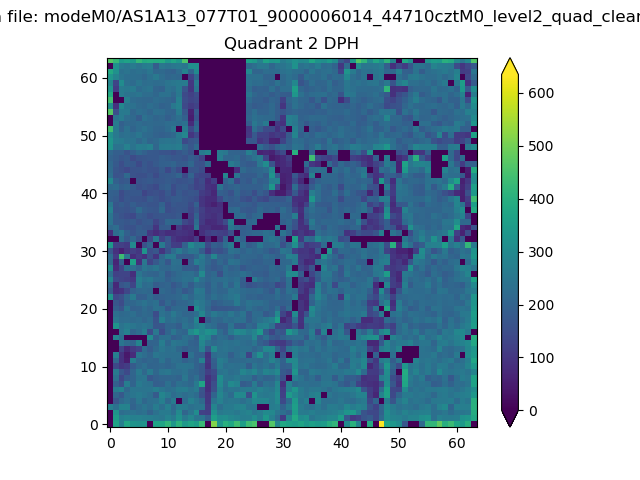
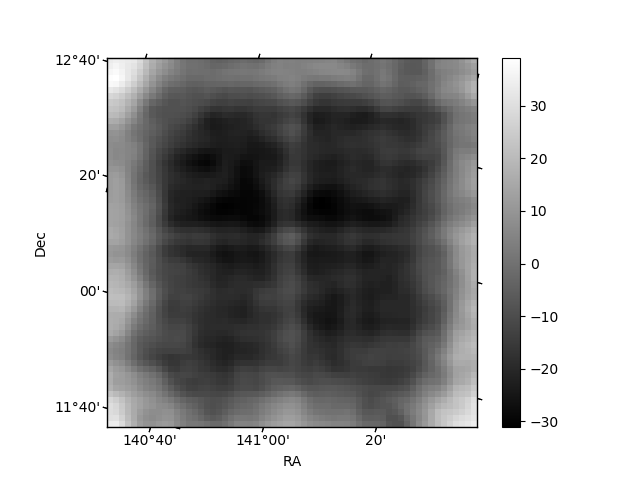
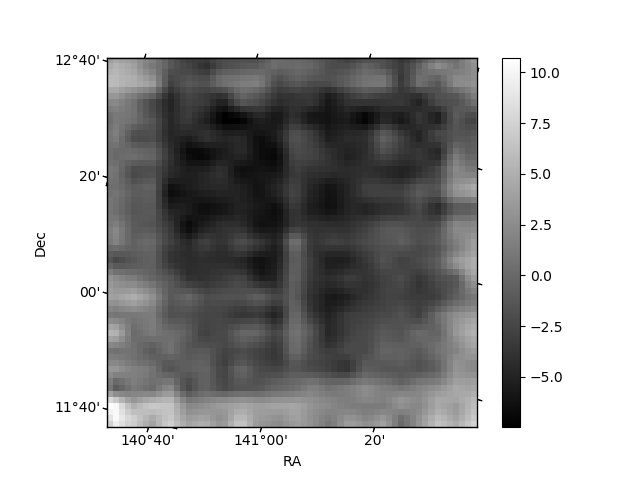
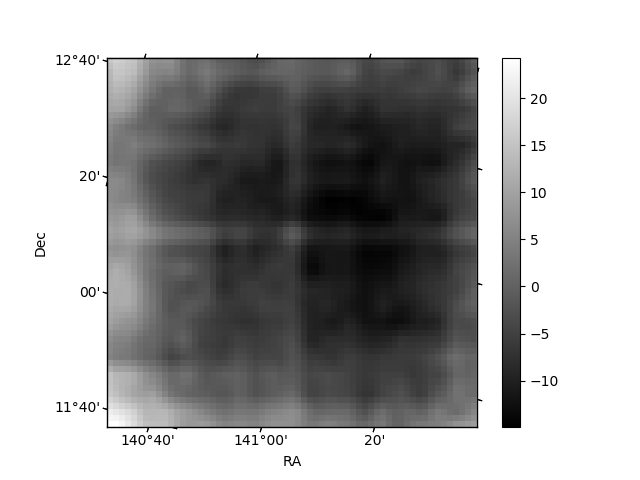
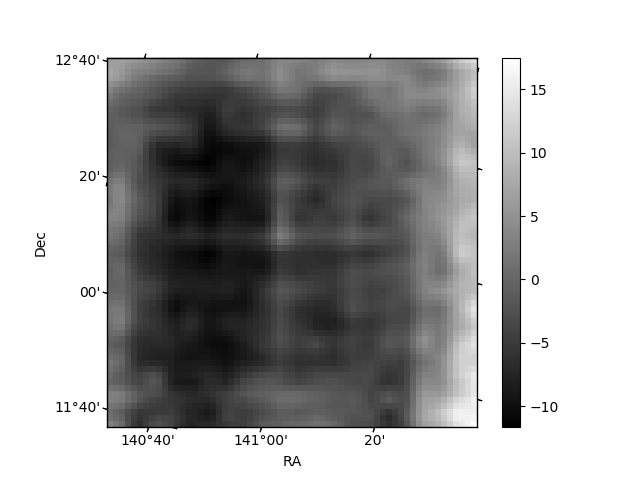
Histogram calculated using DETX and DETY for each event in the final _common_clean file
| Quadrant A |  |
 |
Quadrant B |
|---|---|---|---|
| Quadrant D | 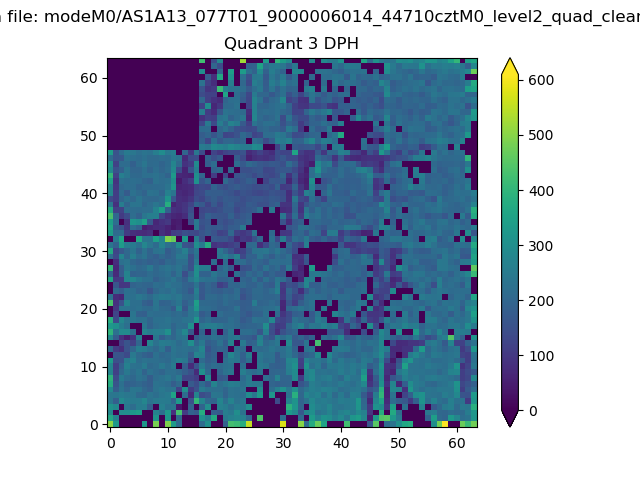 |
 |
Quadrant C |
| Plot type | Count rate plots | Images |
|---|---|---|
| Comparison with Poisson distribution Blue bars denote a histogram of data divided into 1 sec bins. Red curve is a Poisson curve with rate = median count rate of data. |
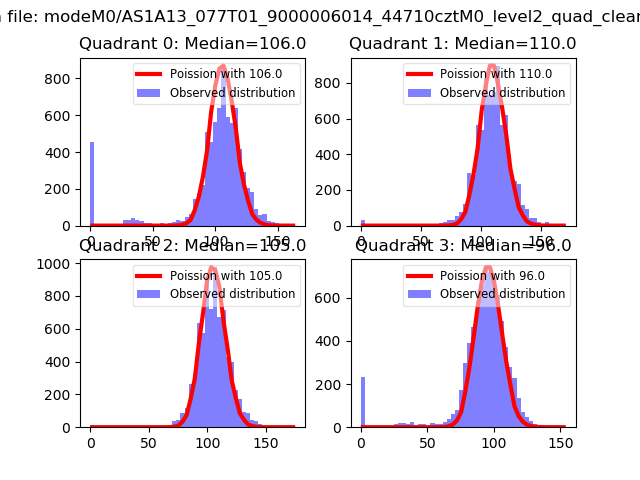 |
 |
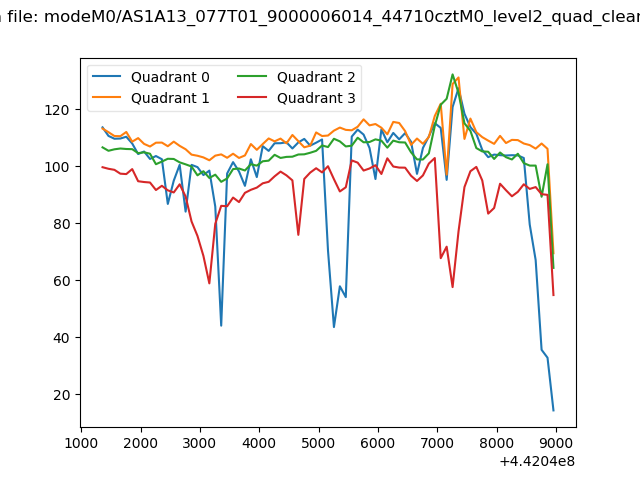
| Quadrant-wise count rates Data is divided into 100 sec bins |
 |
|
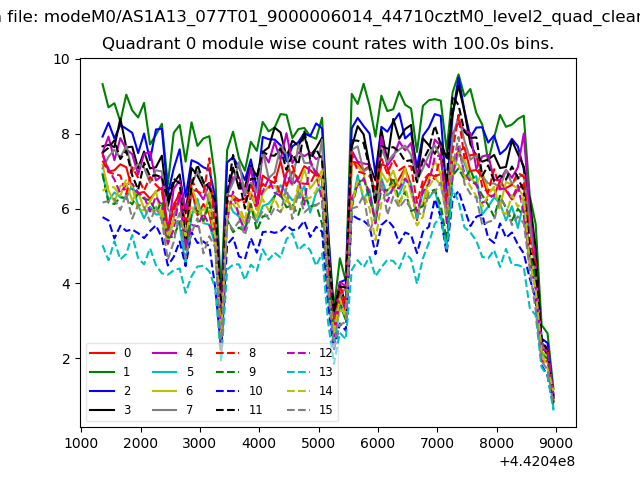
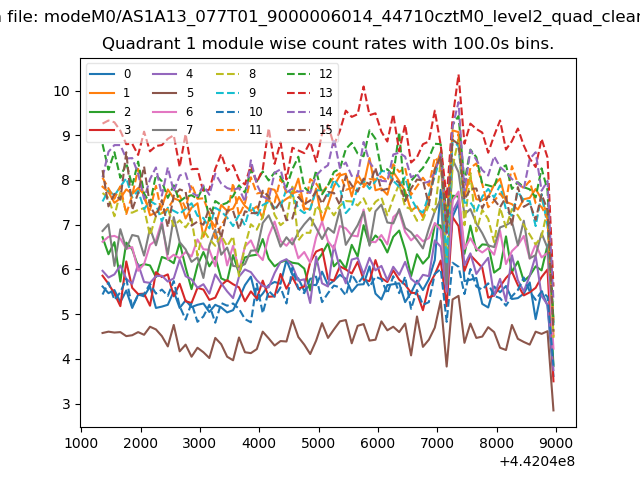
| Module-wise count rates for Quadrant A Data is divided into 100 sec bins |
 |
 |
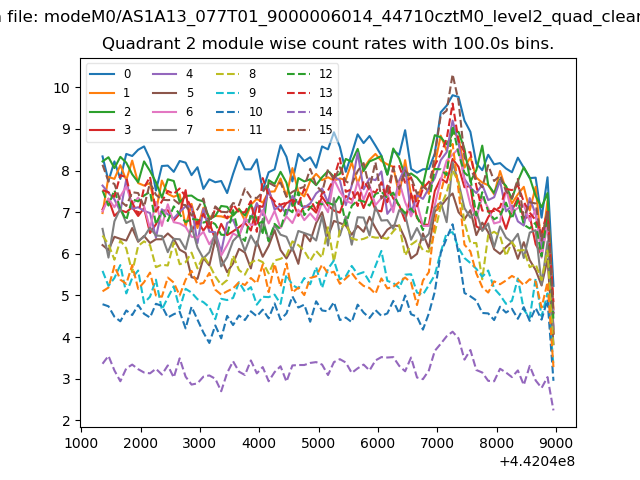
| Module-wise count rates for Quadrant B Data is divided into 100 sec bins |
 |
 |
| Module-wise count rates for Quadrant C Data is divided into 100 sec bins |
 |
 |
| Module-wise count rates for Quadrant D Data is divided into 100 sec bins |
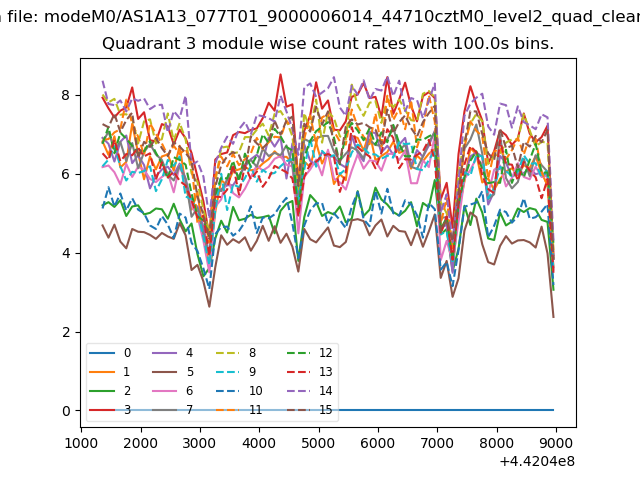 |
 |
| Parameter | Plot |
|---|---|
| CZT HV Monitor | 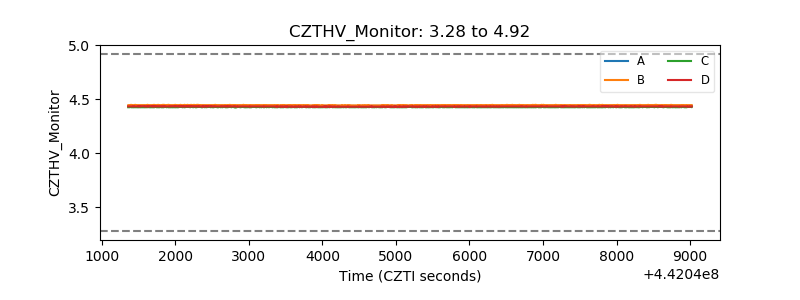 |
| D_VDD | 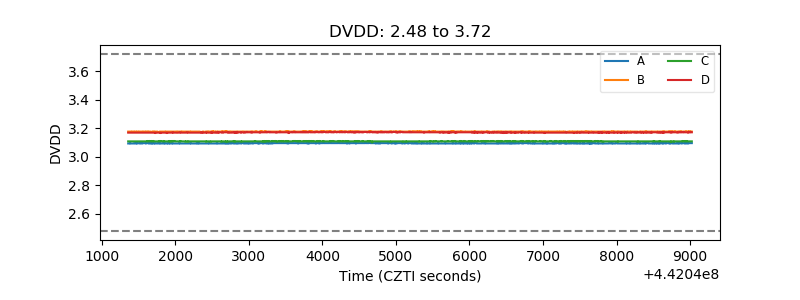 |
| Temperature 1 | 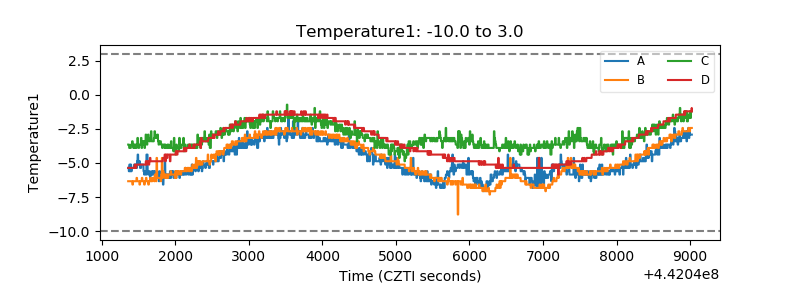 |
| Veto HV Monitor | 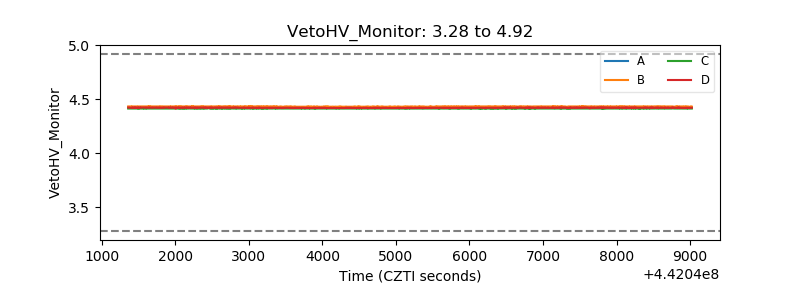 |
| Veto LLD | 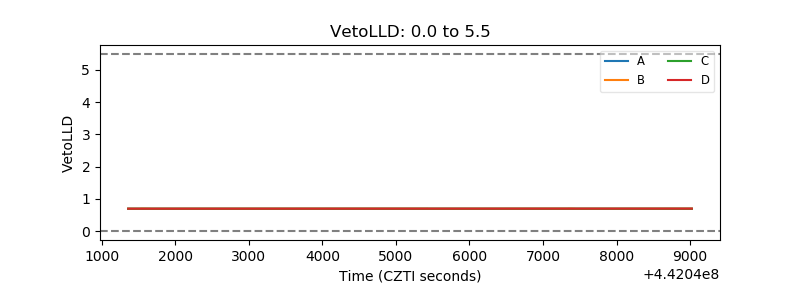 |
| Alpha Counter | 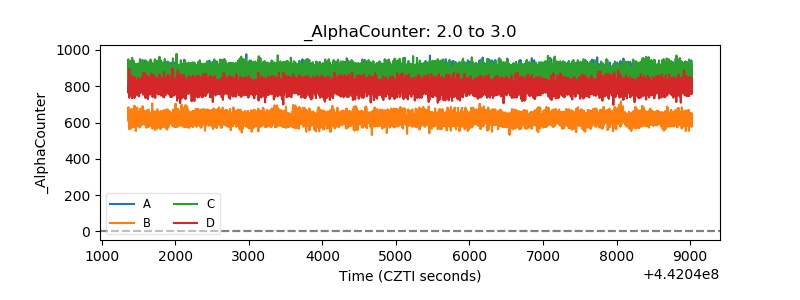 |
| _CPM_Rate | 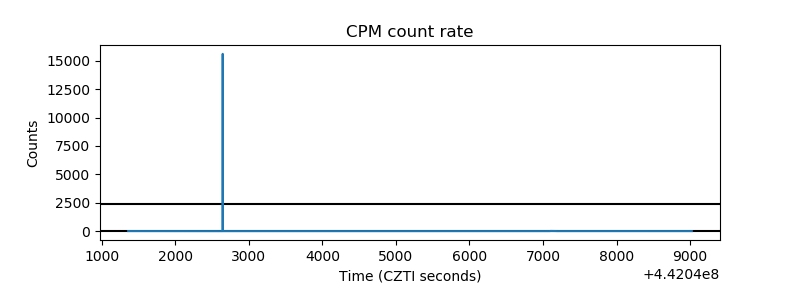 |
| CZT Counter | 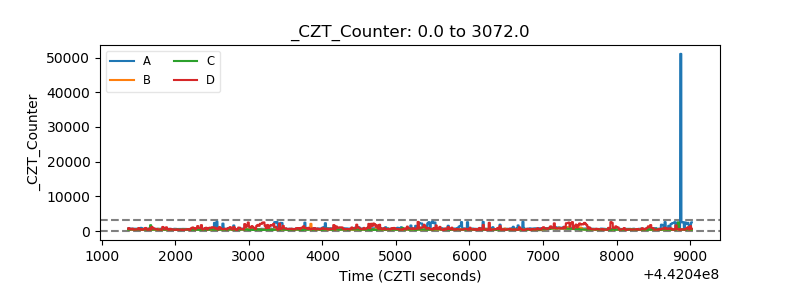 |
| +2.5 Volts monitor | 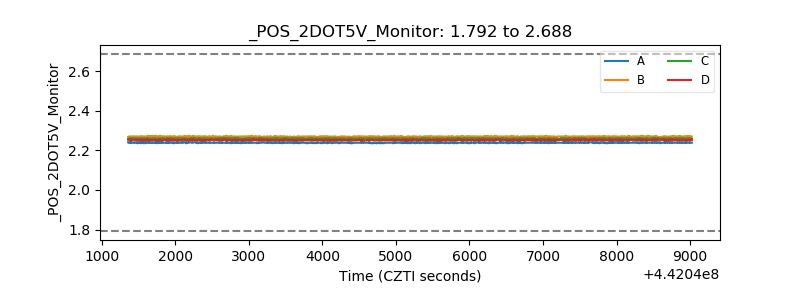 |
| +5 Volts monitor | 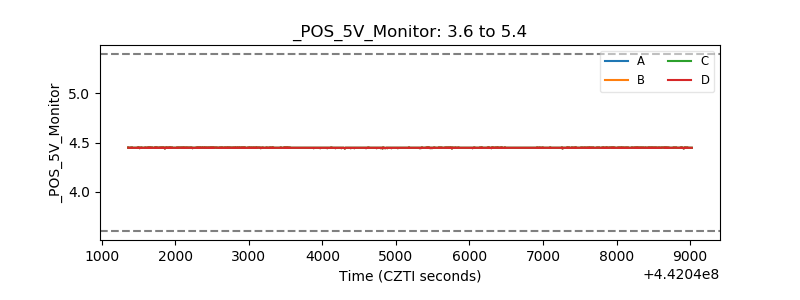 |
| _ROLL_ROT | 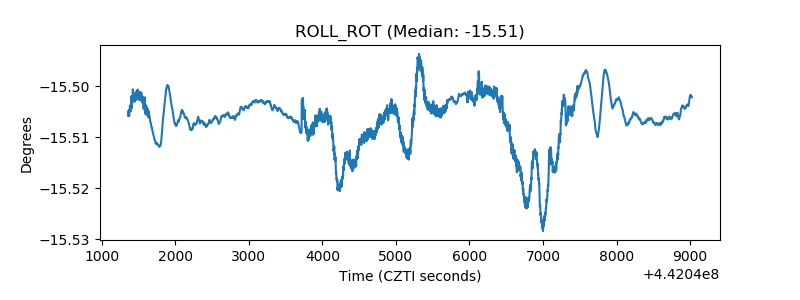 |
| _Roll_DEC | 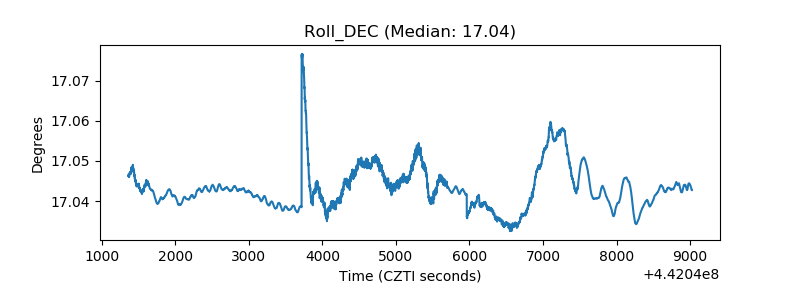 |
| _Roll_RA | 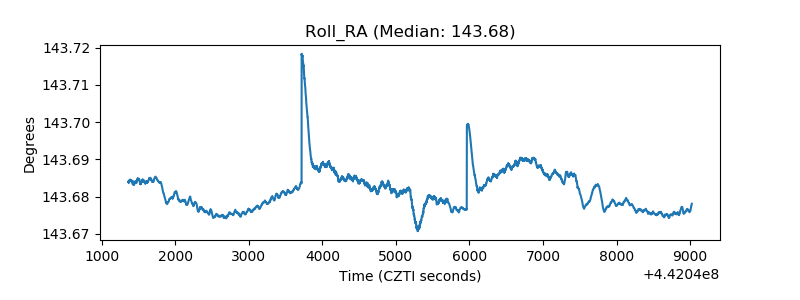 |
| Veto Counter | 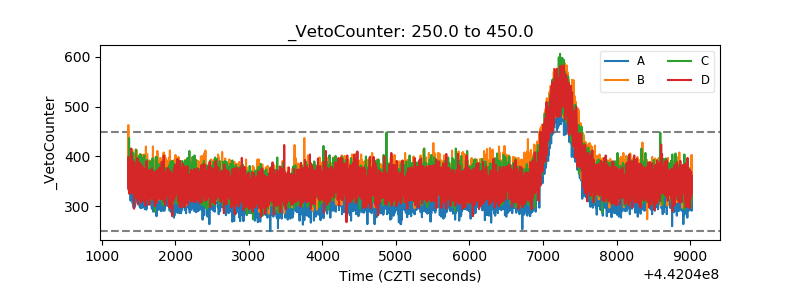 |