| Param | Original file | Final file |
|---|---|---|
| Filename | modeM0/AS1A13_077T01_9000006014_44714cztM0_level2.fits | modeM0/AS1A13_077T01_9000006014_44714cztM0_level2_quad_clean.evt |
| Size (bytes) | 1,139,855,040 | 206,167,680 |
| Size | 1.1 GB | 196.6 MB |
| Events in quadrant A | 12,762,696 | 1,338,861 |
| Events in quadrant B | 7,665,935 | 1,442,437 |
| Events in quadrant C | 6,301,784 | 1,394,373 |
| Events in quadrant D | 14,401,358 | 1,118,121 |
| Mode M9 | |||
|---|---|---|---|
| Quadrant | BADHDUFLAG | Total packets | Discarded packets |
| A | 0 | 5 | 0 |
| B | 0 | 5 | 0 |
| C | 0 | 5 | 0 |
| D | 0 | 5 | 0 |
| Mode M0 | |||
|---|---|---|---|
| Quadrant | BADHDUFLAG | Total packets | Discarded packets |
| A | 0 | 48878 | 4 |
| B | 0 | 31913 | 3 |
| C | 0 | 28720 | 2 |
| D | 0 | 52388 | 3 |
| Mode SS | |||
|---|---|---|---|
| Quadrant | BADHDUFLAG | Total packets | Discarded packets |
| A | 0 | 276 | 0 |
| B | 0 | 276 | 0 |
| C | 0 | 276 | 0 |
| D | 0 | 276 | 0 |
| Quadrant | Total seconds | Saturated seconds | Saturation percentage |
|---|---|---|---|
| A | 13731 | 1323 | 9.635132% |
| B | 13731 | 574 | 4.180322% |
| C | 13732 | 317 | 2.308477% |
| D | 13731 | 2438 | 17.755444% |
Noise dominated data is calculated using 1-second bins in cleaned event files. If a bin has >2000 counts, and if more than 50% of those come from <1% of pixels, then it is considered to be noise-dominated and hence unusable.
| Quadrant | # 1 sec bins | Bins with >0 counts | Bins with >2000 counts | High rate bins dominated by noise | Noise dominated (total time) | Noise dominated (detector-on time) | Marked lightcurve |
|---|---|---|---|---|---|---|---|
| A | 14156 | 13734 | 723 | 723 | 5.11% | 5.26% | 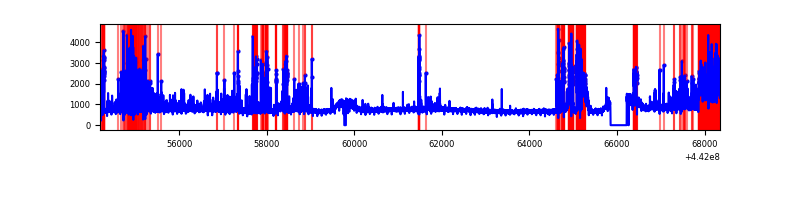 |
| B | 14157 | 13735 | 111 | 111 | 0.78% | 0.81% | 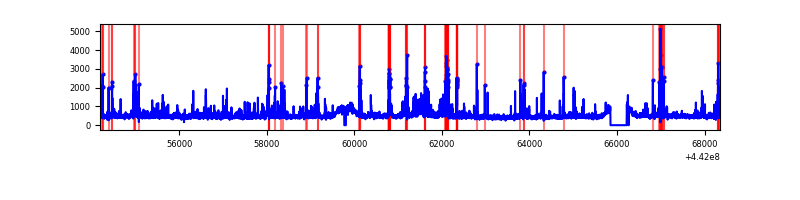 |
| C | 14157 | 13735 | 0 | 0 | 0.00% | 0.00% | 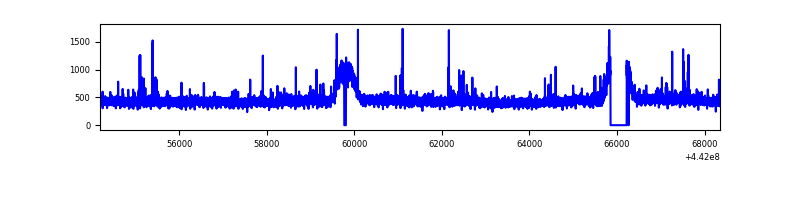 |
| D | 14157 | 13735 | 1842 | 1842 | 13.01% | 13.41% | 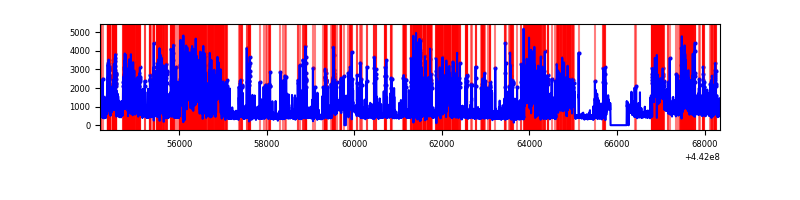 |
Top three noisy pixels from each quadrant. If the there are fewer than three noisy pixels in the level2.evt file, extra rows are filled as -1
| Pixel properties | Quadrant properties | ||||||
|---|---|---|---|---|---|---|---|
| Quadrant | DetID | PixID | Counts | Sigma | Mean | Median | Sigma |
| A | 10 | 83 | 3769855 | 11663.49 | 1547 | 1514 | 323.1 |
| A | 15 | 223 | 2828514 | 8749.92 | 1547 | 1514 | 323.1 |
| A | 13 | 248 | 132533 | 405.52 | 1547 | 1514 | 323.1 |
| B | 5 | 255 | 447596 | 1418.21 | 1570 | 1519 | 314.5 |
| B | 0 | 189 | 322713 | 1021.17 | 1570 | 1519 | 314.5 |
| B | 4 | 171 | 141060 | 443.64 | 1570 | 1519 | 314.5 |
| C | 14 | 254 | 72574 | 192.01 | 1562 | 1574 | 369.8 |
| C | 3 | 233 | 51510 | 135.05 | 1562 | 1574 | 369.8 |
| C | 0 | 207 | 29609 | 75.82 | 1562 | 1574 | 369.8 |
| D | 13 | 249 | 3090588 | 8245.93 | 1479 | 1436 | 374.6 |
| D | 11 | 241 | 2501524 | 6673.53 | 1479 | 1436 | 374.6 |
| D | 1 | 52 | 882910 | 2352.93 | 1479 | 1436 | 374.6 |
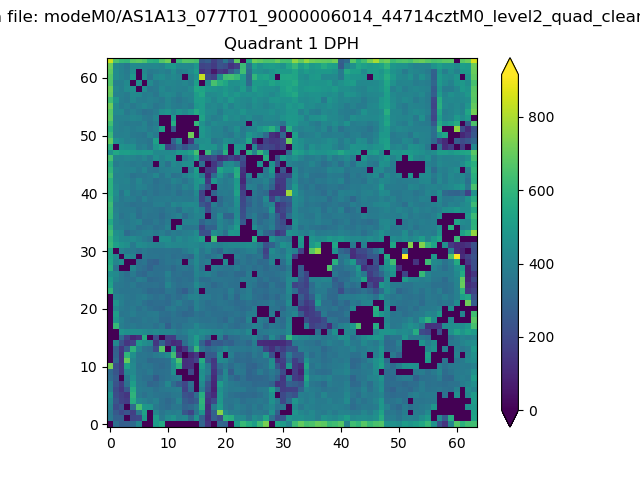
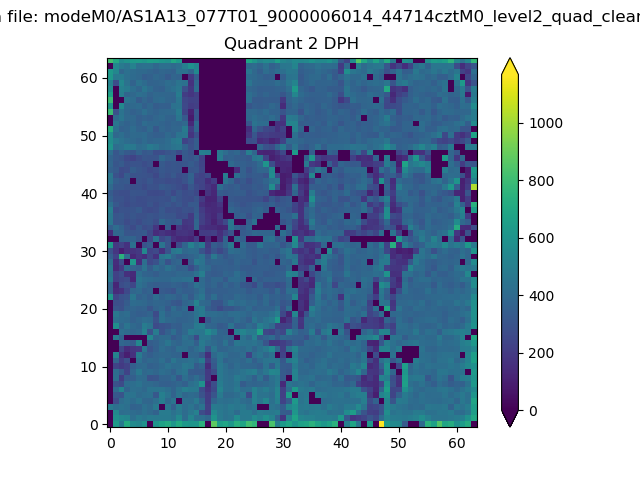
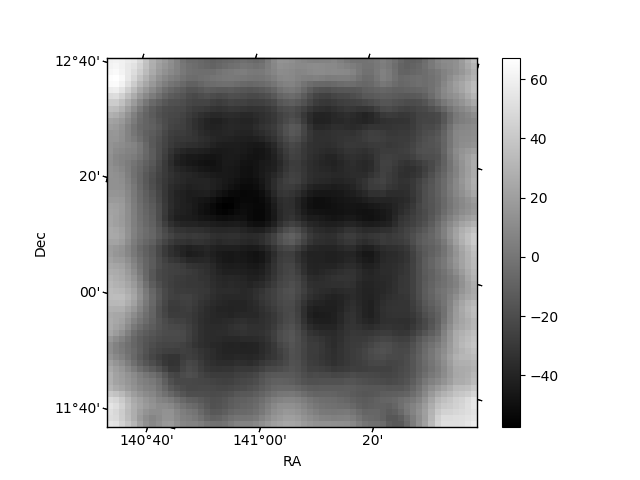
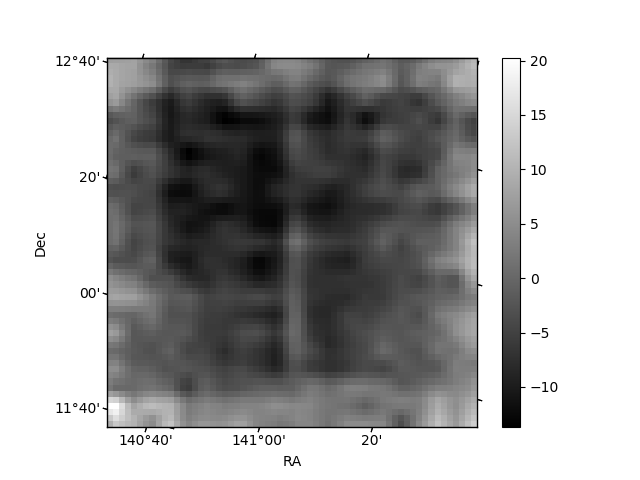
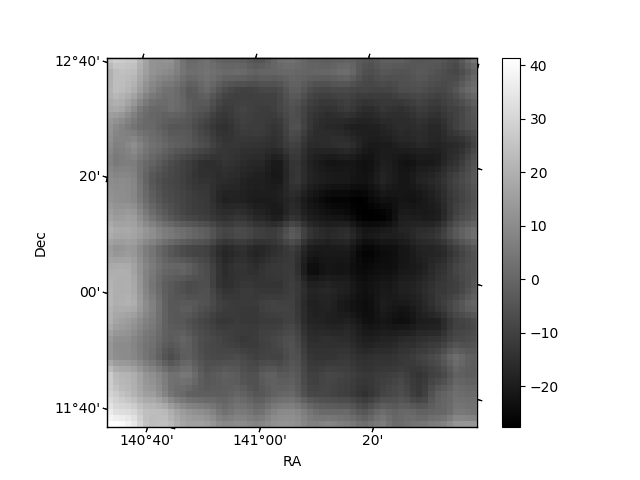
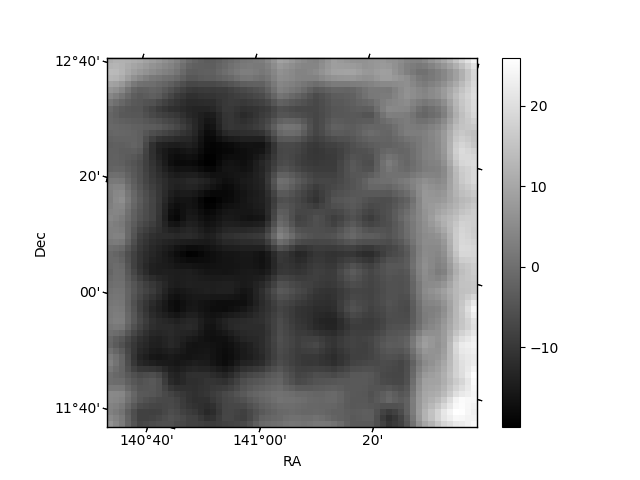
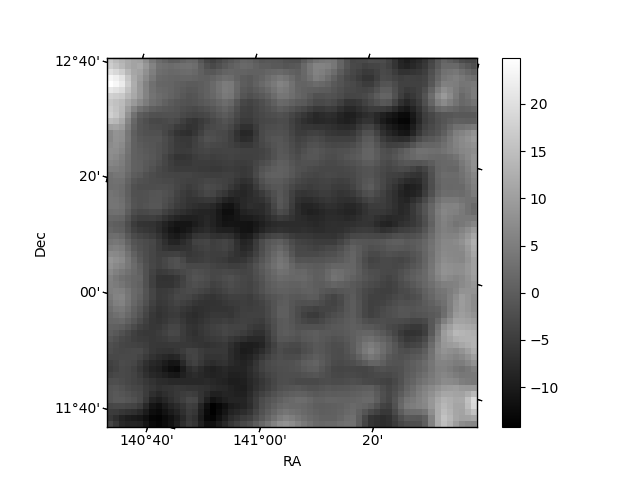
Histogram calculated using DETX and DETY for each event in the final _common_clean file
| Quadrant A |  |
 |
Quadrant B |
|---|---|---|---|
| Quadrant D | 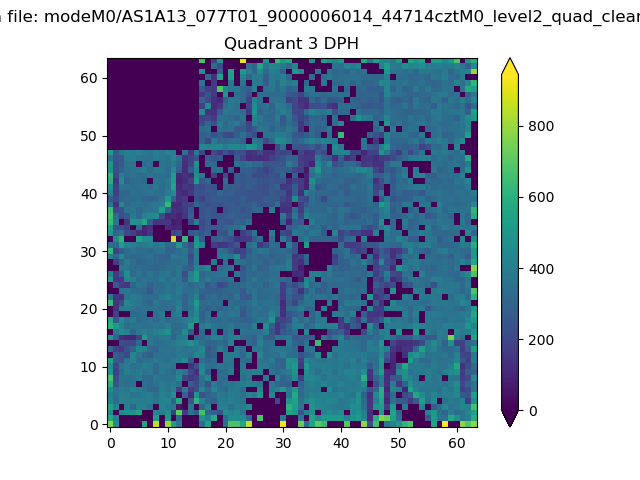 |
 |
Quadrant C |
| Plot type | Count rate plots | Images |
|---|---|---|
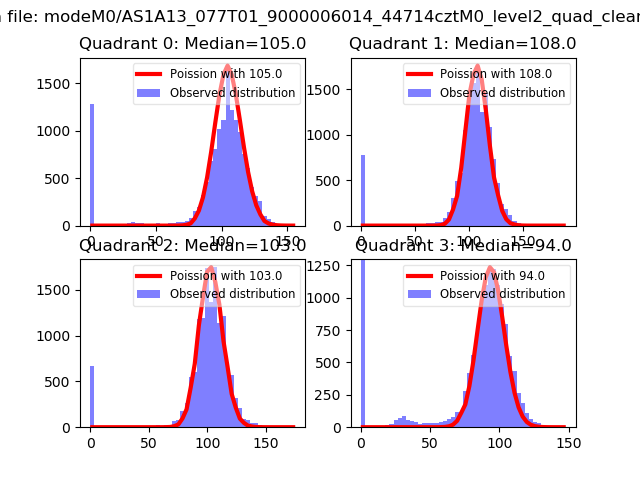
| Comparison with Poisson distribution Blue bars denote a histogram of data divided into 1 sec bins. Red curve is a Poisson curve with rate = median count rate of data. |
 |
 |
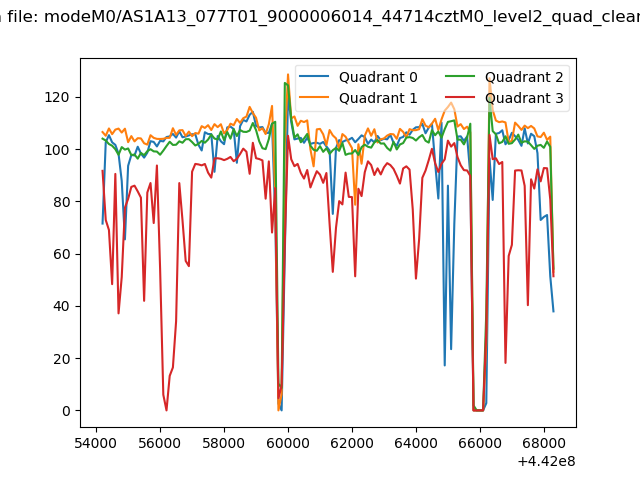
| Quadrant-wise count rates Data is divided into 100 sec bins |
 |
|
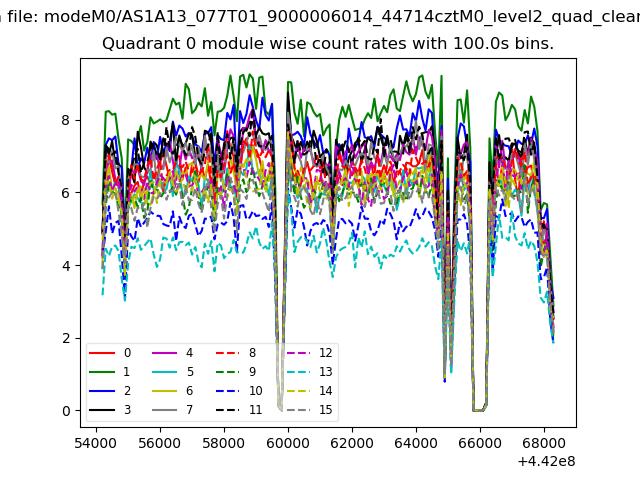
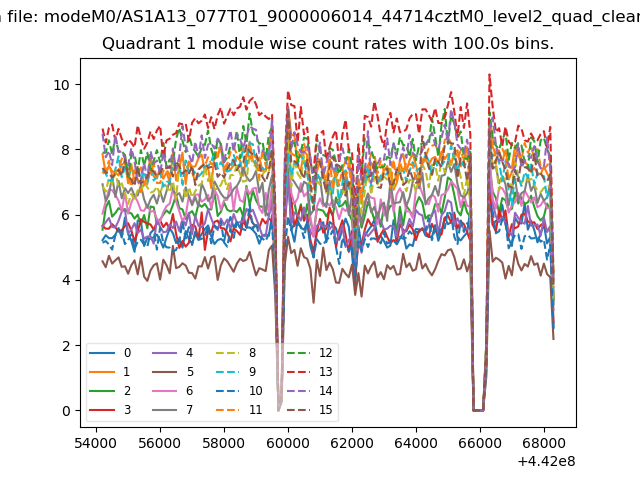
| Module-wise count rates for Quadrant A Data is divided into 100 sec bins |
 |
 |
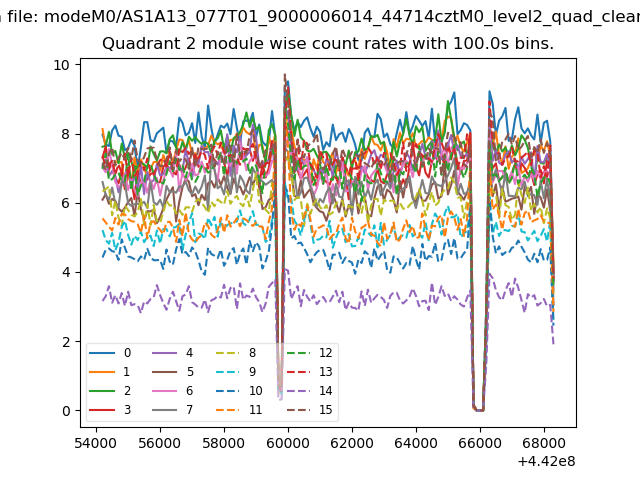
| Module-wise count rates for Quadrant B Data is divided into 100 sec bins |
 |
 |
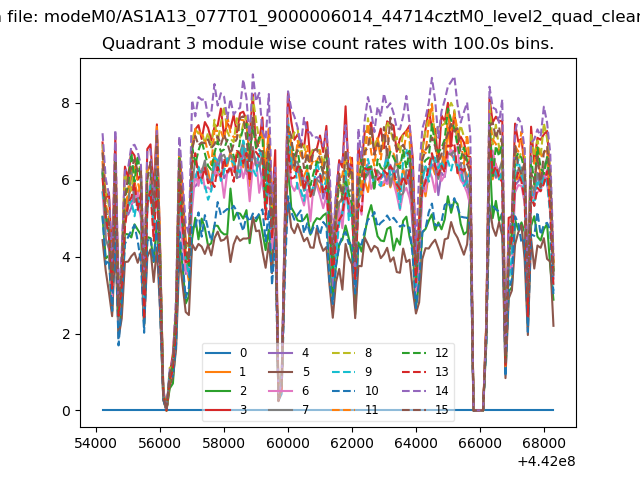
| Module-wise count rates for Quadrant C Data is divided into 100 sec bins |
 |
 |
| Module-wise count rates for Quadrant D Data is divided into 100 sec bins |
 |
 |
| Parameter | Plot |
|---|---|
| CZT HV Monitor | 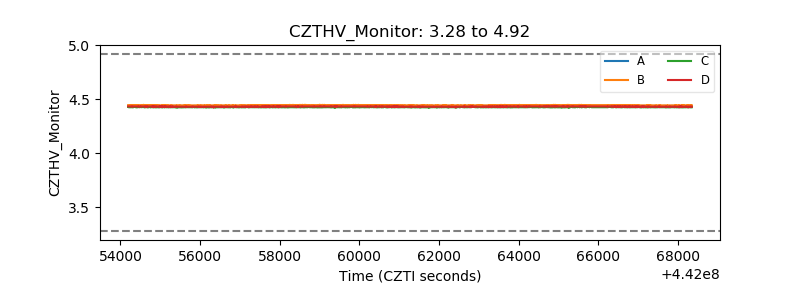 |
| D_VDD | 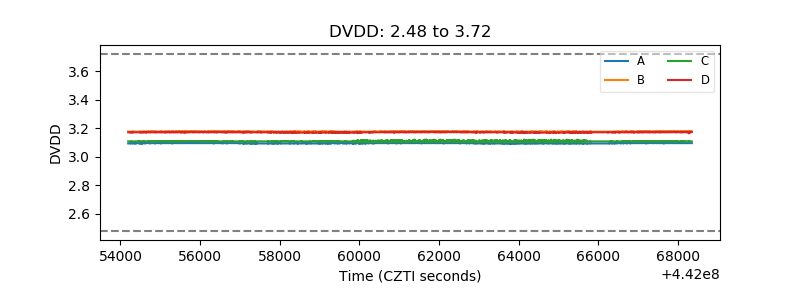 |
| Temperature 1 | 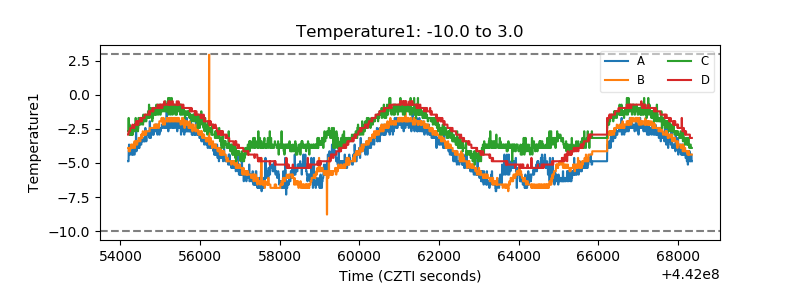 |
| Veto HV Monitor | 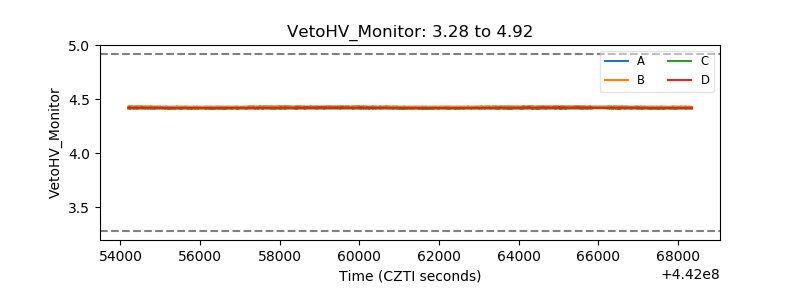 |
| Veto LLD | 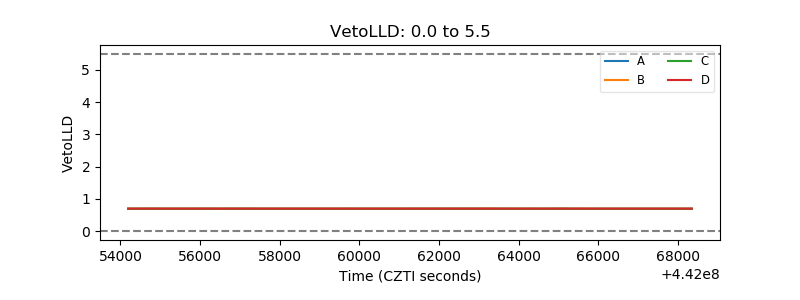 |
| Alpha Counter | 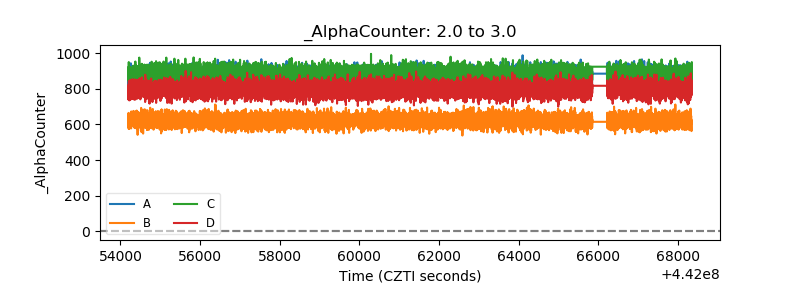 |
| _CPM_Rate | 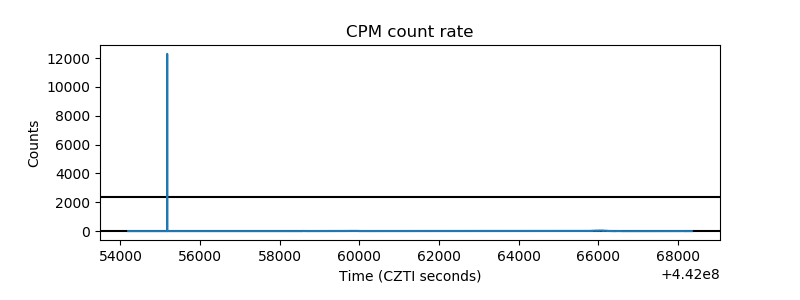 |
| CZT Counter | 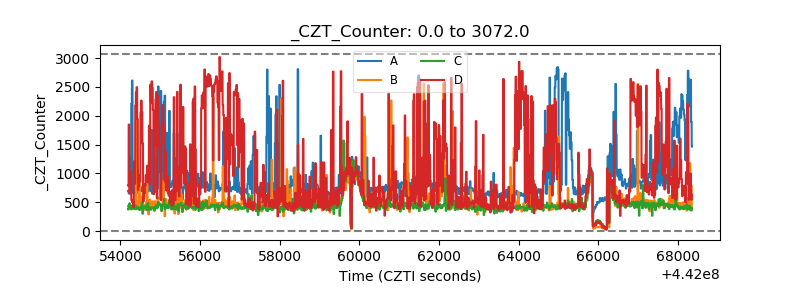 |
| +2.5 Volts monitor | 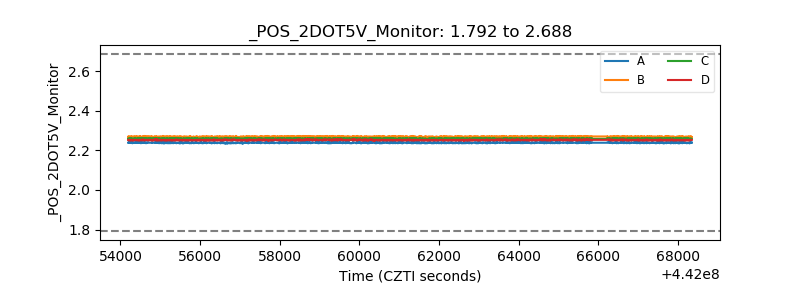 |
| +5 Volts monitor | 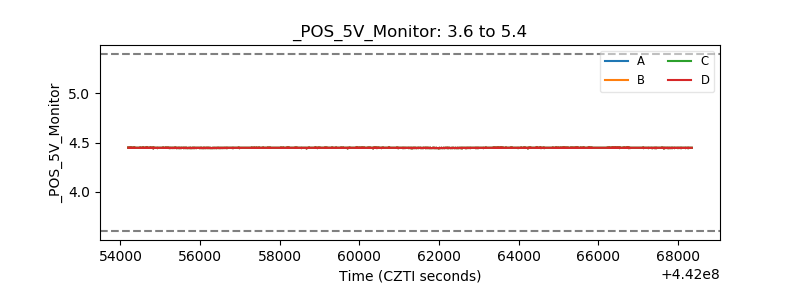 |
| _ROLL_ROT | 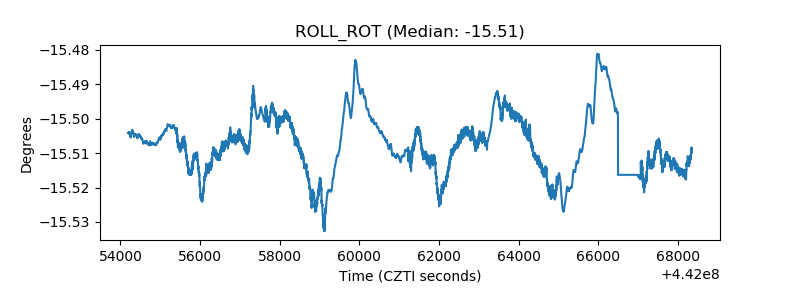 |
| _Roll_DEC | 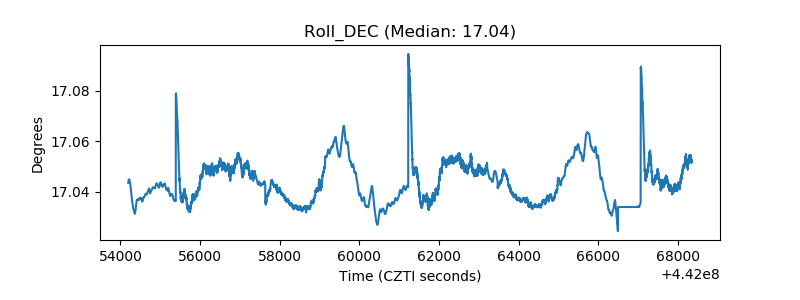 |
| _Roll_RA | 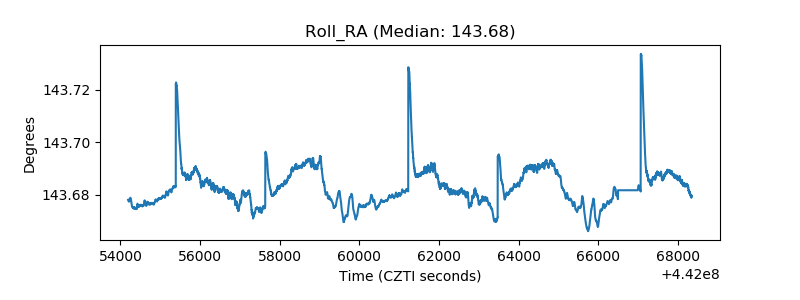 |
| Veto Counter | 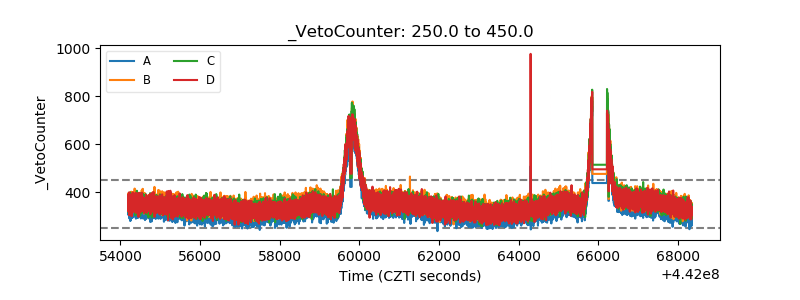 |