| Param | Original file | Final file |
|---|---|---|
| Filename | modeM0/AS1A13_077T01_9000006014_44715cztM0_level2.fits | modeM0/AS1A13_077T01_9000006014_44715cztM0_level2_quad_clean.evt |
| Size (bytes) | 986,247,360 | 168,508,800 |
| Size | 940.6 MB | 160.7 MB |
| Events in quadrant A | 14,973,782 | 961,548 |
| Events in quadrant B | 6,023,390 | 1,202,710 |
| Events in quadrant C | 4,889,731 | 1,164,101 |
| Events in quadrant D | 9,760,080 | 1,003,000 |
| Mode M9 | |||
|---|---|---|---|
| Quadrant | BADHDUFLAG | Total packets | Discarded packets |
| A | 0 | 16 | 0 |
| B | 0 | 16 | 0 |
| C | 0 | 16 | 0 |
| D | 0 | 16 | 0 |
| Mode M0 | |||
|---|---|---|---|
| Quadrant | BADHDUFLAG | Total packets | Discarded packets |
| A | 0 | 52700 | 10 |
| B | 0 | 25347 | 2 |
| C | 0 | 22679 | 2 |
| D | 0 | 36875 | 2 |
| Mode SS | |||
|---|---|---|---|
| Quadrant | BADHDUFLAG | Total packets | Discarded packets |
| A | 0 | 226 | 0 |
| B | 0 | 226 | 0 |
| C | 0 | 226 | 0 |
| D | 0 | 226 | 0 |
| Quadrant | Total seconds | Saturated seconds | Saturation percentage |
|---|---|---|---|
| A | 11128 | 2688 | 24.155284% |
| B | 11131 | 214 | 1.922559% |
| C | 11130 | 60 | 0.539084% |
| D | 11131 | 1004 | 9.019854% |
Noise dominated data is calculated using 1-second bins in cleaned event files. If a bin has >2000 counts, and if more than 50% of those come from <1% of pixels, then it is considered to be noise-dominated and hence unusable.
| Quadrant | # 1 sec bins | Bins with >0 counts | Bins with >2000 counts | High rate bins dominated by noise | Noise dominated (total time) | Noise dominated (detector-on time) | Marked lightcurve |
|---|---|---|---|---|---|---|---|
| A | 12639 | 11131 | 2215 | 2215 | 17.53% | 19.90% | 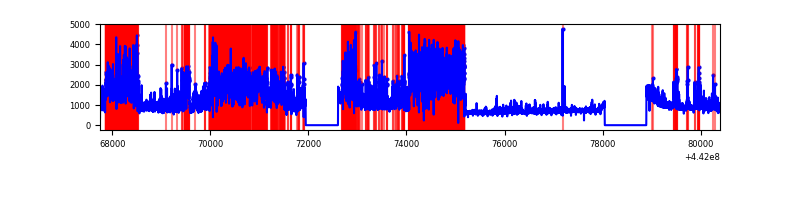 |
| B | 12641 | 11133 | 75 | 75 | 0.59% | 0.67% | 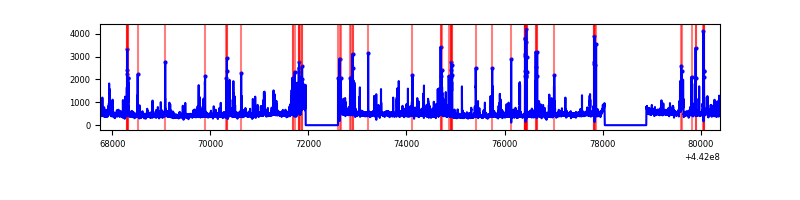 |
| C | 12641 | 11133 | 5 | 5 | 0.04% | 0.04% | 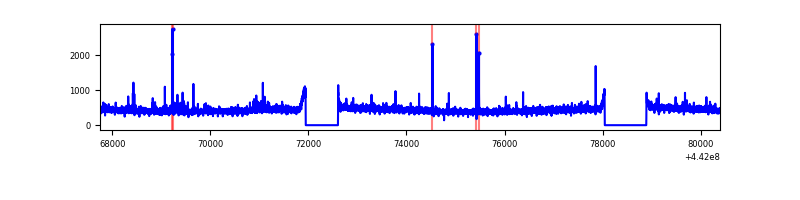 |
| D | 12641 | 11133 | 742 | 742 | 5.87% | 6.66% | 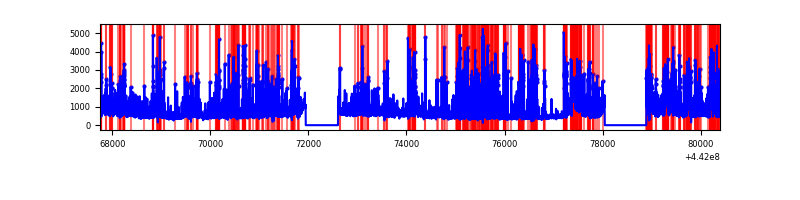 |
Top three noisy pixels from each quadrant. If the there are fewer than three noisy pixels in the level2.evt file, extra rows are filled as -1
| Pixel properties | Quadrant properties | ||||||
|---|---|---|---|---|---|---|---|
| Quadrant | DetID | PixID | Counts | Sigma | Mean | Median | Sigma |
| A | 15 | 223 | 7411681 | 31100.93 | 1143 | 1117 | 238.3 |
| A | 10 | 83 | 3045305 | 12775.96 | 1143 | 1117 | 238.3 |
| A | 13 | 248 | 77356 | 319.96 | 1143 | 1117 | 238.3 |
| B | 5 | 255 | 260151 | 1062.89 | 1235 | 1197 | 243.6 |
| B | 0 | 189 | 145030 | 590.37 | 1235 | 1197 | 243.6 |
| B | 4 | 171 | 143041 | 582.2 | 1235 | 1197 | 243.6 |
| C | 3 | 233 | 49530 | 168.22 | 1220 | 1225 | 287.2 |
| C | 14 | 254 | 40129 | 135.48 | 1220 | 1225 | 287.2 |
| C | 0 | 207 | 15341 | 49.16 | 1220 | 1225 | 287.2 |
| D | 13 | 249 | 2210227 | 7429.53 | 1180 | 1145 | 297.3 |
| D | 11 | 241 | 843004 | 2831.32 | 1180 | 1145 | 297.3 |
| D | 1 | 52 | 695629 | 2335.67 | 1180 | 1145 | 297.3 |
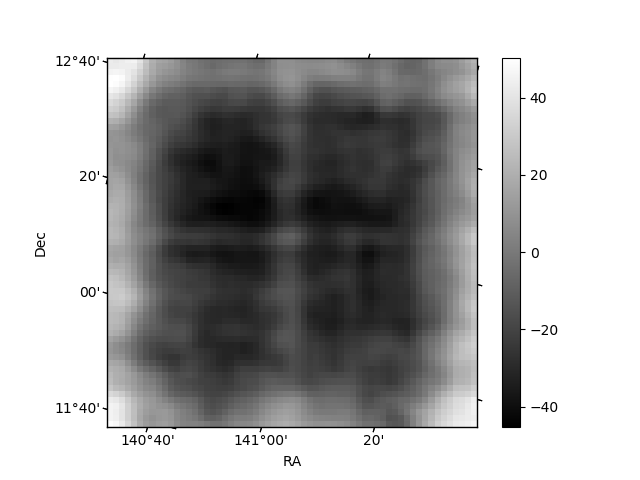
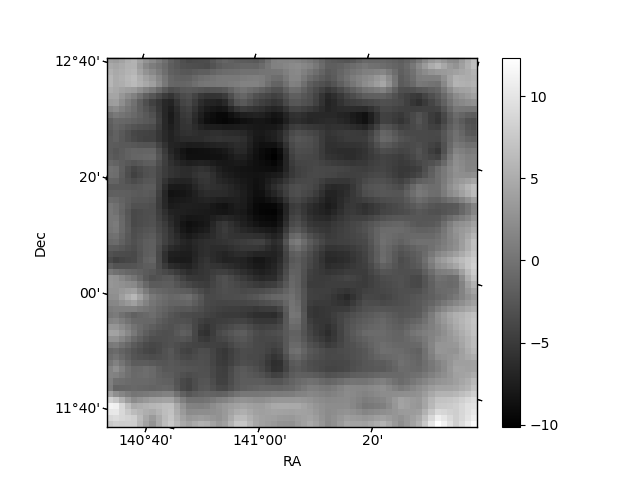
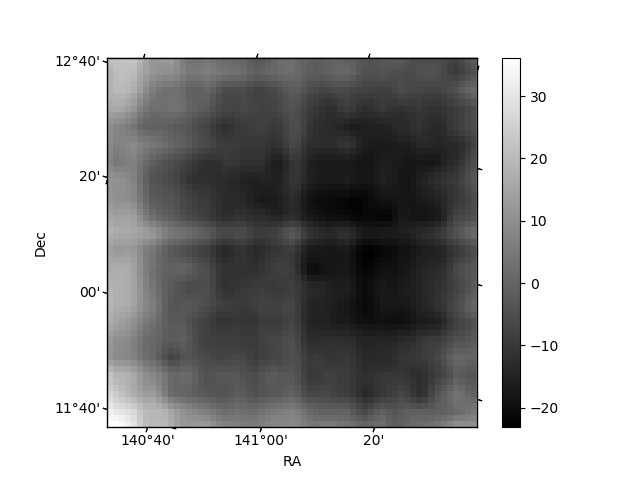
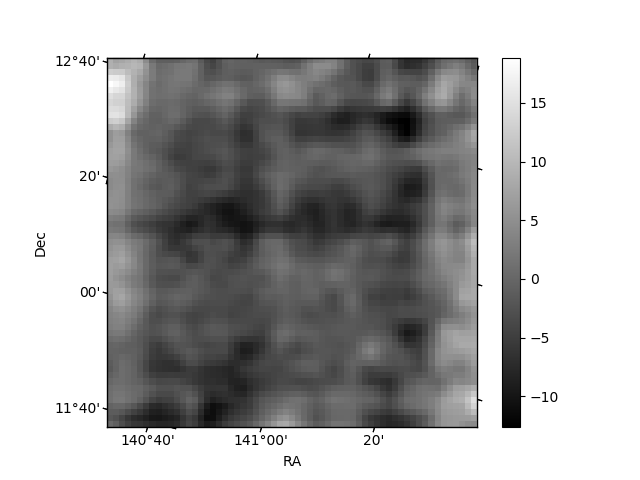
Histogram calculated using DETX and DETY for each event in the final _common_clean file
| Quadrant A | 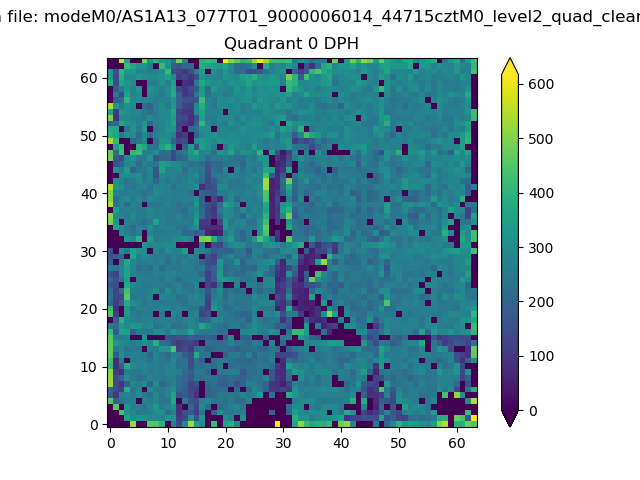 |
 |
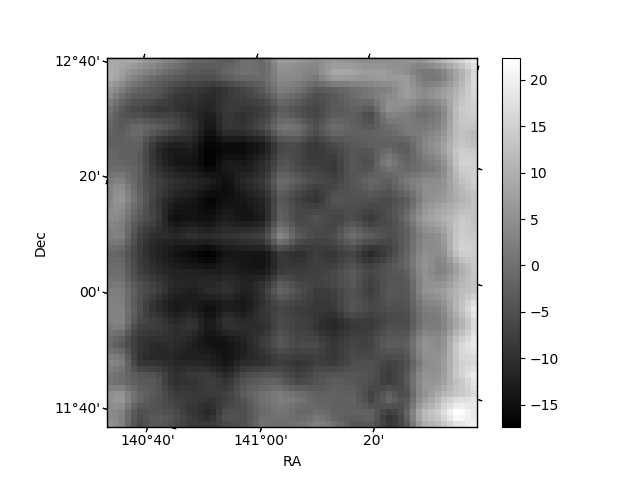
Quadrant B |
|---|---|---|---|
| Quadrant D | 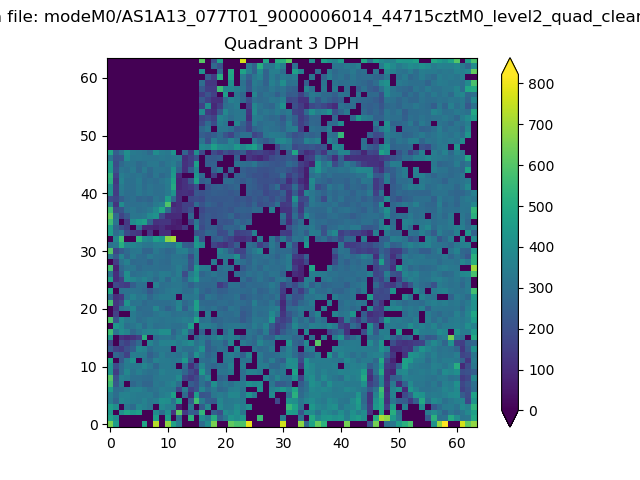 |
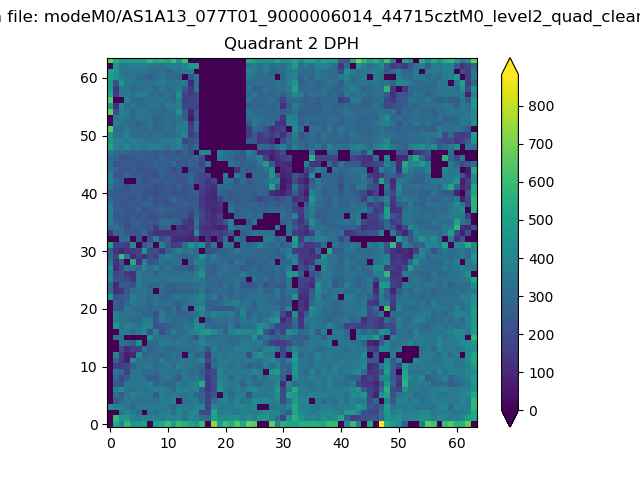 |
Quadrant C |
| Plot type | Count rate plots | Images |
|---|---|---|
| Comparison with Poisson distribution Blue bars denote a histogram of data divided into 1 sec bins. Red curve is a Poisson curve with rate = median count rate of data. |
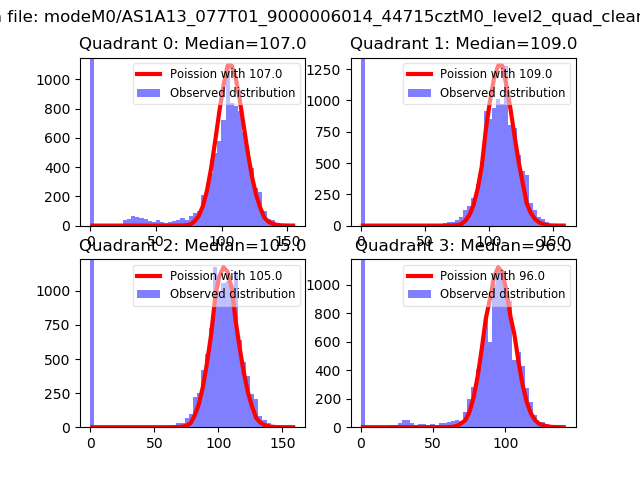 |
 |
| Quadrant-wise count rates Data is divided into 100 sec bins |
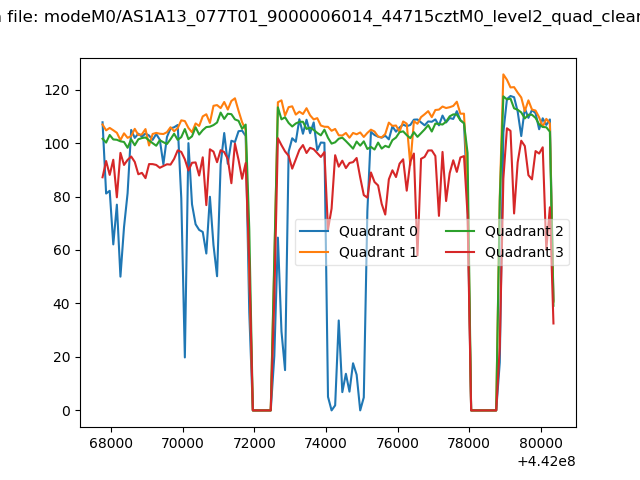 |
|
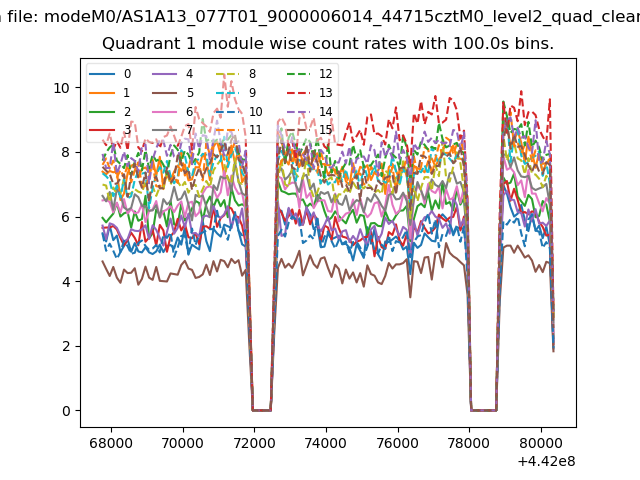
| Module-wise count rates for Quadrant A Data is divided into 100 sec bins |
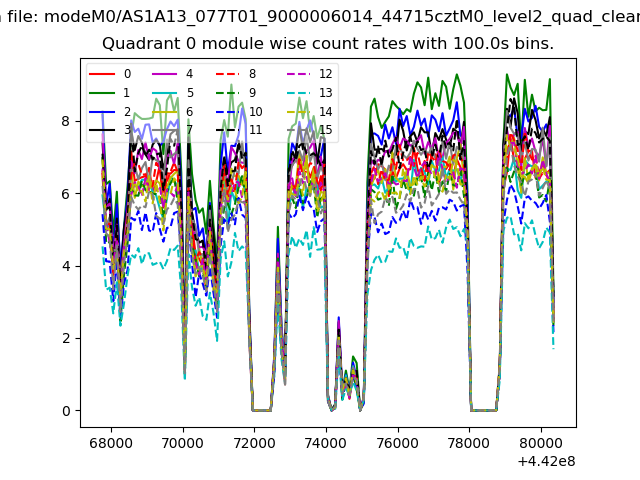 |
 |
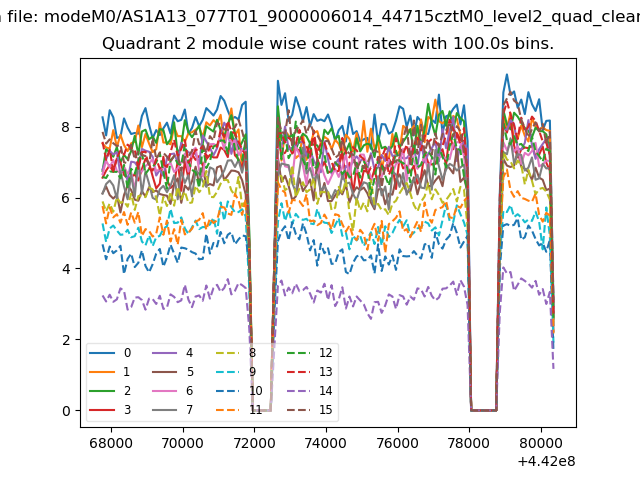
| Module-wise count rates for Quadrant B Data is divided into 100 sec bins |
 |
 |
| Module-wise count rates for Quadrant C Data is divided into 100 sec bins |
 |
 |
| Module-wise count rates for Quadrant D Data is divided into 100 sec bins |
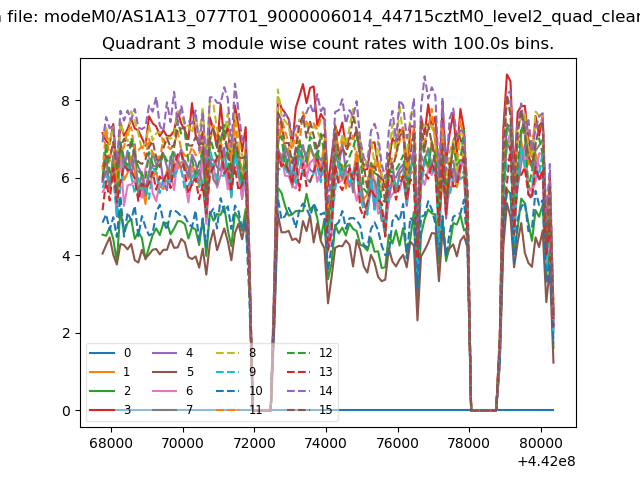 |
 |
| Parameter | Plot |
|---|---|
| CZT HV Monitor | 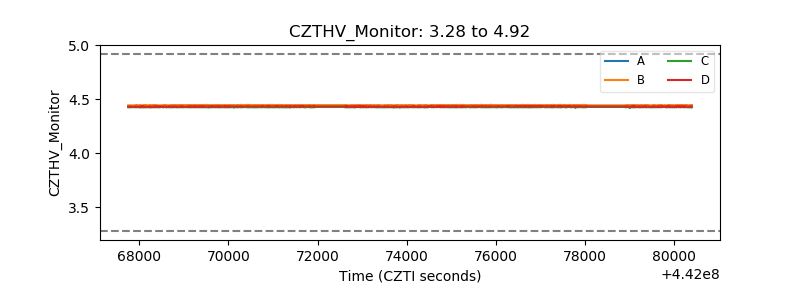 |
| D_VDD | 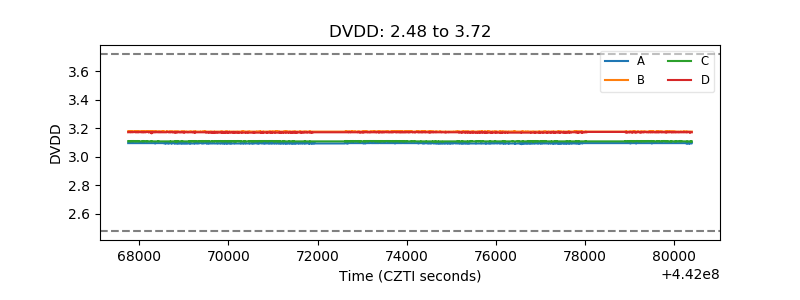 |
| Temperature 1 | 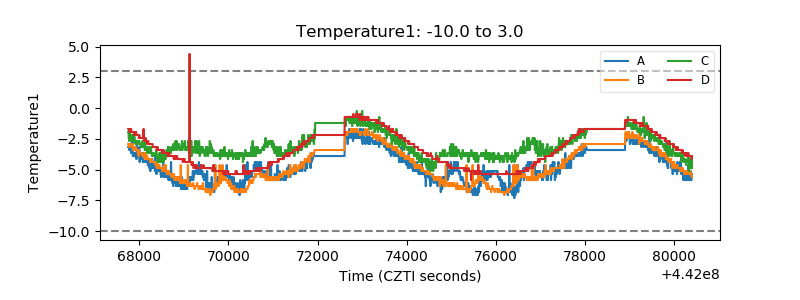 |
| Veto HV Monitor |  |
| Veto LLD | 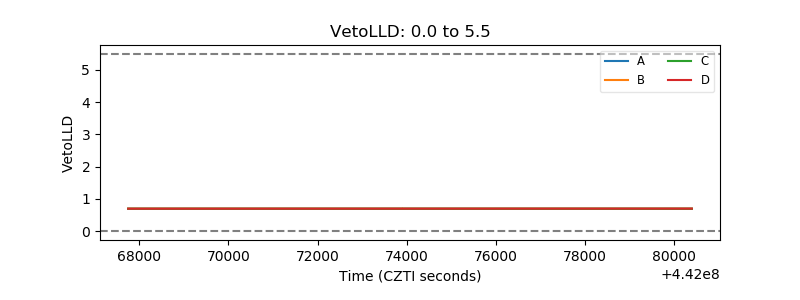 |
| Alpha Counter | 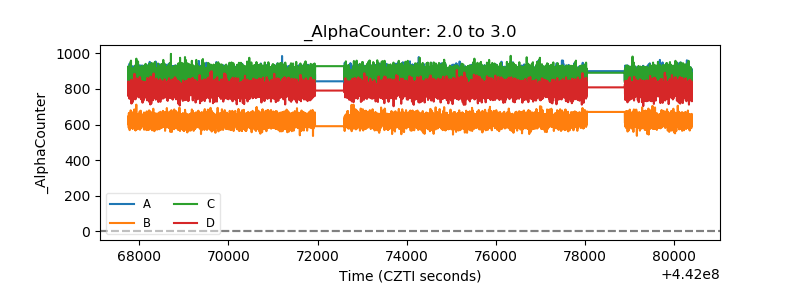 |
| _CPM_Rate | 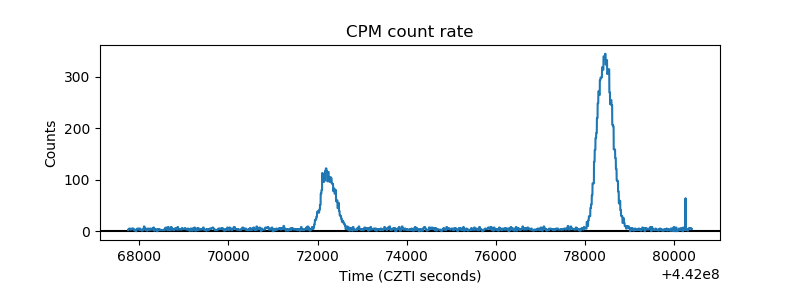 |
| CZT Counter | 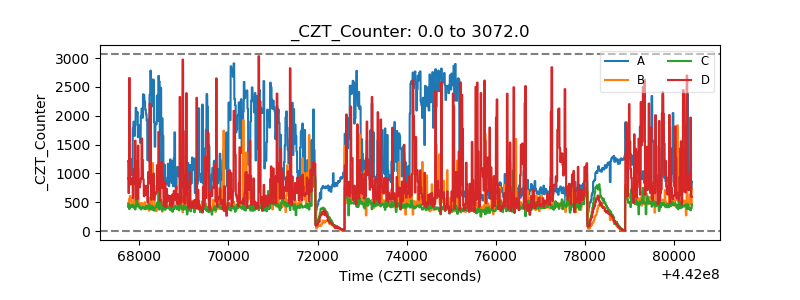 |
| +2.5 Volts monitor | 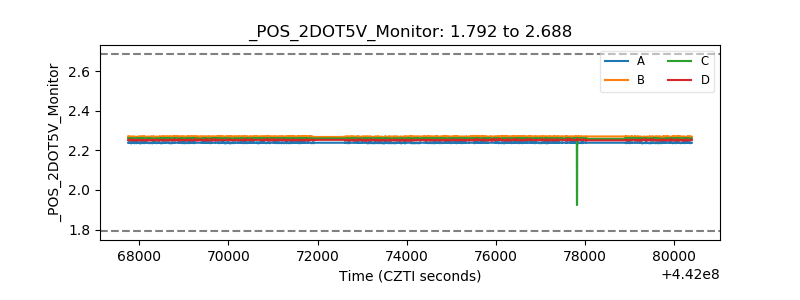 |
| +5 Volts monitor | 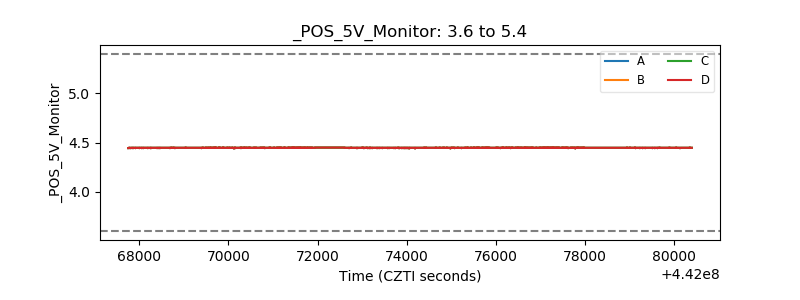 |
| _ROLL_ROT | 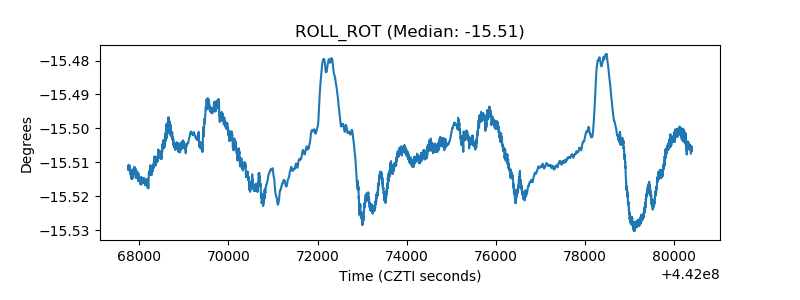 |
| _Roll_DEC | 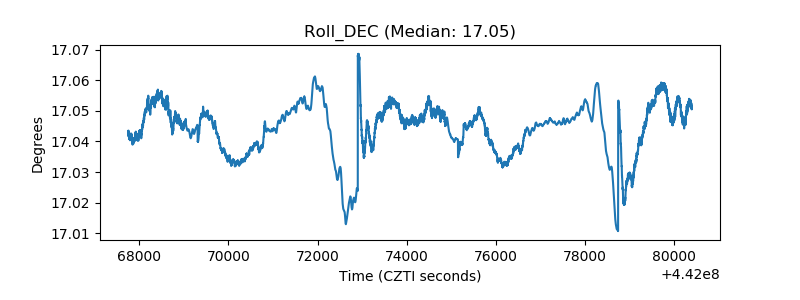 |
| _Roll_RA | 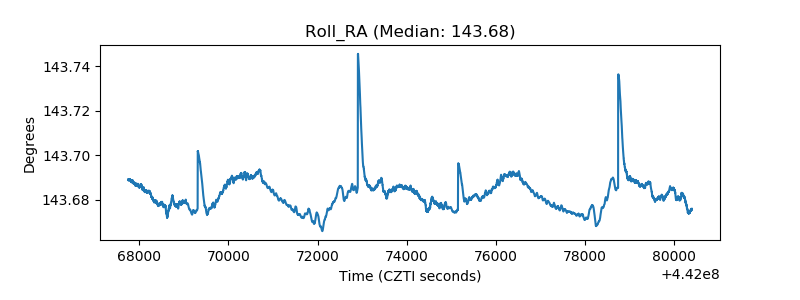 |
| Veto Counter | 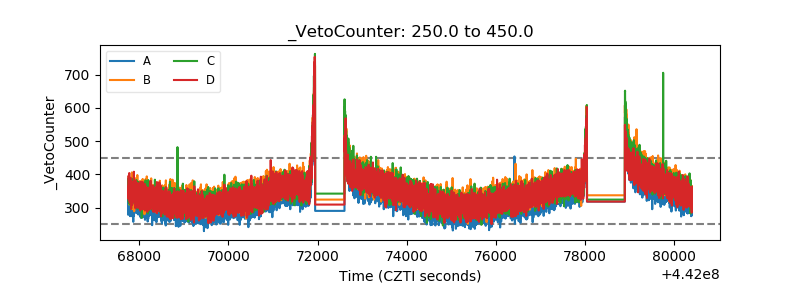 |