| Param | Original file | Final file |
|---|---|---|
| Filename | modeM0/AS1A13_077T01_9000006014_44716cztM0_level2.fits | modeM0/AS1A13_077T01_9000006014_44716cztM0_level2_quad_clean.evt |
| Size (bytes) | 631,270,080 | 103,432,320 |
| Size | 602.0 MB | 98.6 MB |
| Events in quadrant A | 7,038,705 | 694,407 |
| Events in quadrant B | 3,929,941 | 744,272 |
| Events in quadrant C | 2,995,867 | 722,639 |
| Events in quadrant D | 8,884,260 | 503,337 |
| Mode M9 | |||
|---|---|---|---|
| Quadrant | BADHDUFLAG | Total packets | Discarded packets |
| A | 0 | 10 | 0 |
| B | 0 | 10 | 0 |
| C | 0 | 10 | 0 |
| D | 0 | 10 | 0 |
| Mode M0 | |||
|---|---|---|---|
| Quadrant | BADHDUFLAG | Total packets | Discarded packets |
| A | 0 | 25804 | 4 |
| B | 0 | 16301 | 2 |
| C | 0 | 13703 | 2 |
| D | 0 | 31063 | 2 |
| Mode SS | |||
|---|---|---|---|
| Quadrant | BADHDUFLAG | Total packets | Discarded packets |
| A | 0 | 136 | 0 |
| B | 0 | 136 | 0 |
| C | 0 | 136 | 0 |
| D | 0 | 136 | 0 |
| Quadrant | Total seconds | Saturated seconds | Saturation percentage |
|---|---|---|---|
| A | 6695 | 654 | 9.768484% |
| B | 6696 | 175 | 2.613501% |
| C | 6696 | 20 | 0.298686% |
| D | 6696 | 1861 | 27.792712% |
Noise dominated data is calculated using 1-second bins in cleaned event files. If a bin has >2000 counts, and if more than 50% of those come from <1% of pixels, then it is considered to be noise-dominated and hence unusable.
| Quadrant | # 1 sec bins | Bins with >0 counts | Bins with >2000 counts | High rate bins dominated by noise | Noise dominated (total time) | Noise dominated (detector-on time) | Marked lightcurve |
|---|---|---|---|---|---|---|---|
| A | 7690 | 6696 | 372 | 372 | 4.84% | 5.56% | 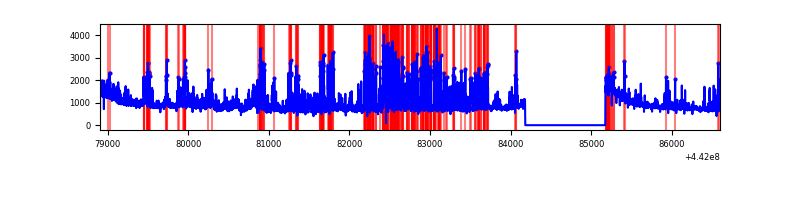 |
| B | 7691 | 6697 | 78 | 78 | 1.01% | 1.16% | 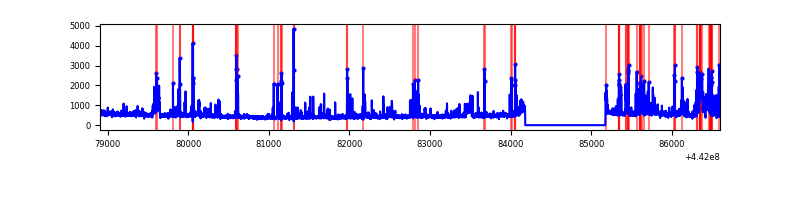 |
| C | 7691 | 6697 | 1 | 1 | 0.01% | 0.01% | 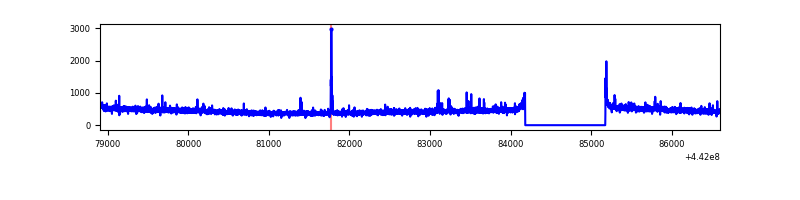 |
| D | 7691 | 6697 | 1639 | 1639 | 21.31% | 24.47% | 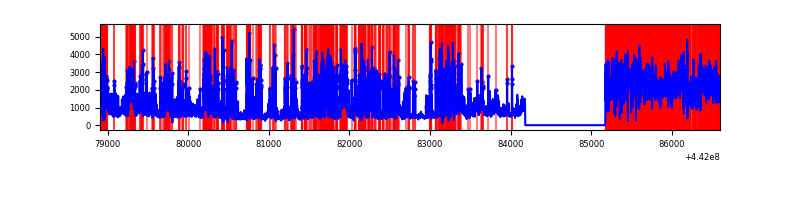 |
Top three noisy pixels from each quadrant. If the there are fewer than three noisy pixels in the level2.evt file, extra rows are filled as -1
| Pixel properties | Quadrant properties | ||||||
|---|---|---|---|---|---|---|---|
| Quadrant | DetID | PixID | Counts | Sigma | Mean | Median | Sigma |
| A | 10 | 83 | 2072423 | 13389.03 | 745 | 731 | 154.7 |
| A | 15 | 223 | 2048619 | 13235.19 | 745 | 731 | 154.7 |
| A | 13 | 248 | 29060 | 183.09 | 745 | 731 | 154.7 |
| B | 4 | 171 | 362779 | 2436.35 | 757 | 734 | 148.6 |
| B | 0 | 189 | 140671 | 941.69 | 757 | 734 | 148.6 |
| B | 0 | 186 | 101736 | 679.68 | 757 | 734 | 148.6 |
| C | 14 | 254 | 29441 | 161.56 | 750 | 753 | 177.6 |
| C | 3 | 233 | 18523 | 100.07 | 750 | 753 | 177.6 |
| C | 12 | 2 | 9531 | 49.43 | 750 | 753 | 177.6 |
| D | 11 | 241 | 2572320 | 15444.05 | 658 | 639 | 166.5 |
| D | 13 | 249 | 1350310 | 8105.35 | 658 | 639 | 166.5 |
| D | 1 | 52 | 1075706 | 6456.24 | 658 | 639 | 166.5 |
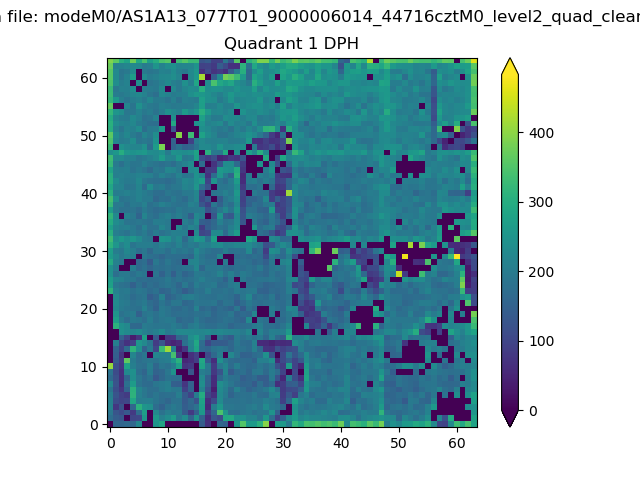
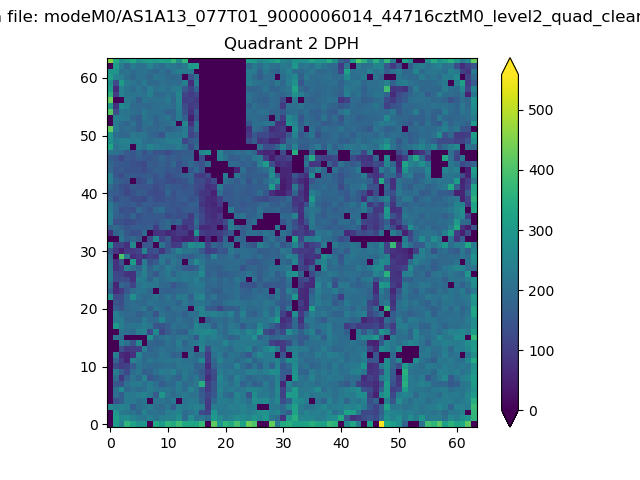
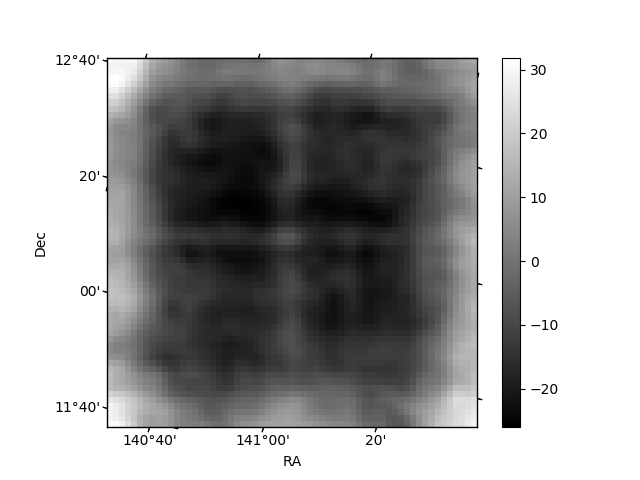
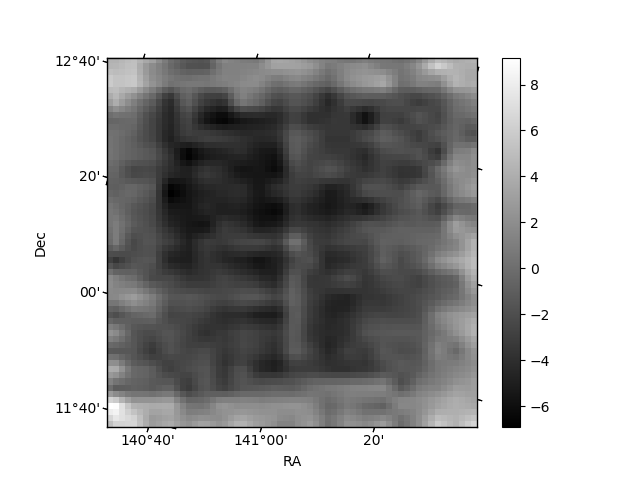
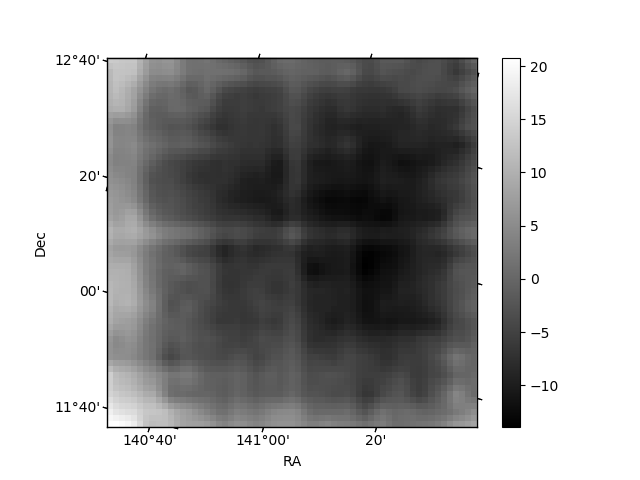
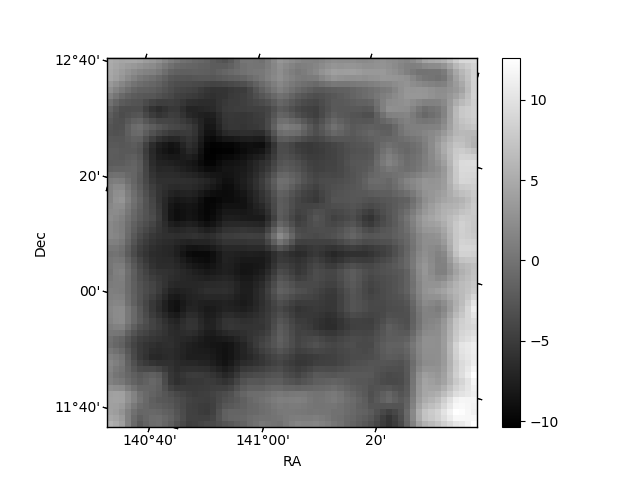
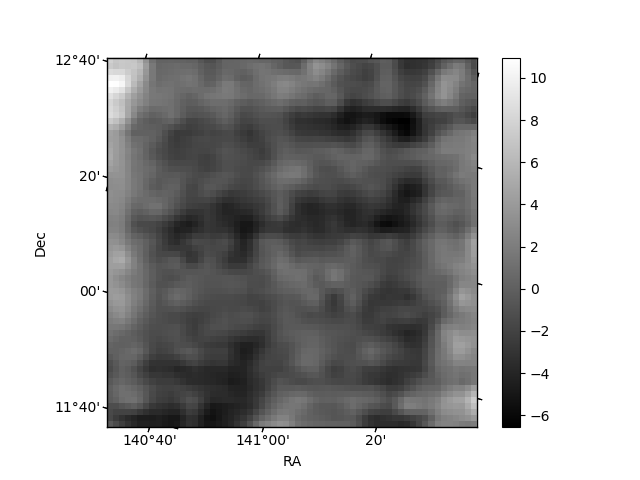
Histogram calculated using DETX and DETY for each event in the final _common_clean file
| Quadrant A |  |
 |
Quadrant B |
|---|---|---|---|
| Quadrant D | 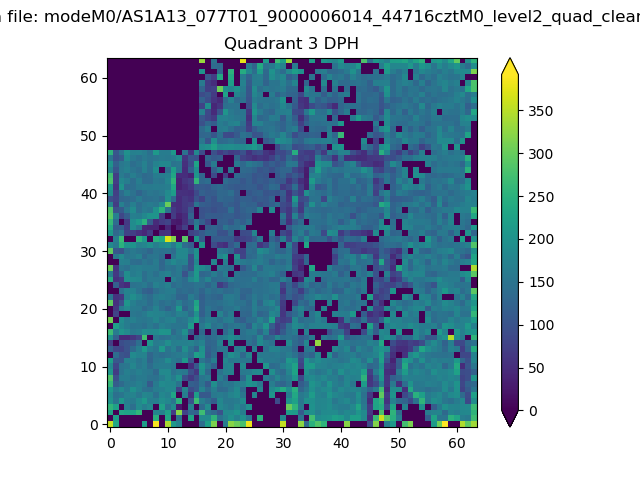 |
 |
Quadrant C |
| Plot type | Count rate plots | Images |
|---|---|---|
| Comparison with Poisson distribution Blue bars denote a histogram of data divided into 1 sec bins. Red curve is a Poisson curve with rate = median count rate of data. |
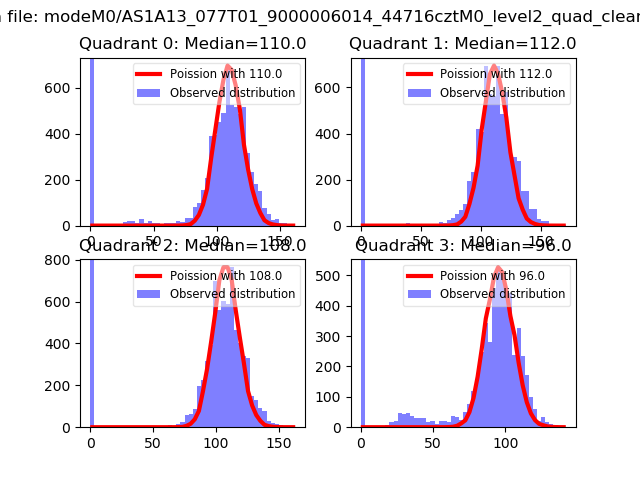 |
 |
| Quadrant-wise count rates Data is divided into 100 sec bins |
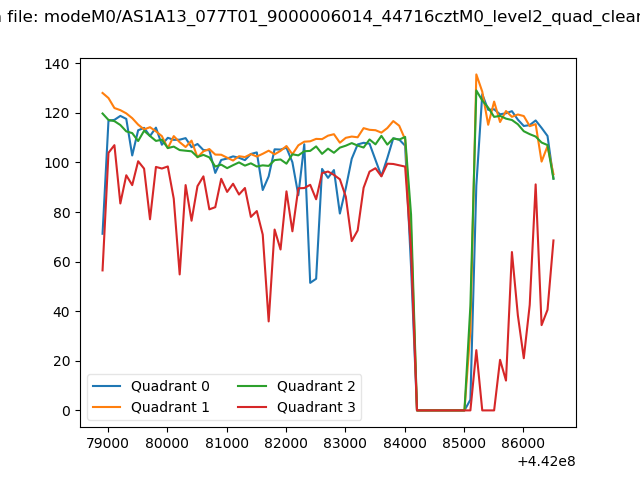 |
|
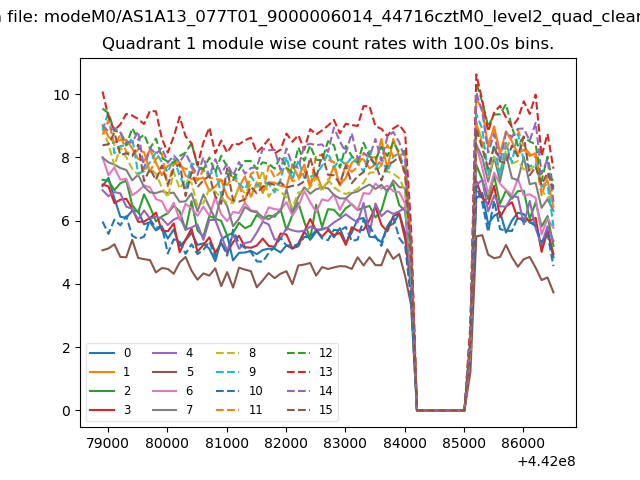
| Module-wise count rates for Quadrant A Data is divided into 100 sec bins |
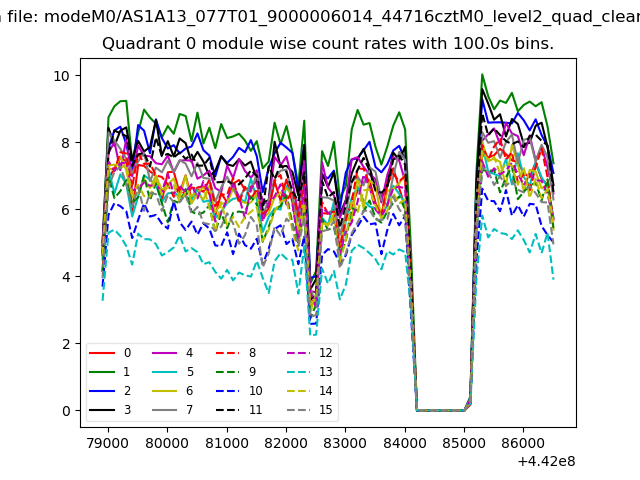 |
 |
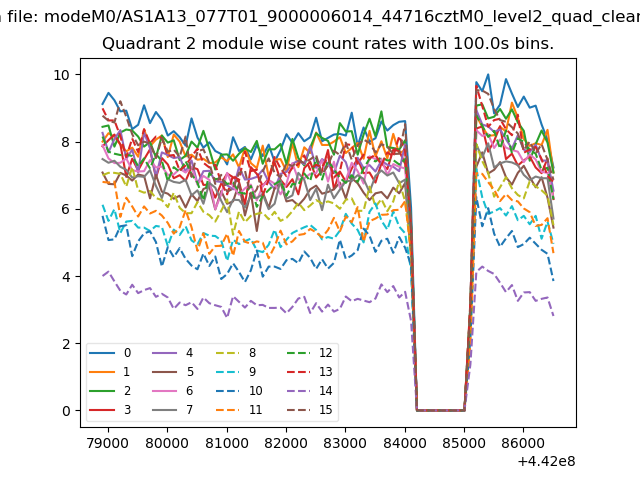
| Module-wise count rates for Quadrant B Data is divided into 100 sec bins |
 |
 |
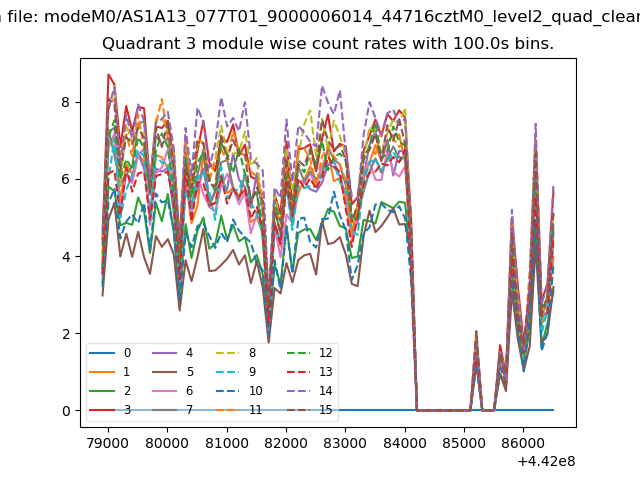
| Module-wise count rates for Quadrant C Data is divided into 100 sec bins |
 |
 |
| Module-wise count rates for Quadrant D Data is divided into 100 sec bins |
 |
 |
| Parameter | Plot |
|---|---|
| CZT HV Monitor | 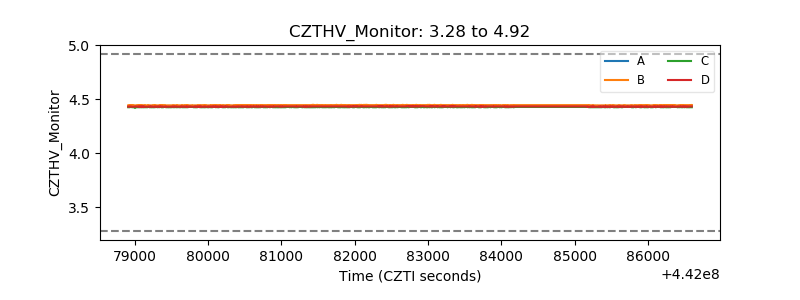 |
| D_VDD | 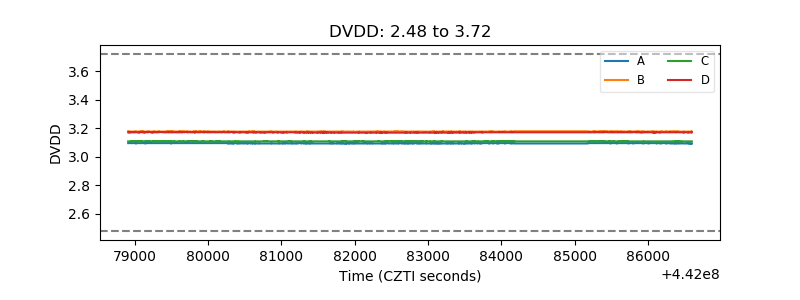 |
| Temperature 1 | 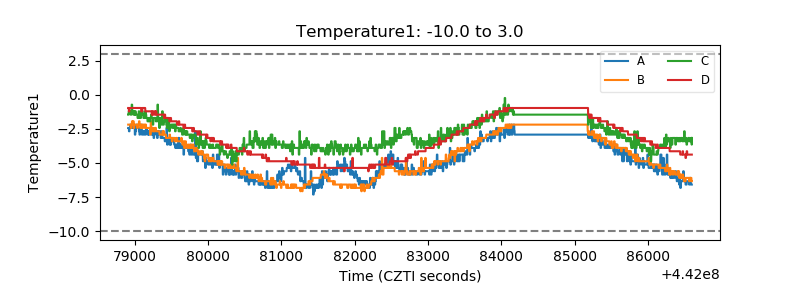 |
| Veto HV Monitor | 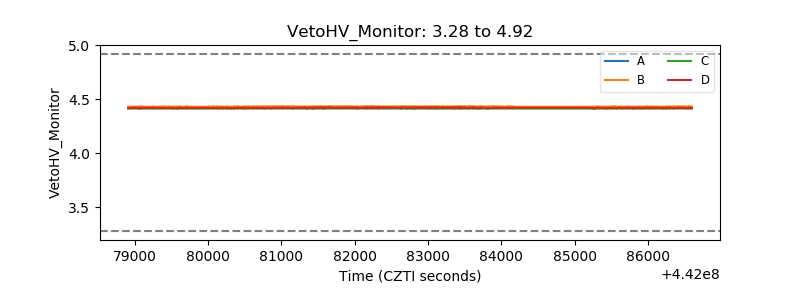 |
| Veto LLD | 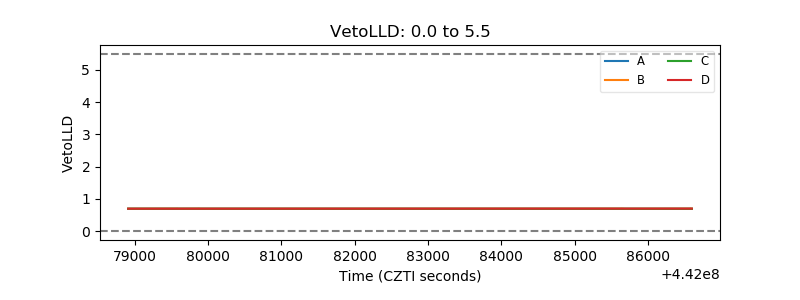 |
| Alpha Counter | 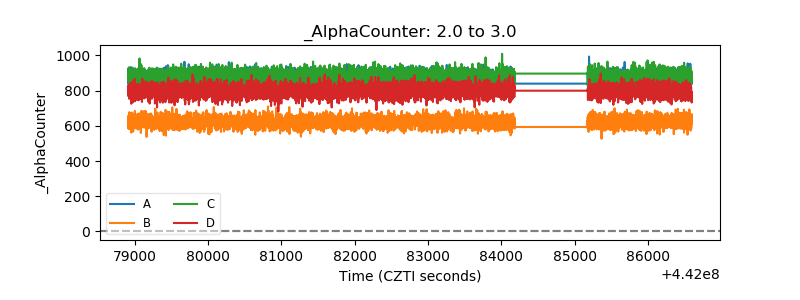 |
| _CPM_Rate | 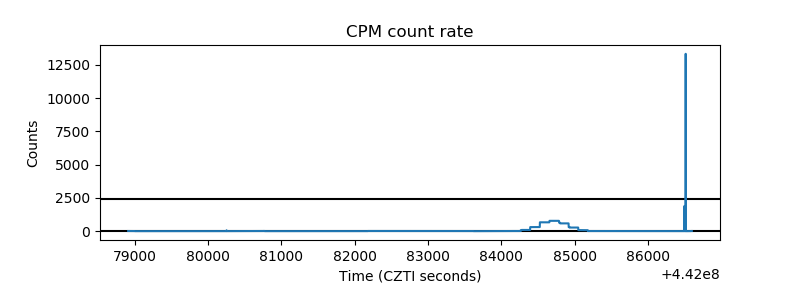 |
| CZT Counter | 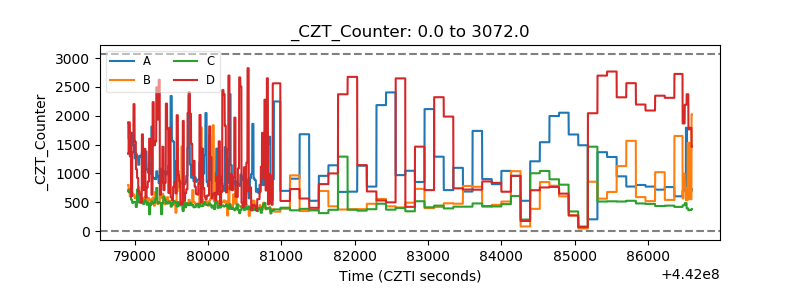 |
| +2.5 Volts monitor | 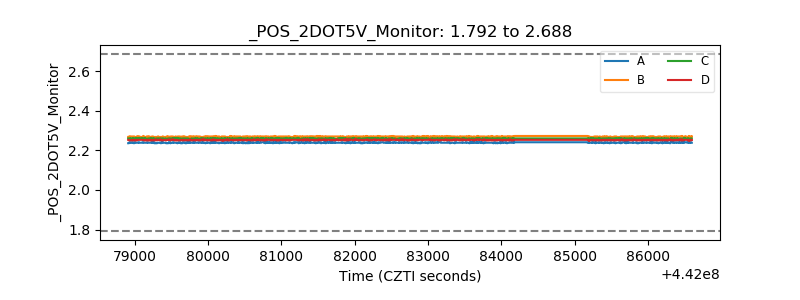 |
| +5 Volts monitor | 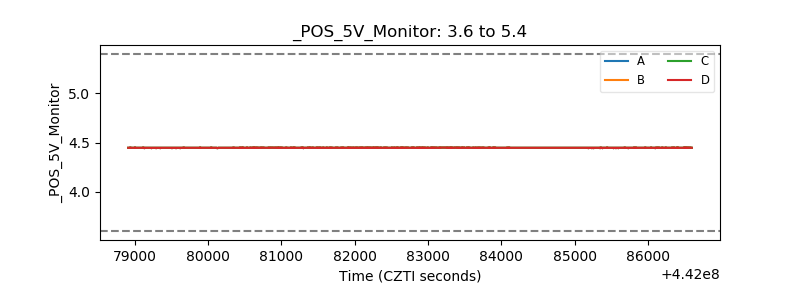 |
| _ROLL_ROT | 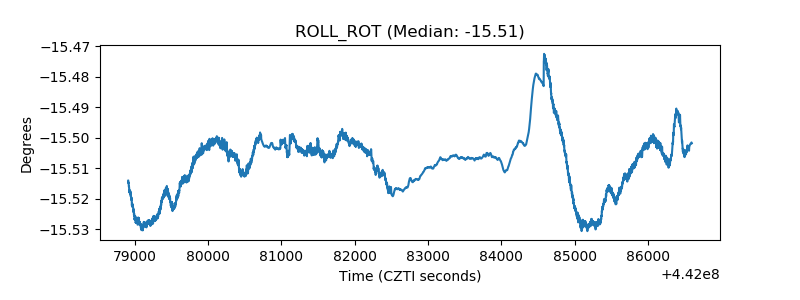 |
| _Roll_DEC | 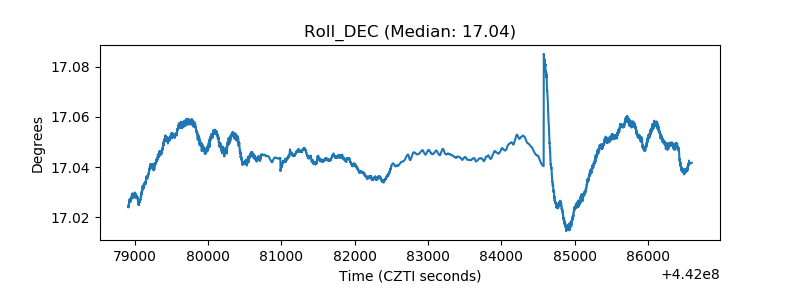 |
| _Roll_RA | 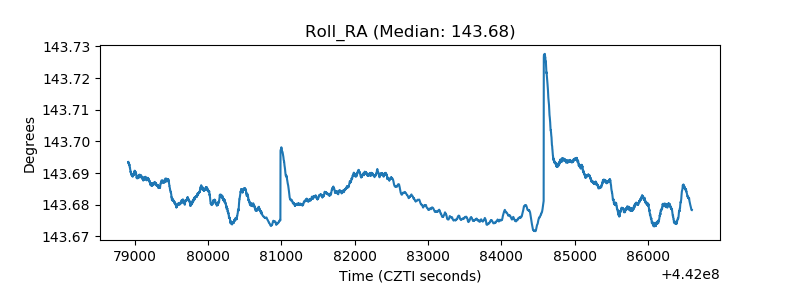 |
| Veto Counter | 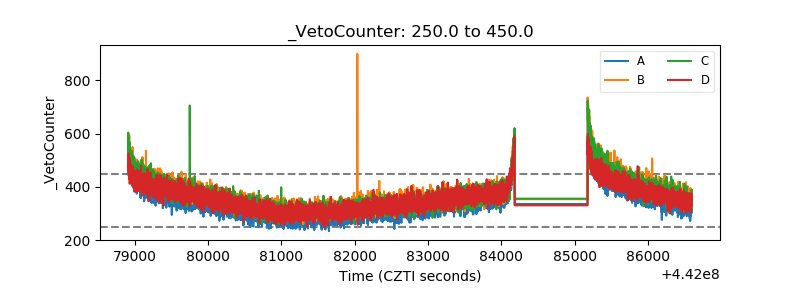 |