| Param | Original file | Final file |
|---|---|---|
| Filename | modeM0/AS1A13_080T01_9000006012_44697cztM0_level2.fits | modeM0/AS1A13_080T01_9000006012_44697cztM0_level2_quad_clean.evt |
| Size (bytes) | 375,880,320 | 70,937,280 |
| Size | 358.5 MB | 67.7 MB |
| Events in quadrant A | 3,254,267 | 483,483 |
| Events in quadrant B | 2,274,498 | 494,287 |
| Events in quadrant C | 1,890,610 | 470,674 |
| Events in quadrant D | 6,136,840 | 376,100 |
| Mode SS | |||
|---|---|---|---|
| Quadrant | BADHDUFLAG | Total packets | Discarded packets |
| A | 0 | 92 | 0 |
| B | 0 | 92 | 0 |
| C | 0 | 92 | 0 |
| D | 0 | 92 | 0 |
| Mode M0 | |||
|---|---|---|---|
| Quadrant | BADHDUFLAG | Total packets | Discarded packets |
| A | 0 | 13723 | 0 |
| B | 0 | 9914 | 0 |
| C | 0 | 9268 | 0 |
| D | 0 | 21365 | 0 |
| Quadrant | Total seconds | Saturated seconds | Saturation percentage |
|---|---|---|---|
| A | 4599 | 2 | 0.043488% |
| B | 4600 | 38 | 0.826087% |
| C | 4600 | 4 | 0.086957% |
| D | 4600 | 816 | 17.739130% |
Noise dominated data is calculated using 1-second bins in cleaned event files. If a bin has >2000 counts, and if more than 50% of those come from <1% of pixels, then it is considered to be noise-dominated and hence unusable.
| Quadrant | # 1 sec bins | Bins with >0 counts | Bins with >2000 counts | High rate bins dominated by noise | Noise dominated (total time) | Noise dominated (detector-on time) | Marked lightcurve |
|---|---|---|---|---|---|---|---|
| A | 4599 | 4599 | 1 | 1 | 0.02% | 0.02% | 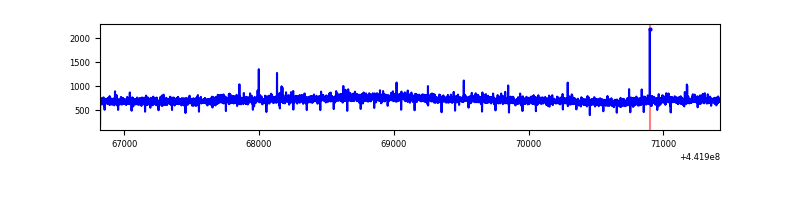 |
| B | 4600 | 4600 | 23 | 23 | 0.50% | 0.50% | 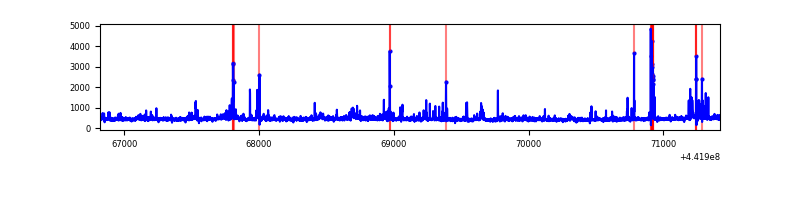 |
| C | 4600 | 4600 | 3 | 3 | 0.07% | 0.07% | 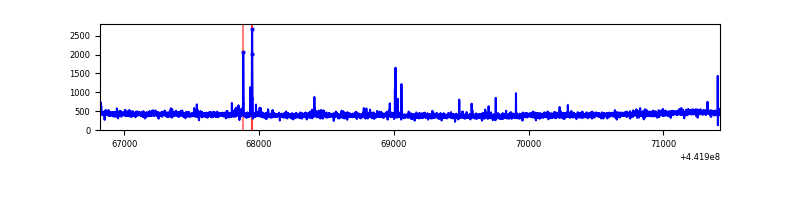 |
| D | 4600 | 4600 | 913 | 913 | 19.85% | 19.85% | 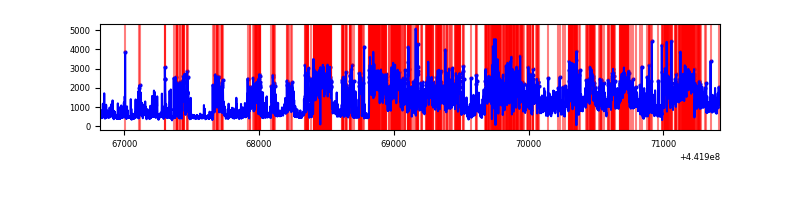 |
Top three noisy pixels from each quadrant. If the there are fewer than three noisy pixels in the level2.evt file, extra rows are filled as -1
| Pixel properties | Quadrant properties | ||||||
|---|---|---|---|---|---|---|---|
| Quadrant | DetID | PixID | Counts | Sigma | Mean | Median | Sigma |
| A | 10 | 83 | 1350889 | 13318.05 | 482 | 472 | 101.4 |
| A | 15 | 223 | 18666 | 179.43 | 482 | 472 | 101.4 |
| A | 0 | 243 | 10065 | 94.61 | 482 | 472 | 101.4 |
| B | 0 | 189 | 70206 | 731.24 | 481 | 468 | 95.4 |
| B | 5 | 172 | 69827 | 727.27 | 481 | 468 | 95.4 |
| B | 0 | 183 | 51629 | 536.45 | 481 | 468 | 95.4 |
| C | 0 | 207 | 15467 | 134.63 | 468 | 470 | 111.4 |
| C | 14 | 254 | 14952 | 130.01 | 468 | 470 | 111.4 |
| C | 3 | 233 | 12183 | 105.15 | 468 | 470 | 111.4 |
| D | 11 | 241 | 2613992 | 22922.48 | 443 | 427 | 114.0 |
| D | 1 | 52 | 519836 | 4555.52 | 443 | 427 | 114.0 |
| D | 2 | 249 | 366437 | 3210.12 | 443 | 427 | 114.0 |
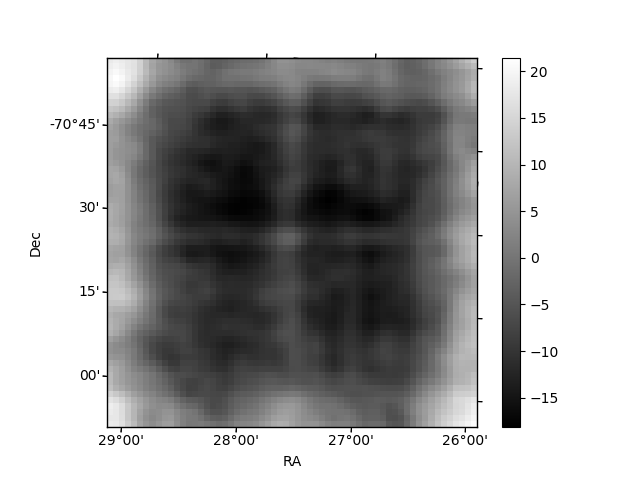
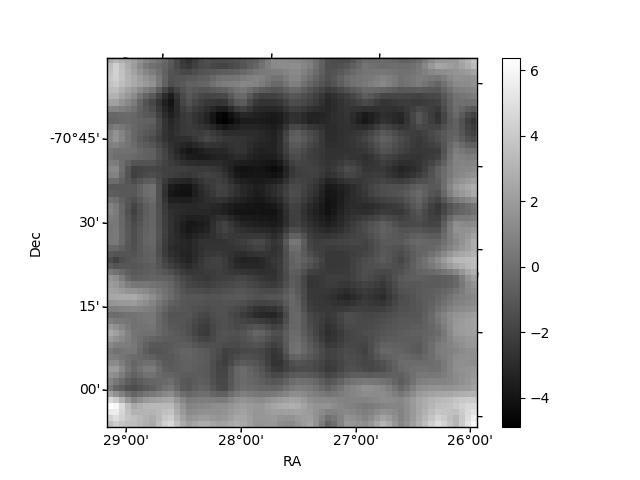
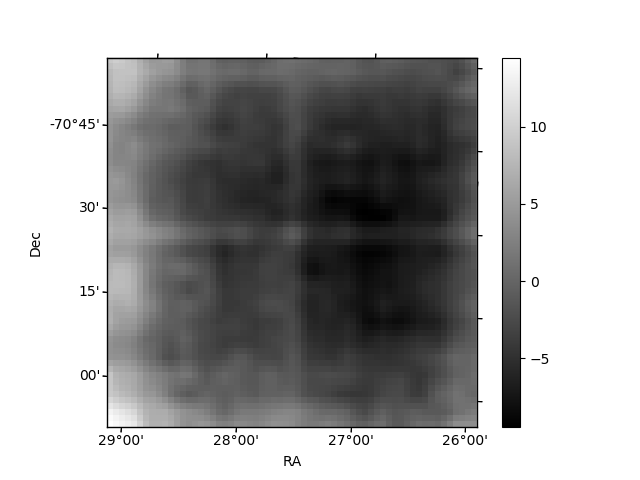
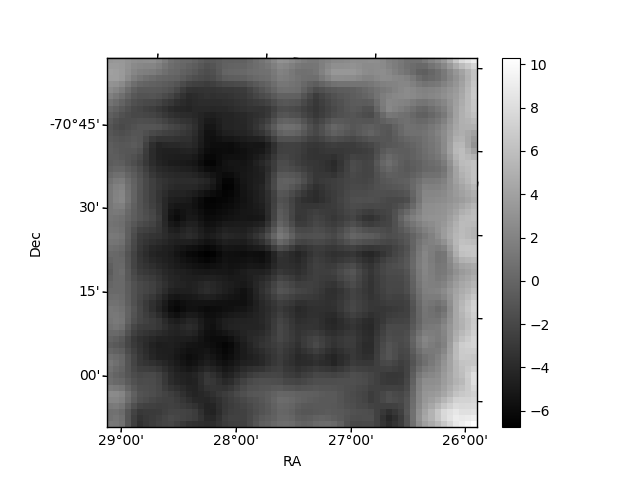
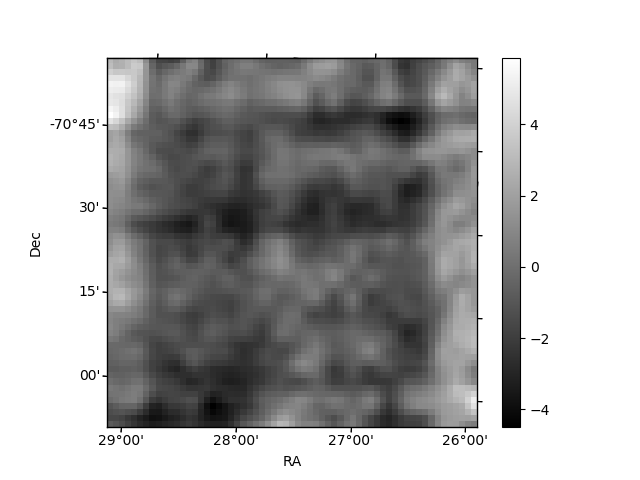
Histogram calculated using DETX and DETY for each event in the final _common_clean file
| Quadrant A | 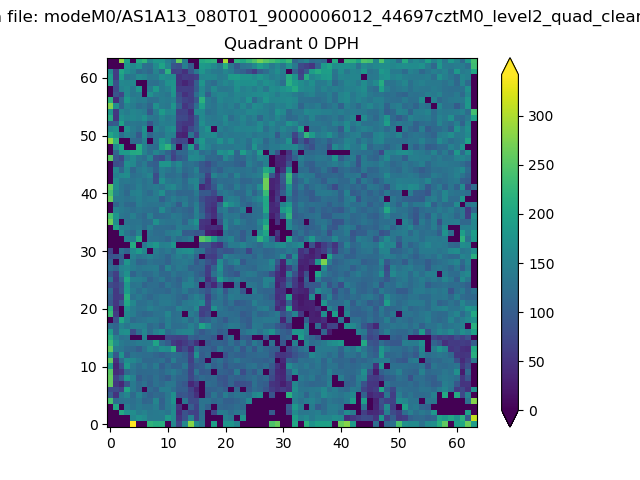 |
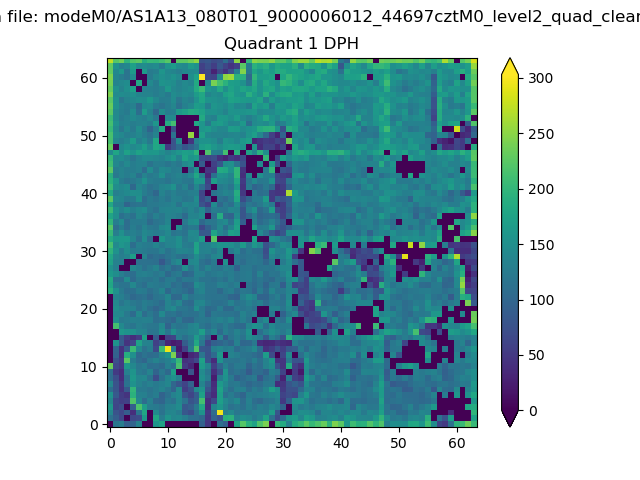 |
Quadrant B |
|---|---|---|---|
| Quadrant D | 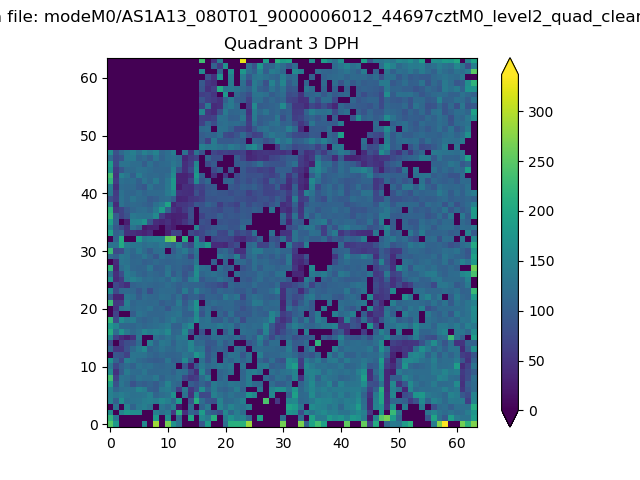 |
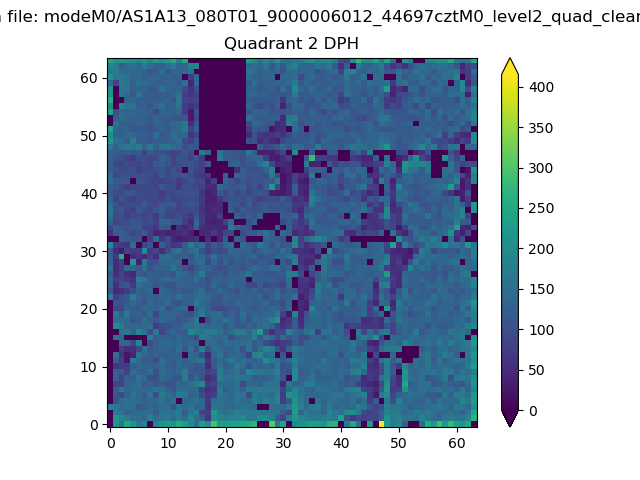 |
Quadrant C |
| Plot type | Count rate plots | Images |
|---|---|---|
| Comparison with Poisson distribution Blue bars denote a histogram of data divided into 1 sec bins. Red curve is a Poisson curve with rate = median count rate of data. |
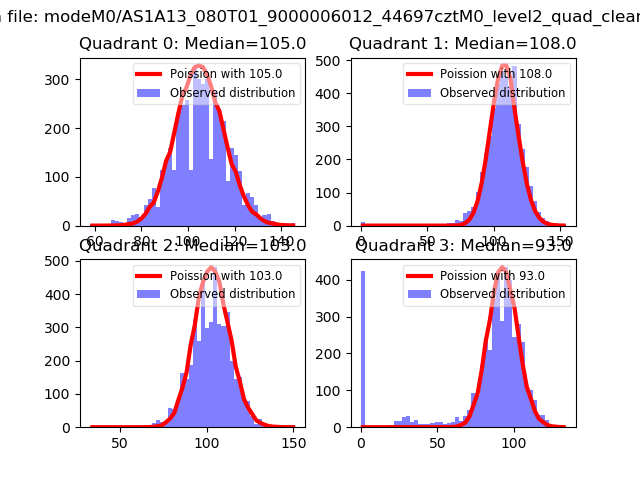 |
 |
| Quadrant-wise count rates Data is divided into 100 sec bins |
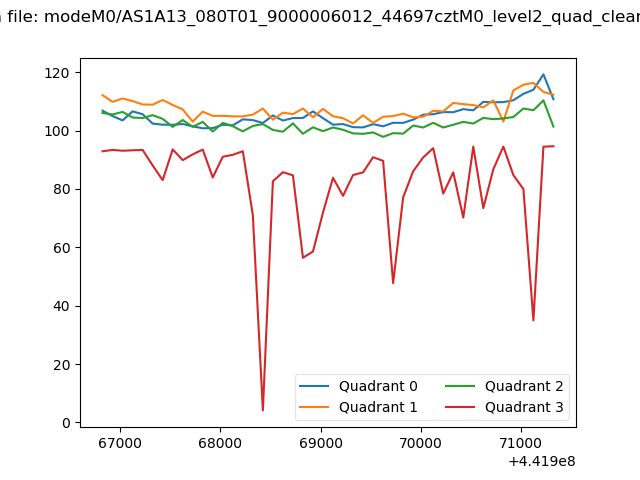 |
|
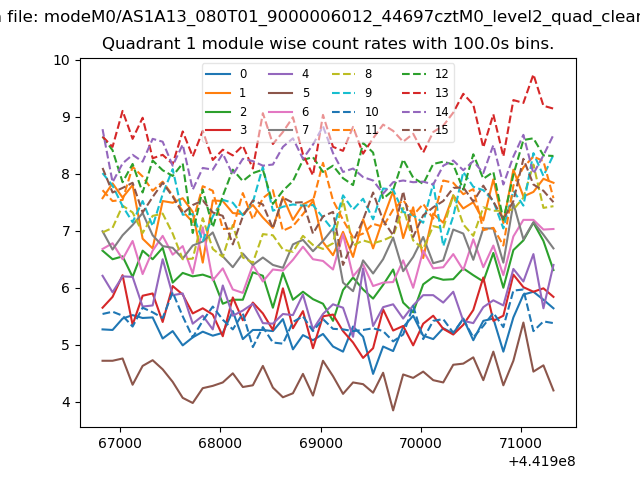
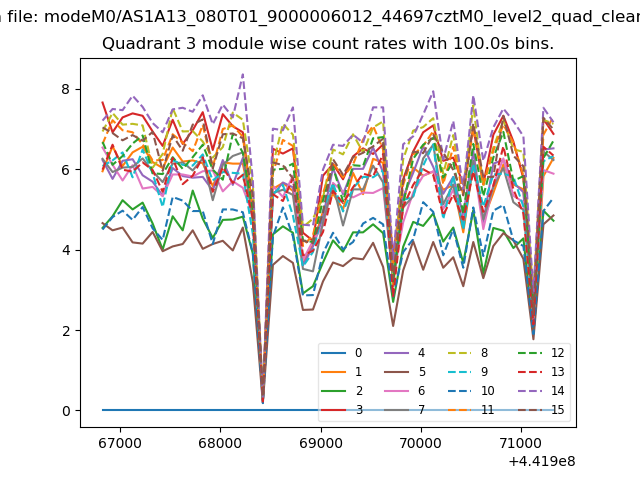
| Module-wise count rates for Quadrant A Data is divided into 100 sec bins |
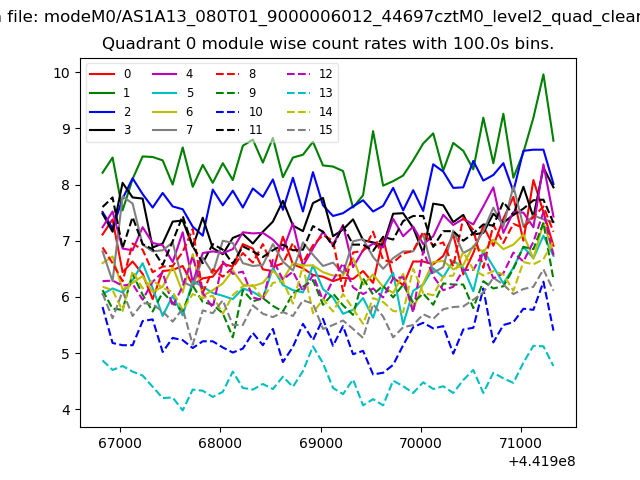 |
 |
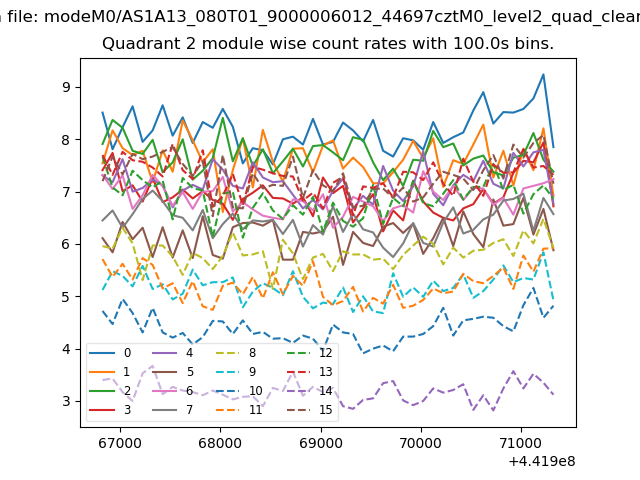
| Module-wise count rates for Quadrant B Data is divided into 100 sec bins |
 |
 |
| Module-wise count rates for Quadrant C Data is divided into 100 sec bins |
 |
 |
| Module-wise count rates for Quadrant D Data is divided into 100 sec bins |
 |
 |
| Parameter | Plot |
|---|---|
| CZT HV Monitor | 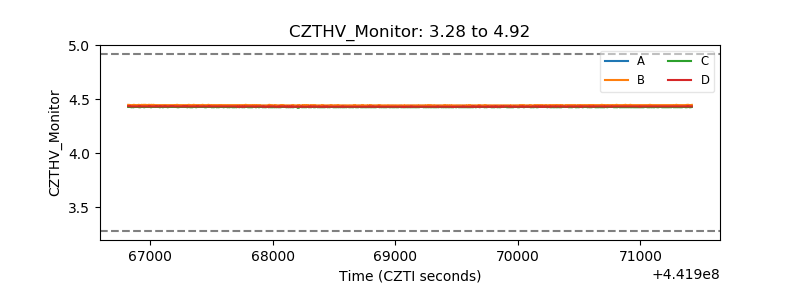 |
| D_VDD | 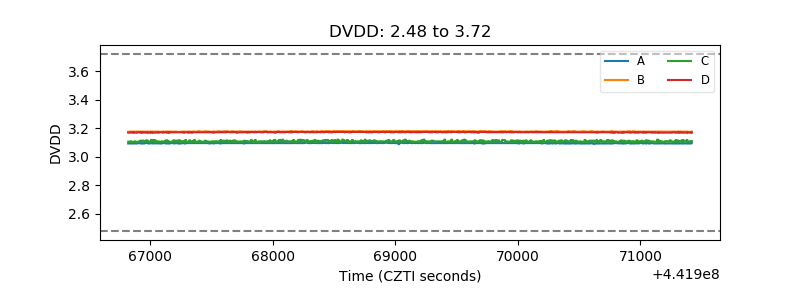 |
| Temperature 1 | 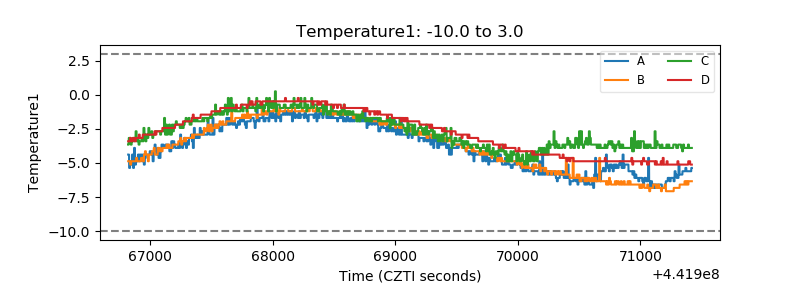 |
| Veto HV Monitor | 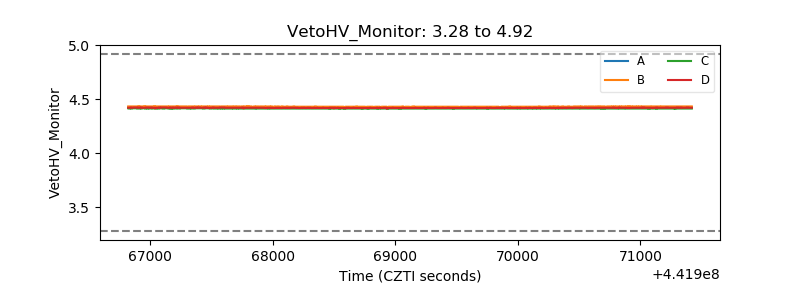 |
| Veto LLD | 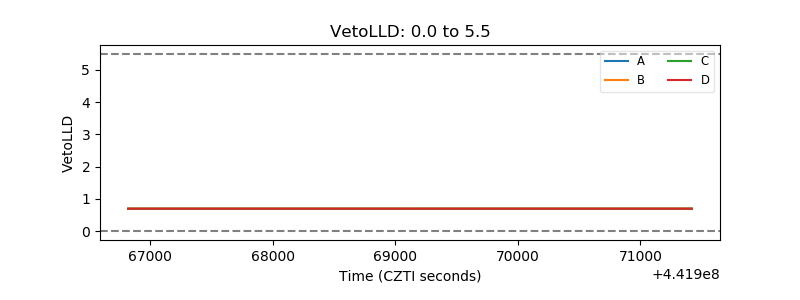 |
| Alpha Counter | 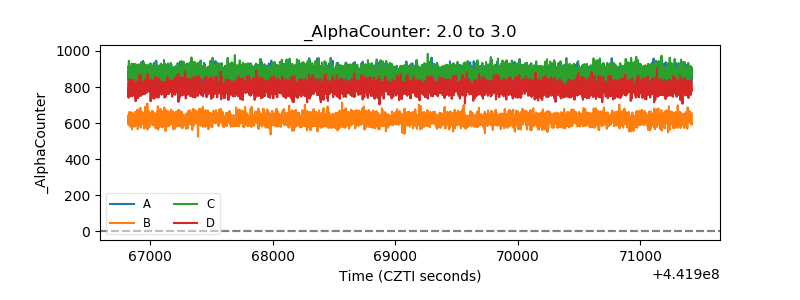 |
| _CPM_Rate | 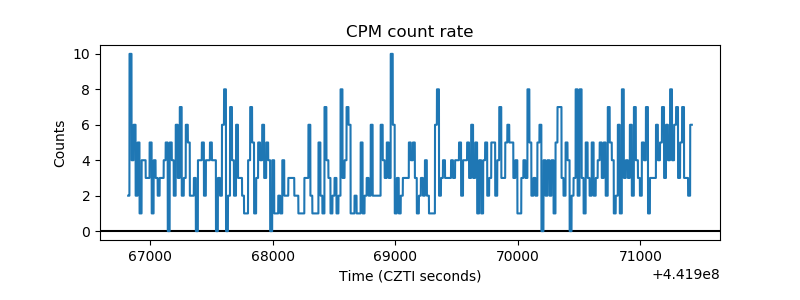 |
| CZT Counter | 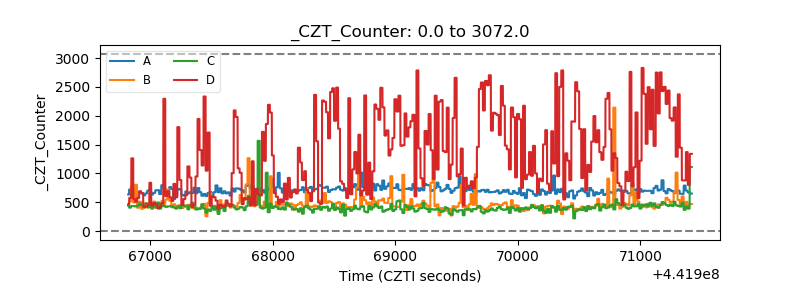 |
| +2.5 Volts monitor | 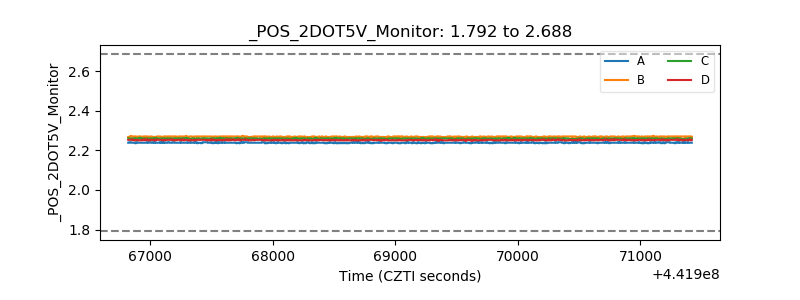 |
| +5 Volts monitor | 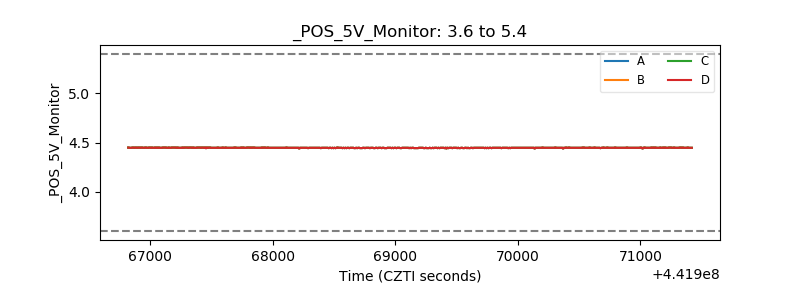 |
| _ROLL_ROT | 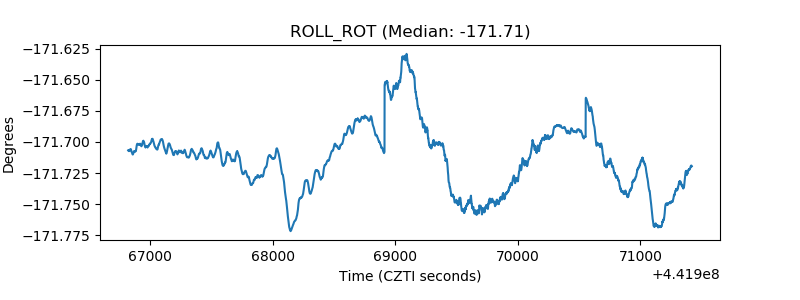 |
| _Roll_DEC | 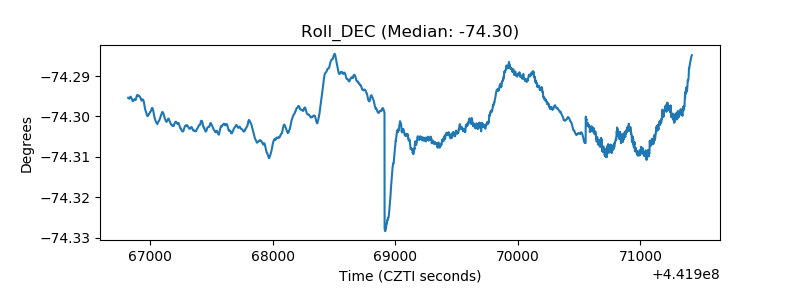 |
| _Roll_RA | 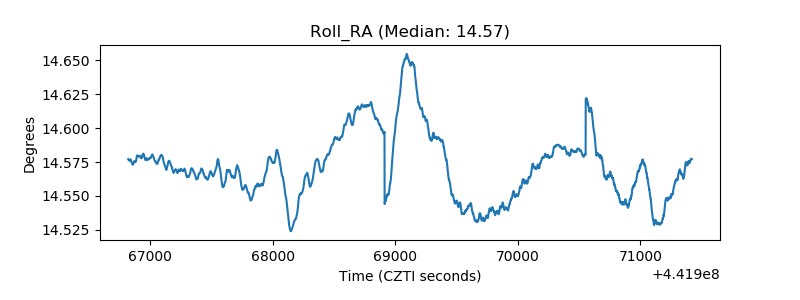 |
| Veto Counter | 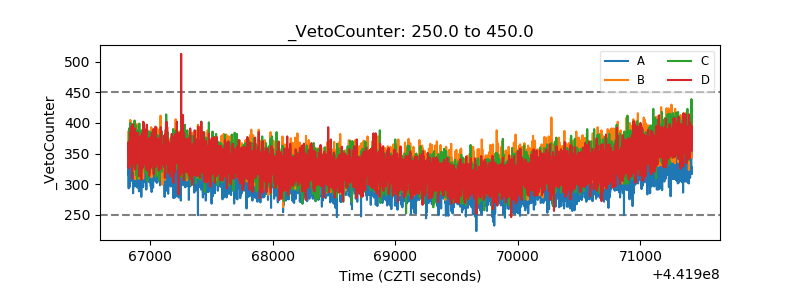 |