| Param | Original file | Final file |
|---|---|---|
| Filename | modeM0/AS1A13_080T01_9000006012_44700cztM0_level2.fits | modeM0/AS1A13_080T01_9000006012_44700cztM0_level2_quad_clean.evt |
| Size (bytes) | 1,716,505,920 | 297,884,160 |
| Size | 1.6 GB | 284.1 MB |
| Events in quadrant A | 16,119,614 | 2,036,016 |
| Events in quadrant B | 12,859,761 | 2,043,993 |
| Events in quadrant C | 9,213,502 | 2,029,171 |
| Events in quadrant D | 23,816,973 | 1,542,567 |
| Mode SS | |||
|---|---|---|---|
| Quadrant | BADHDUFLAG | Total packets | Discarded packets |
| A | 0 | 404 | 0 |
| B | 0 | 404 | 0 |
| C | 0 | 404 | 0 |
| D | 0 | 404 | 0 |
| Mode M9 | |||
|---|---|---|---|
| Quadrant | BADHDUFLAG | Total packets | Discarded packets |
| A | 0 | 15 | 0 |
| B | 0 | 15 | 0 |
| C | 0 | 15 | 0 |
| D | 0 | 15 | 0 |
| Mode M0 | |||
|---|---|---|---|
| Quadrant | BADHDUFLAG | Total packets | Discarded packets |
| A | 0 | 63344 | 5 |
| B | 0 | 51742 | 3 |
| C | 0 | 42010 | 3 |
| D | 0 | 84404 | 3 |
| Quadrant | Total seconds | Saturated seconds | Saturation percentage |
|---|---|---|---|
| A | 19826 | 691 | 3.485322% |
| B | 19827 | 1235 | 6.228880% |
| C | 19827 | 196 | 0.988551% |
| D | 19826 | 3675 | 18.536266% |
Noise dominated data is calculated using 1-second bins in cleaned event files. If a bin has >2000 counts, and if more than 50% of those come from <1% of pixels, then it is considered to be noise-dominated and hence unusable.
| Quadrant | # 1 sec bins | Bins with >0 counts | Bins with >2000 counts | High rate bins dominated by noise | Noise dominated (total time) | Noise dominated (detector-on time) | Marked lightcurve |
|---|---|---|---|---|---|---|---|
| A | 21427 | 19830 | 159 | 159 | 0.74% | 0.80% | 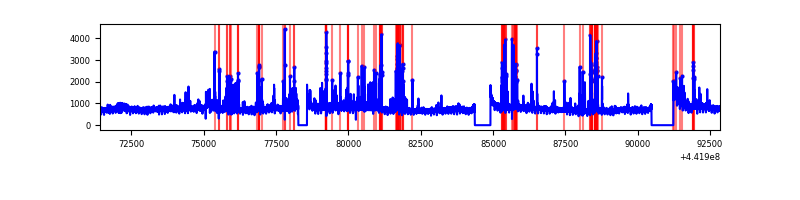 |
| B | 21427 | 19830 | 697 | 697 | 3.25% | 3.51% | 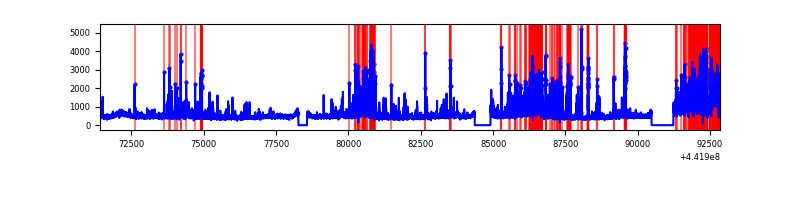 |
| C | 21427 | 19830 | 49 | 49 | 0.23% | 0.25% | 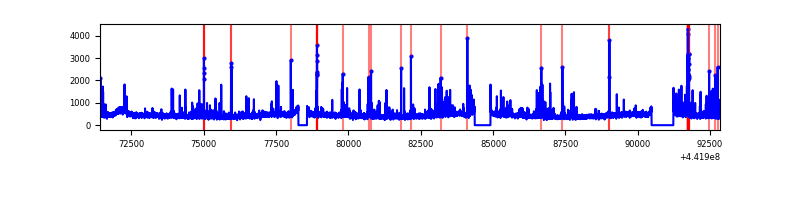 |
| D | 21426 | 19829 | 3347 | 3347 | 15.62% | 16.88% | 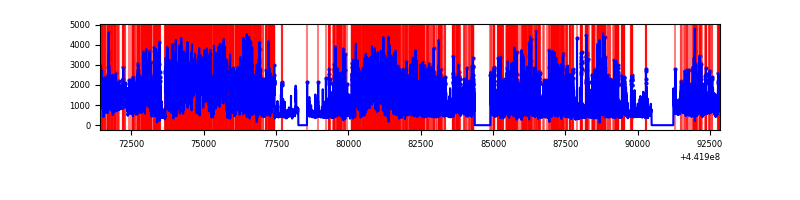 |
Top three noisy pixels from each quadrant. If the there are fewer than three noisy pixels in the level2.evt file, extra rows are filled as -1
| Pixel properties | Quadrant properties | ||||||
|---|---|---|---|---|---|---|---|
| Quadrant | DetID | PixID | Counts | Sigma | Mean | Median | Sigma |
| A | 10 | 83 | 6113534 | 13462.05 | 2194 | 2147 | 454.0 |
| A | 15 | 223 | 642288 | 1410.09 | 2194 | 2147 | 454.0 |
| A | 13 | 248 | 556902 | 1222.0 | 2194 | 2147 | 454.0 |
| B | 4 | 171 | 869809 | 2056.98 | 2167 | 2095 | 421.8 |
| B | 0 | 219 | 817138 | 1932.12 | 2167 | 2095 | 421.8 |
| B | 5 | 255 | 643713 | 1521.0 | 2167 | 2095 | 421.8 |
| C | 14 | 254 | 280055 | 551.54 | 2146 | 2154 | 503.9 |
| C | 12 | 2 | 122884 | 239.61 | 2146 | 2154 | 503.9 |
| C | 12 | 250 | 96876 | 187.99 | 2146 | 2154 | 503.9 |
| D | 11 | 241 | 8159088 | 15816.8 | 2037 | 1970 | 515.7 |
| D | 1 | 52 | 3367491 | 6525.8 | 2037 | 1970 | 515.7 |
| D | 13 | 249 | 1570157 | 3040.74 | 2037 | 1970 | 515.7 |
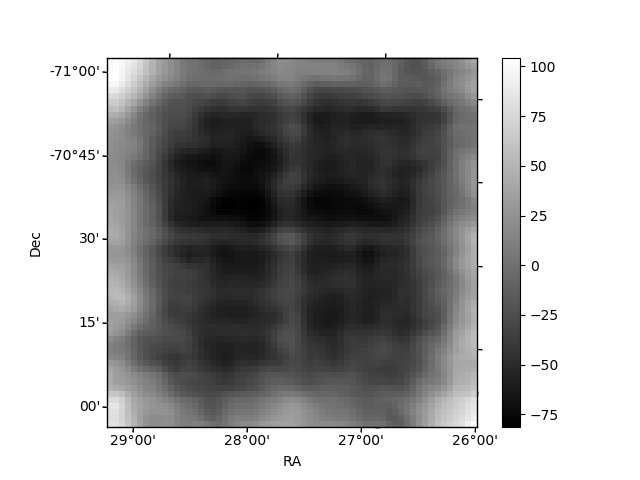
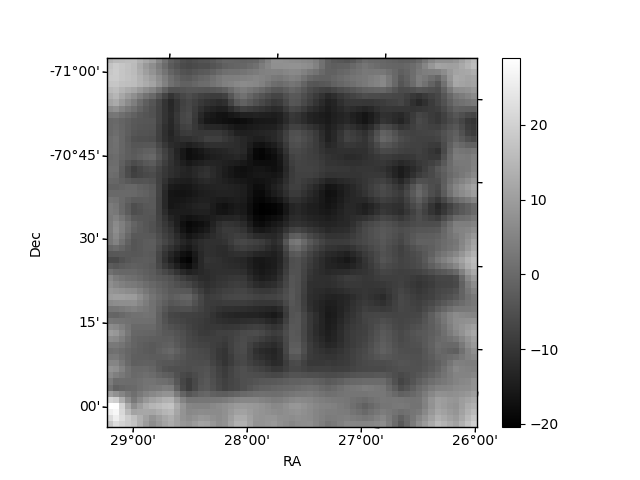
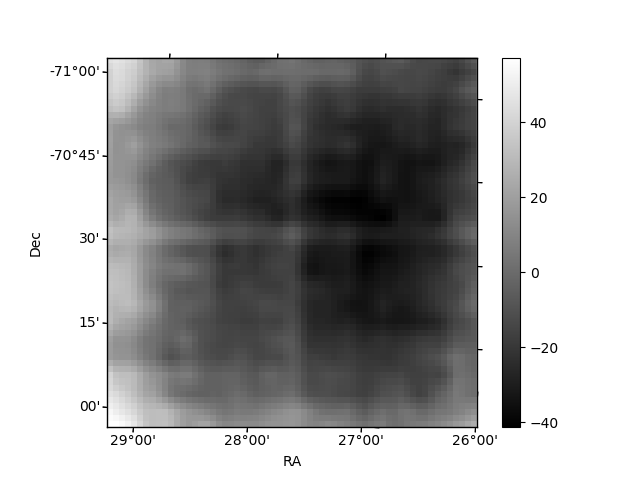
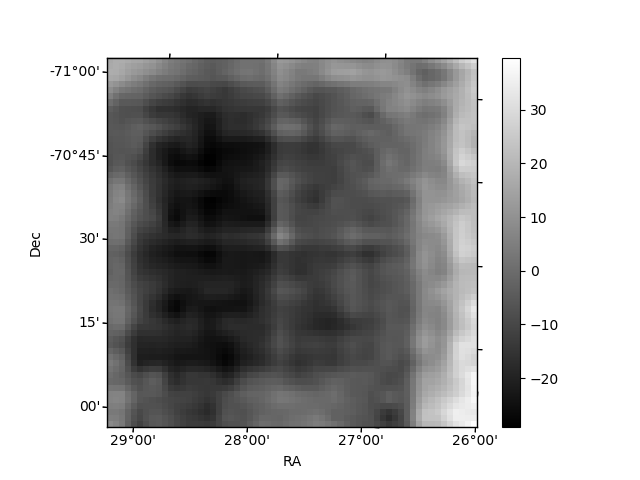
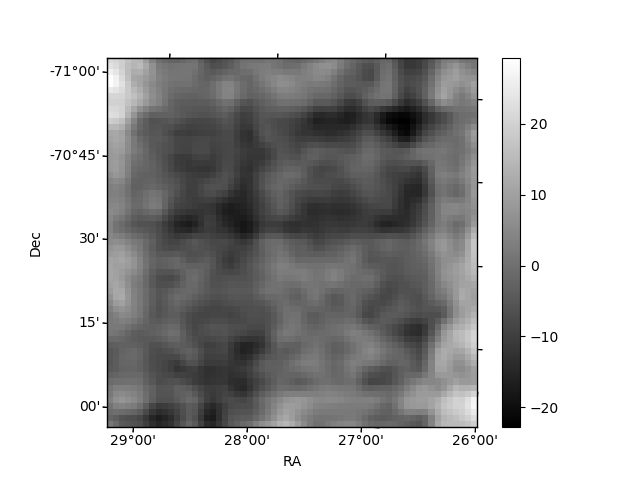
Histogram calculated using DETX and DETY for each event in the final _common_clean file
| Quadrant A | 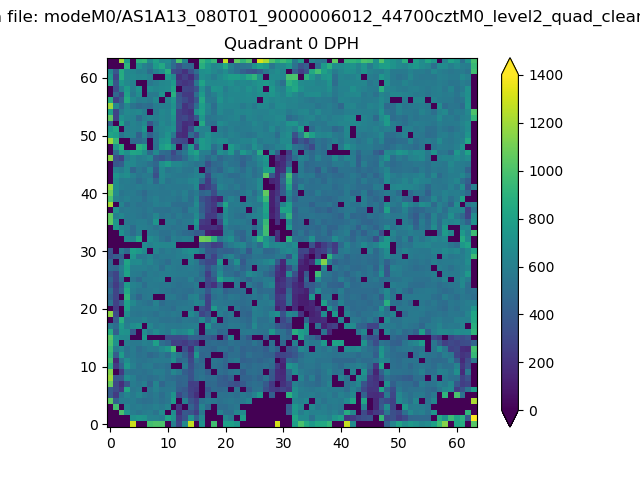 |
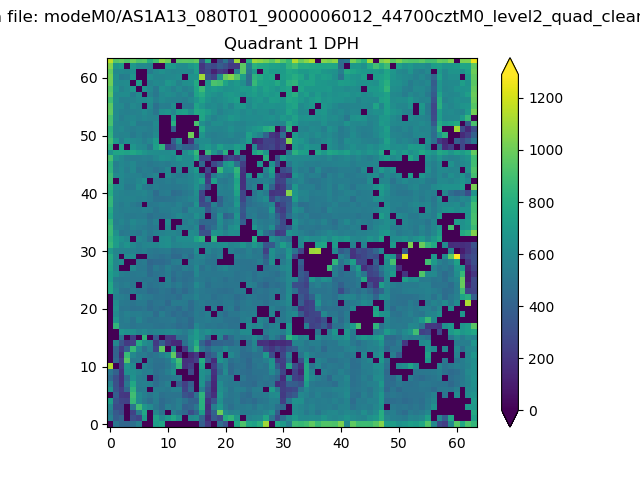 |
Quadrant B |
|---|---|---|---|
| Quadrant D | 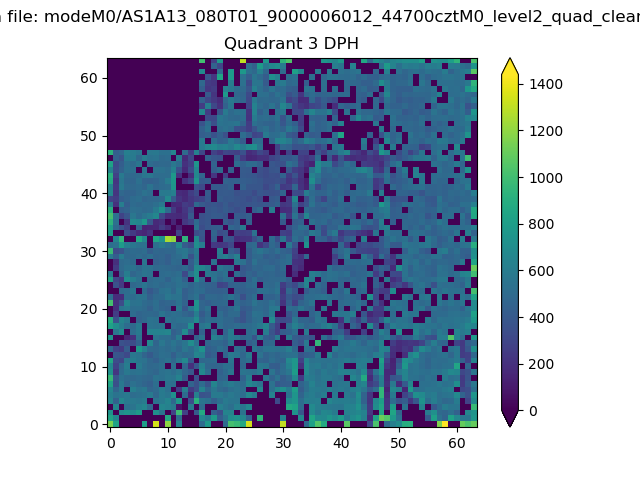 |
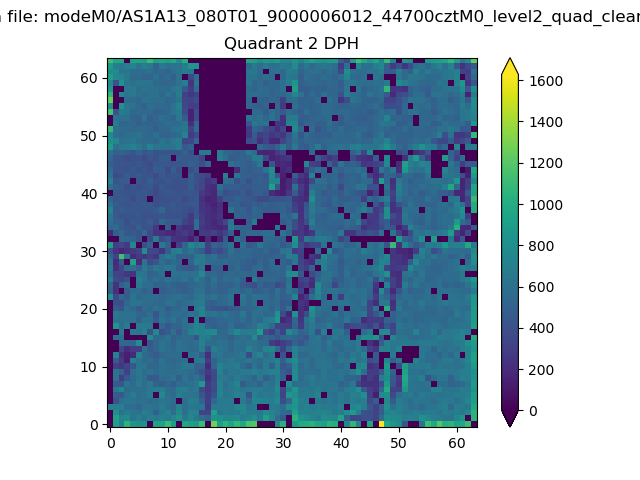 |
Quadrant C |
| Plot type | Count rate plots | Images |
|---|---|---|
| Comparison with Poisson distribution Blue bars denote a histogram of data divided into 1 sec bins. Red curve is a Poisson curve with rate = median count rate of data. |
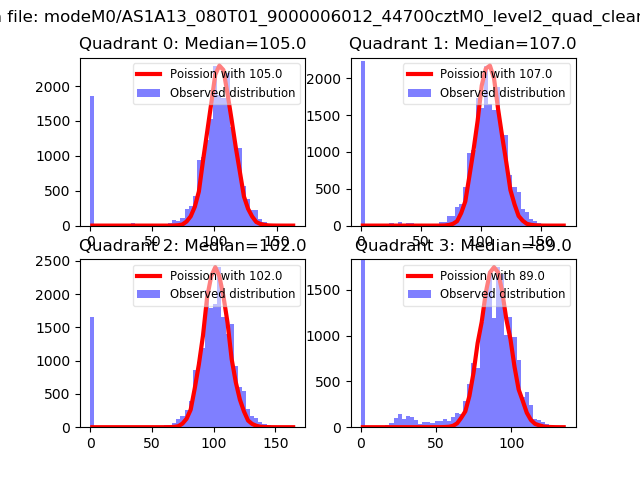 |
 |
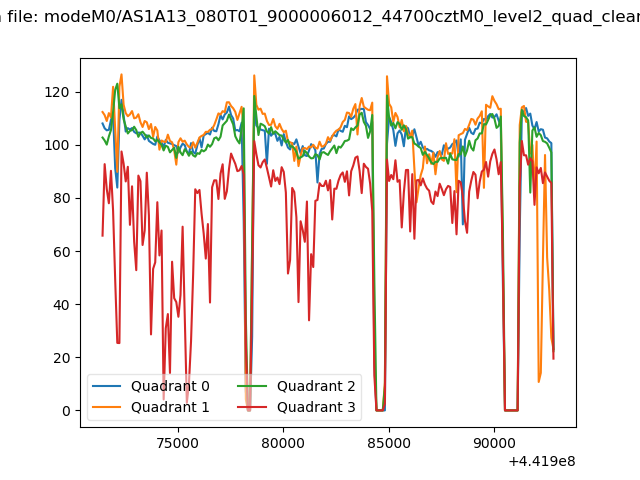
| Quadrant-wise count rates Data is divided into 100 sec bins |
 |
|
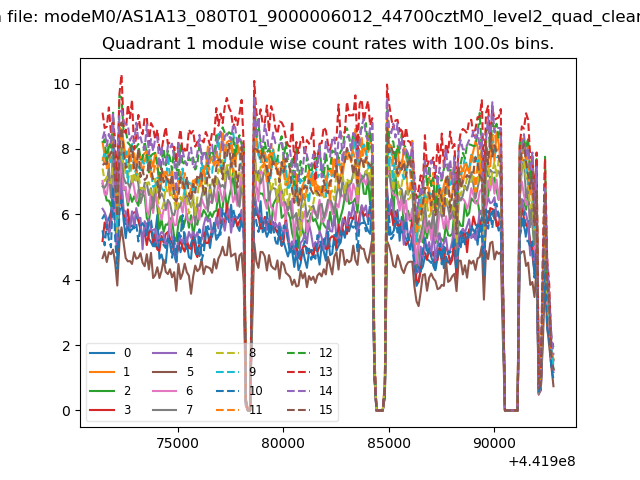
| Module-wise count rates for Quadrant A Data is divided into 100 sec bins |
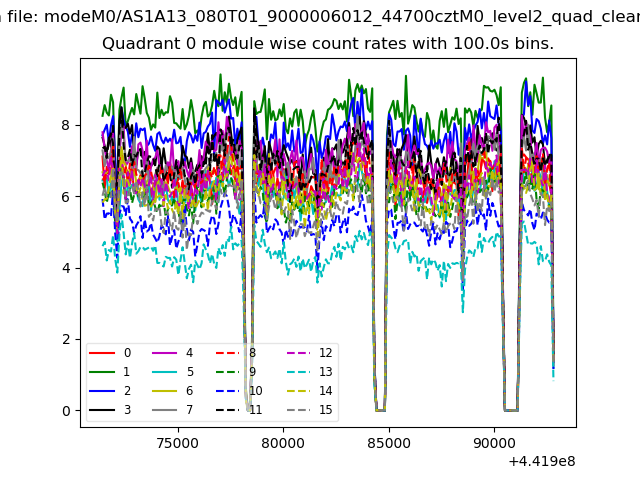 |
 |
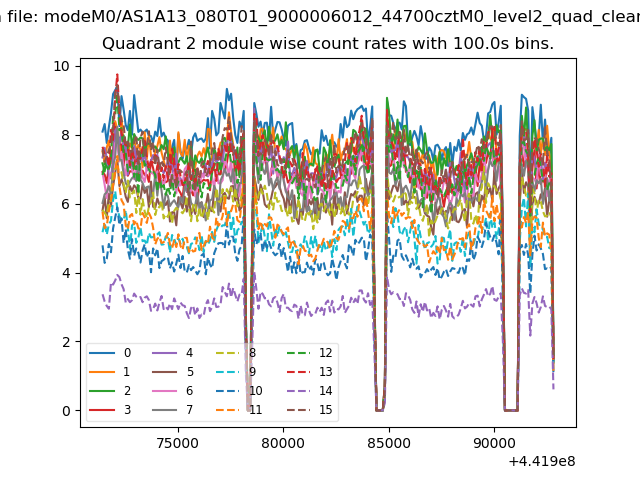
| Module-wise count rates for Quadrant B Data is divided into 100 sec bins |
 |
 |
| Module-wise count rates for Quadrant C Data is divided into 100 sec bins |
 |
 |
| Module-wise count rates for Quadrant D Data is divided into 100 sec bins |
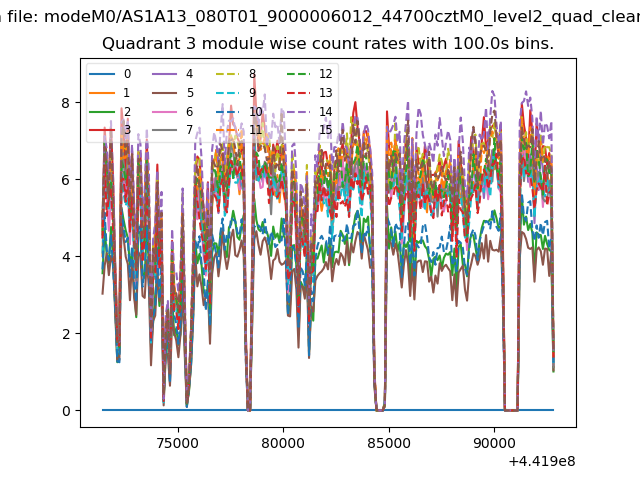 |
 |
| Parameter | Plot |
|---|---|
| CZT HV Monitor | 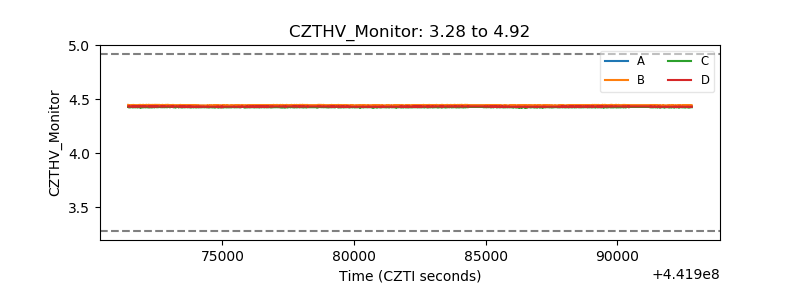 |
| D_VDD | 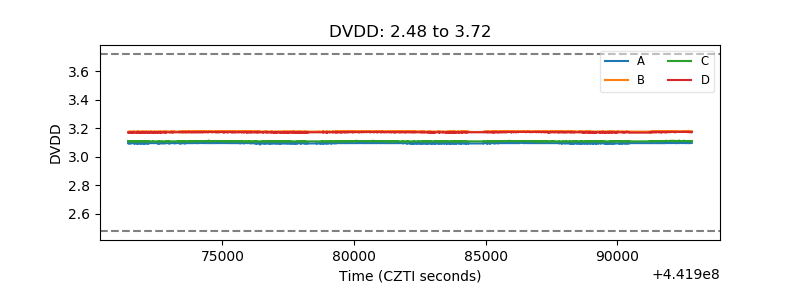 |
| Temperature 1 | 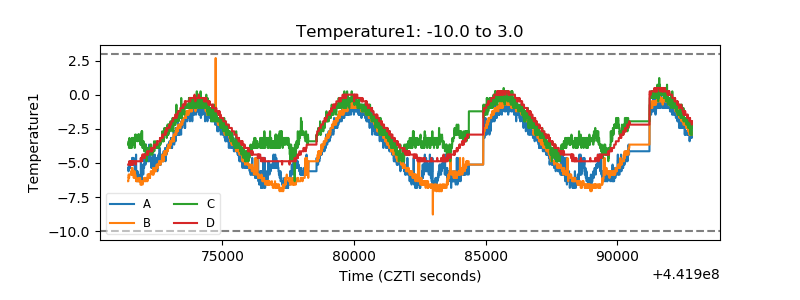 |
| Veto HV Monitor | 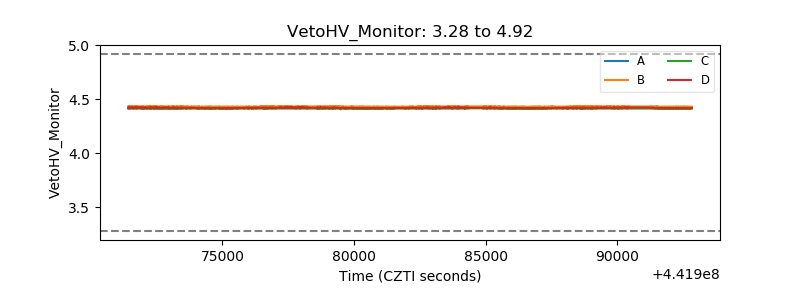 |
| Veto LLD | 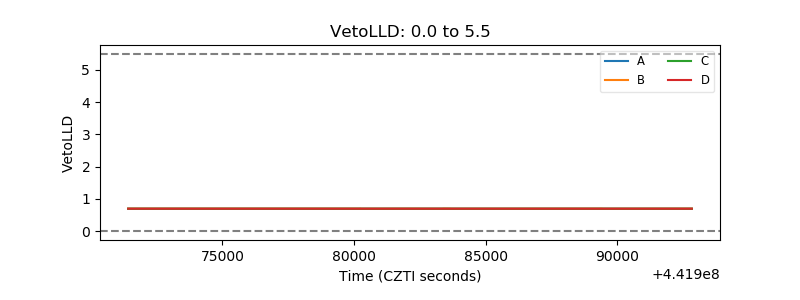 |
| Alpha Counter | 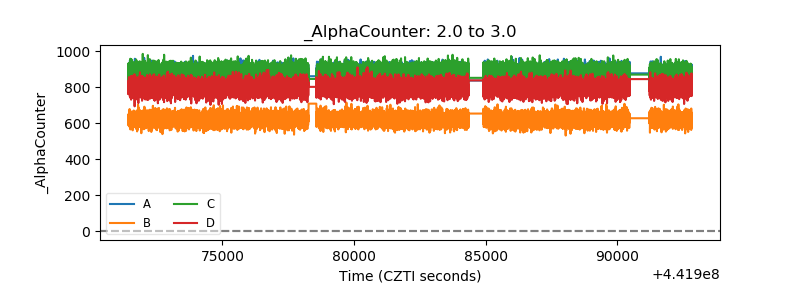 |
| _CPM_Rate | 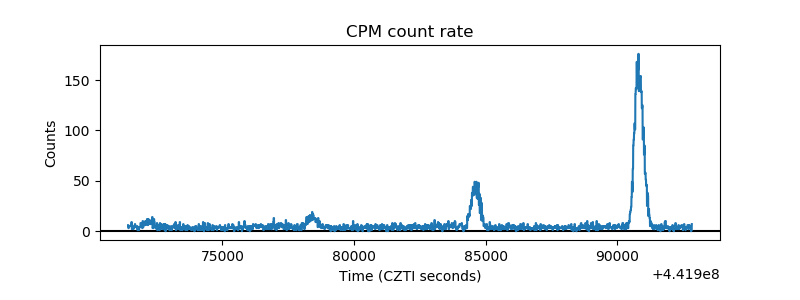 |
| CZT Counter | 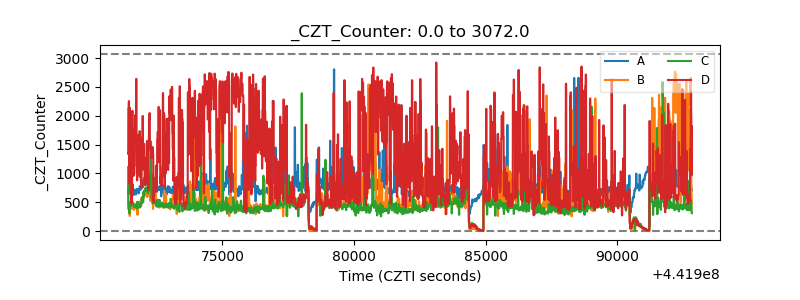 |
| +2.5 Volts monitor | 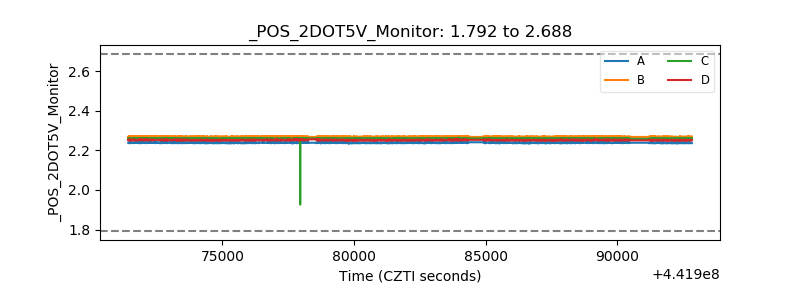 |
| +5 Volts monitor | 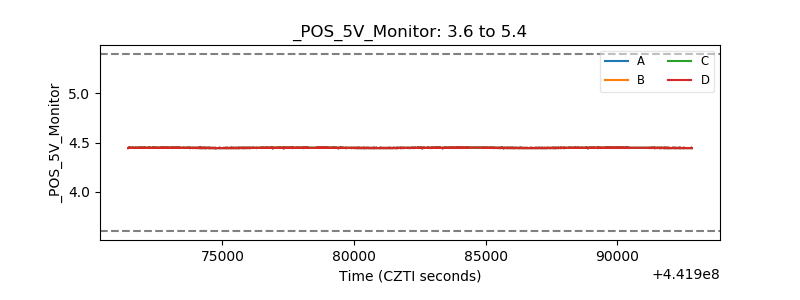 |
| _ROLL_ROT | 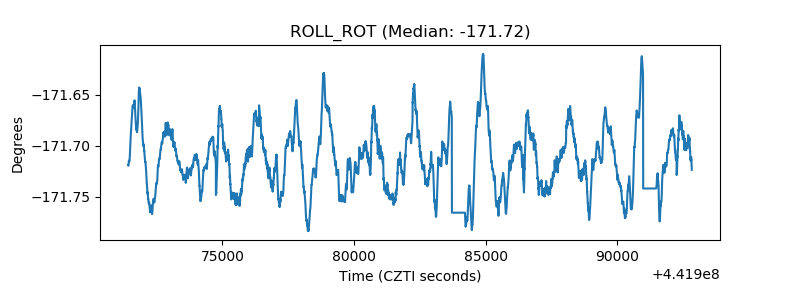 |
| _Roll_DEC | 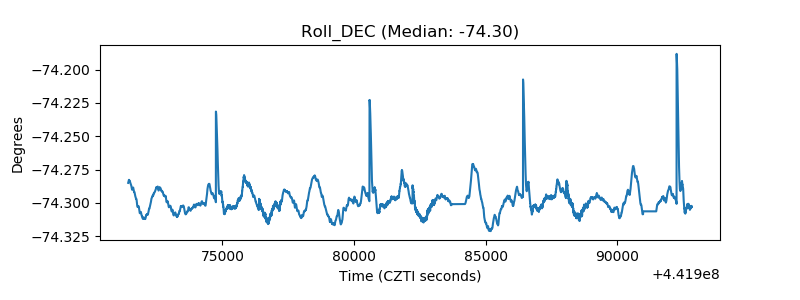 |
| _Roll_RA | 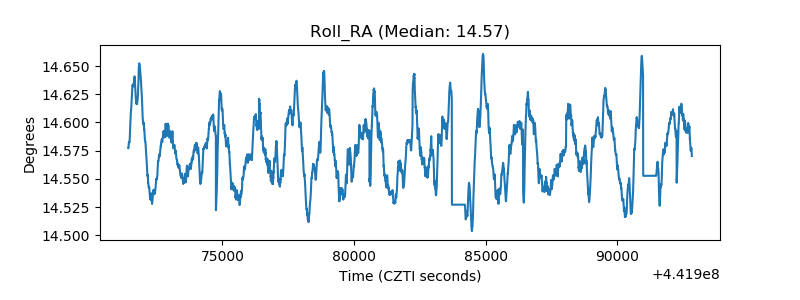 |
| Veto Counter | 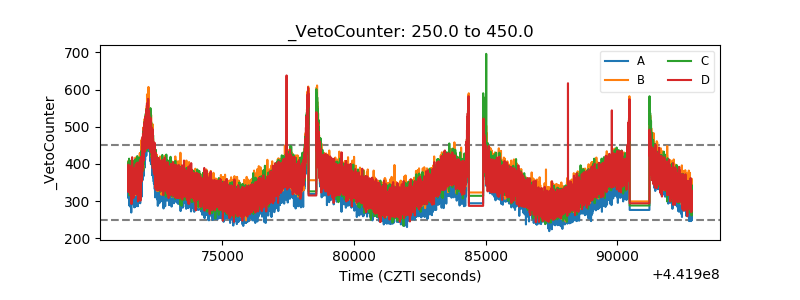 |