| Param | Original file | Final file |
|---|---|---|
| Filename | modeM0/AS1A13_080T01_9000006012_44701cztM0_level2.fits | modeM0/AS1A13_080T01_9000006012_44701cztM0_level2_quad_clean.evt |
| Size (bytes) | 575,331,840 | 101,419,200 |
| Size | 548.7 MB | 96.7 MB |
| Events in quadrant A | 5,252,547 | 699,216 |
| Events in quadrant B | 6,007,995 | 644,396 |
| Events in quadrant C | 3,160,196 | 674,612 |
| Events in quadrant D | 6,366,967 | 593,589 |
| Mode SS | |||
|---|---|---|---|
| Quadrant | BADHDUFLAG | Total packets | Discarded packets |
| A | 0 | 134 | 0 |
| B | 0 | 134 | 0 |
| C | 0 | 134 | 0 |
| D | 0 | 134 | 0 |
| Mode M9 | |||
|---|---|---|---|
| Quadrant | BADHDUFLAG | Total packets | Discarded packets |
| A | 0 | 9 | 0 |
| B | 0 | 9 | 0 |
| C | 0 | 9 | 0 |
| D | 0 | 9 | 0 |
| Mode M0 | |||
|---|---|---|---|
| Quadrant | BADHDUFLAG | Total packets | Discarded packets |
| A | 0 | 20713 | 1 |
| B | 0 | 22365 | 1 |
| C | 0 | 14289 | 1 |
| D | 0 | 23541 | 8 |
| Quadrant | Total seconds | Saturated seconds | Saturation percentage |
|---|---|---|---|
| A | 6575 | 110 | 1.673004% |
| B | 6576 | 875 | 13.305961% |
| C | 6576 | 87 | 1.322993% |
| D | 6575 | 469 | 7.133080% |
Noise dominated data is calculated using 1-second bins in cleaned event files. If a bin has >2000 counts, and if more than 50% of those come from <1% of pixels, then it is considered to be noise-dominated and hence unusable.
| Quadrant | # 1 sec bins | Bins with >0 counts | Bins with >2000 counts | High rate bins dominated by noise | Noise dominated (total time) | Noise dominated (detector-on time) | Marked lightcurve |
|---|---|---|---|---|---|---|---|
| A | 7495 | 6576 | 22 | 22 | 0.29% | 0.33% | 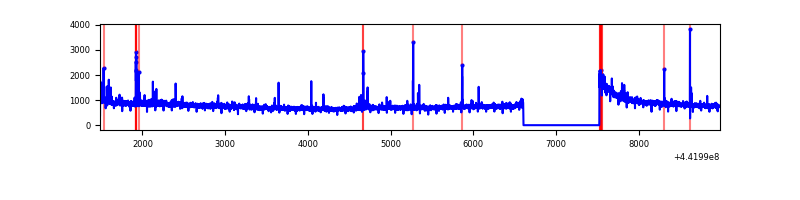 |
| B | 7496 | 6577 | 610 | 610 | 8.14% | 9.27% | 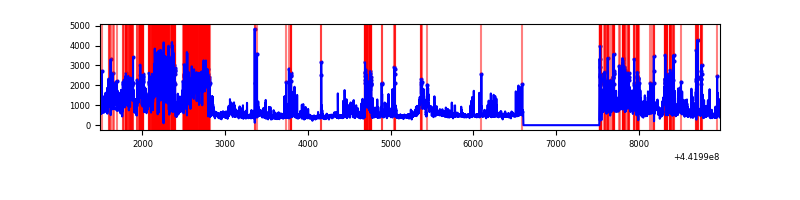 |
| C | 7496 | 6577 | 66 | 66 | 0.88% | 1.00% | 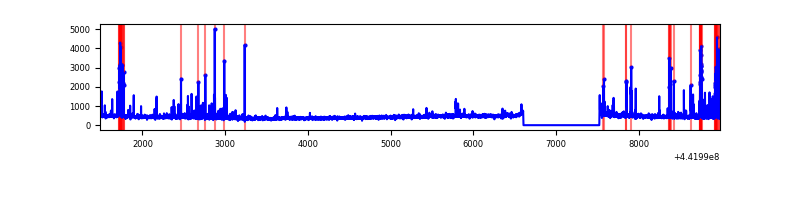 |
| D | 7495 | 6576 | 492 | 492 | 6.56% | 7.48% | 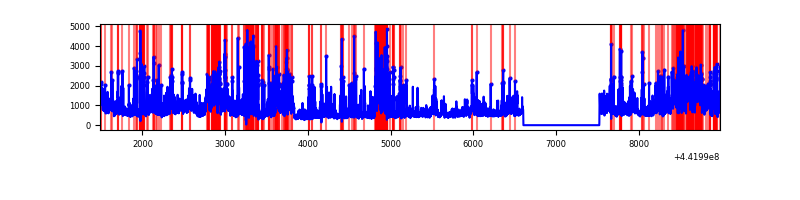 |
Top three noisy pixels from each quadrant. If the there are fewer than three noisy pixels in the level2.evt file, extra rows are filled as -1
| Pixel properties | Quadrant properties | ||||||
|---|---|---|---|---|---|---|---|
| Quadrant | DetID | PixID | Counts | Sigma | Mean | Median | Sigma |
| A | 10 | 83 | 2277082 | 15146.13 | 718 | 703 | 150.3 |
| A | 13 | 248 | 84173 | 555.38 | 718 | 703 | 150.3 |
| A | 12 | 227 | 51013 | 334.74 | 718 | 703 | 150.3 |
| B | 4 | 171 | 811438 | 6071.88 | 683 | 665 | 133.5 |
| B | 5 | 255 | 465783 | 3483.26 | 683 | 665 | 133.5 |
| B | 0 | 219 | 465596 | 3481.86 | 683 | 665 | 133.5 |
| C | 12 | 2 | 145048 | 884.27 | 689 | 692 | 163.2 |
| C | 15 | 208 | 95999 | 583.82 | 689 | 692 | 163.2 |
| C | 12 | 250 | 77169 | 468.47 | 689 | 692 | 163.2 |
| D | 11 | 241 | 1088241 | 6348.49 | 675 | 653 | 171.3 |
| D | 13 | 249 | 709627 | 4138.44 | 675 | 653 | 171.3 |
| D | 1 | 52 | 405839 | 2365.16 | 675 | 653 | 171.3 |
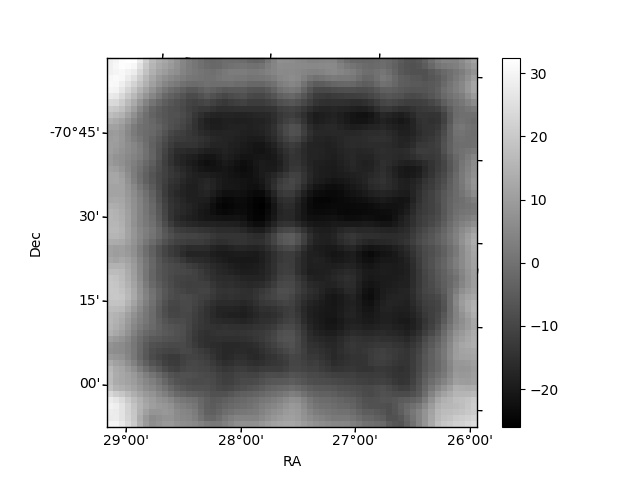
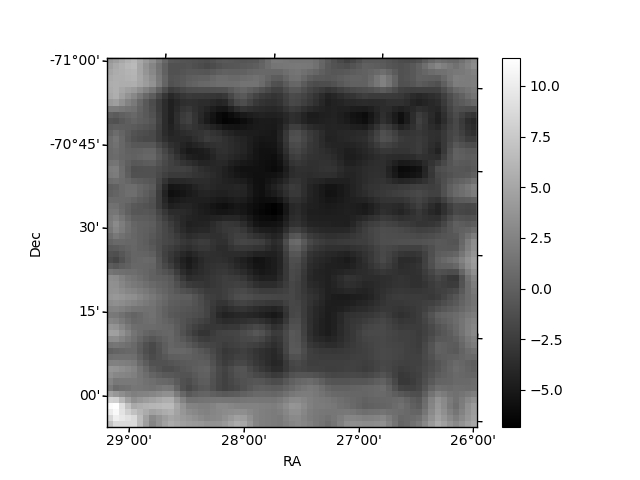
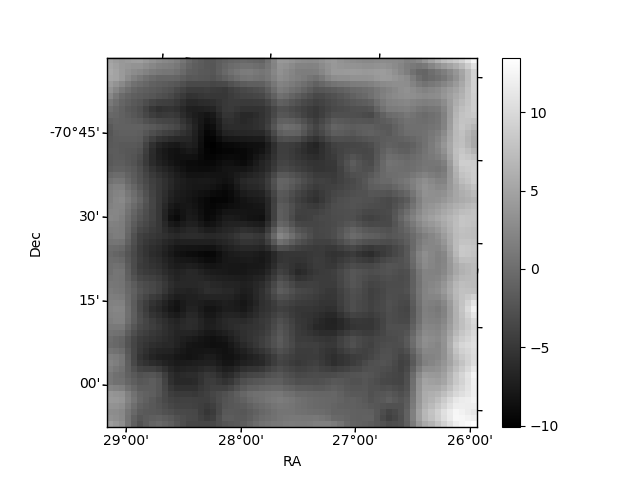
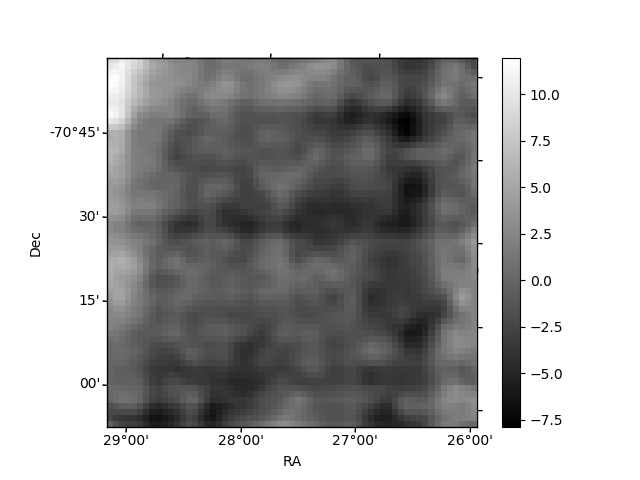
Histogram calculated using DETX and DETY for each event in the final _common_clean file
| Quadrant A | 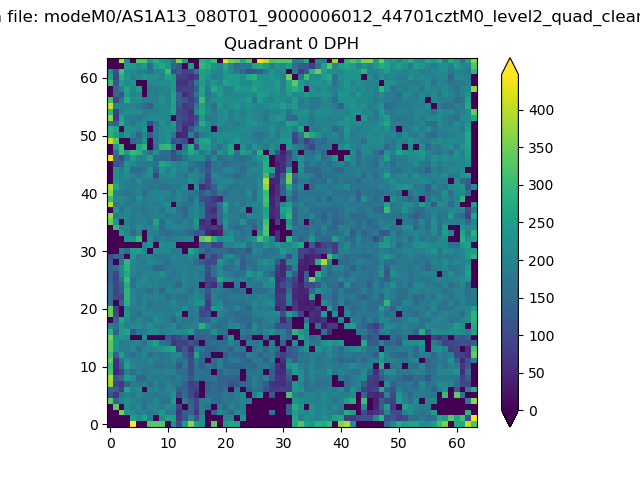 |
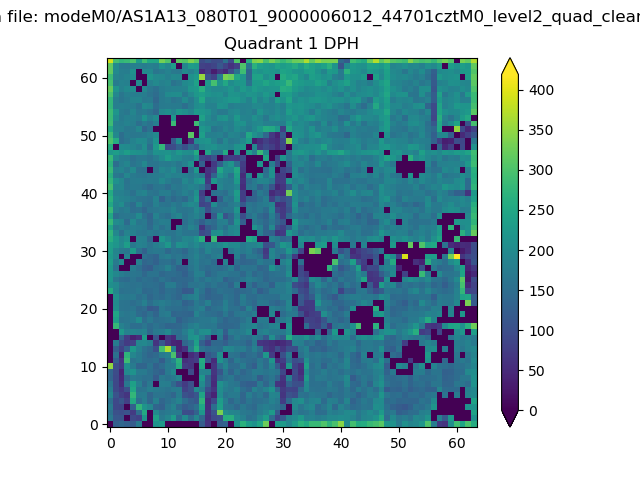 |
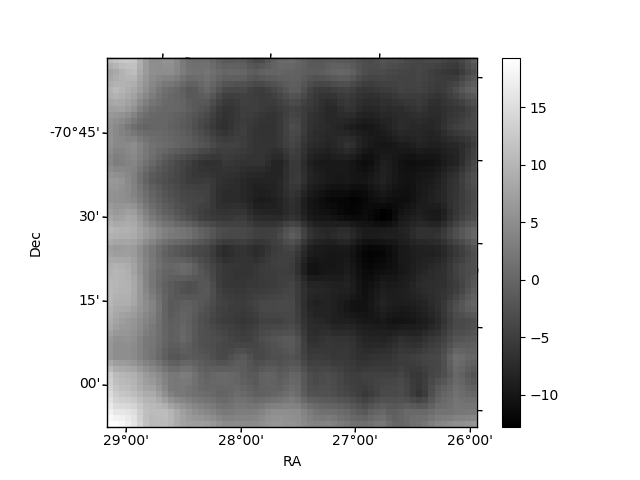
Quadrant B |
|---|---|---|---|
| Quadrant D | 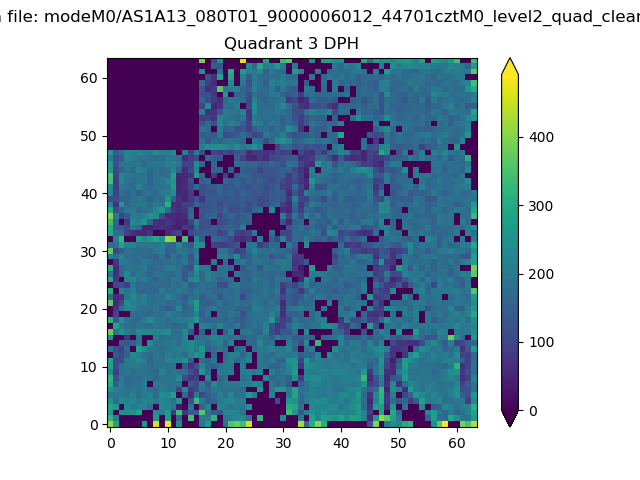 |
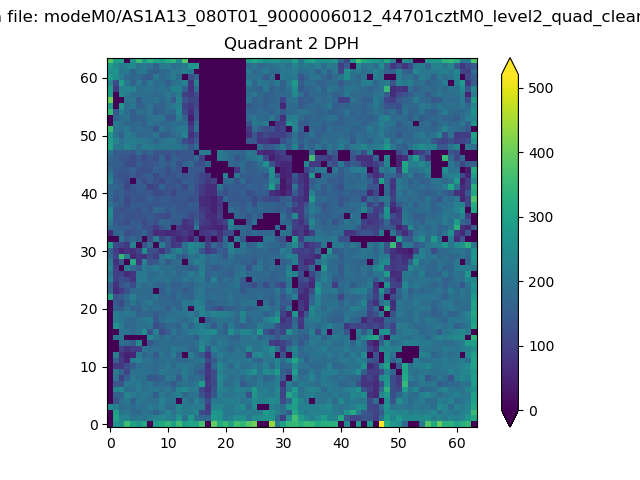 |
Quadrant C |
| Plot type | Count rate plots | Images |
|---|---|---|
| Comparison with Poisson distribution Blue bars denote a histogram of data divided into 1 sec bins. Red curve is a Poisson curve with rate = median count rate of data. |
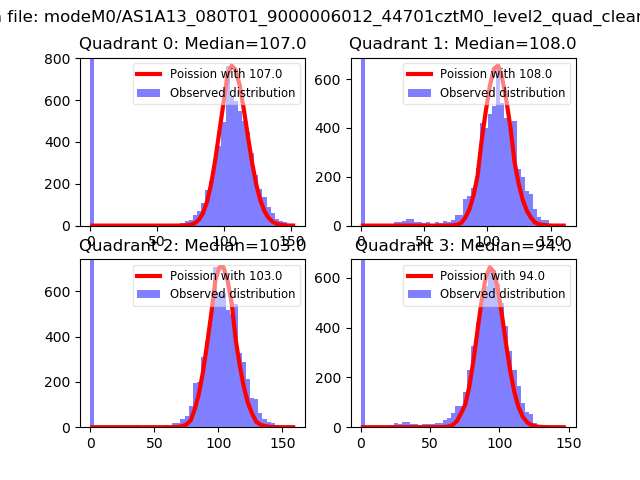 |
 |
| Quadrant-wise count rates Data is divided into 100 sec bins |
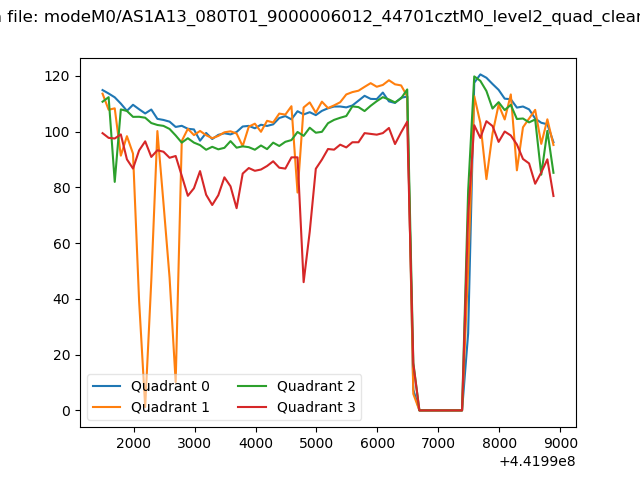 |
|
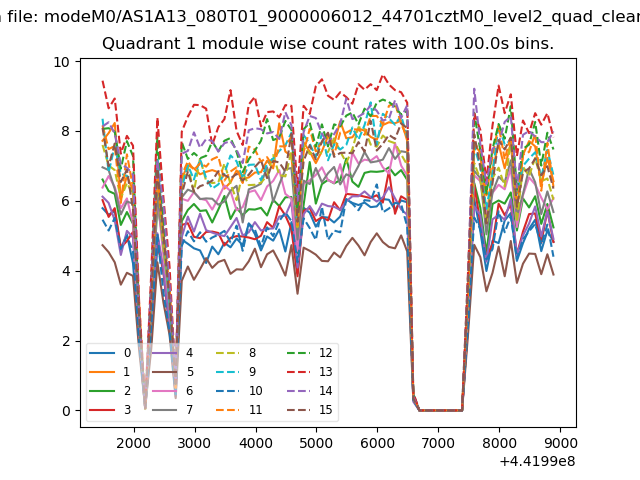
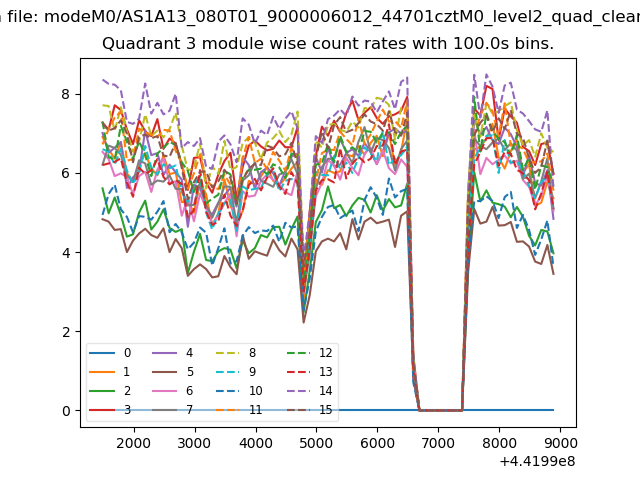
| Module-wise count rates for Quadrant A Data is divided into 100 sec bins |
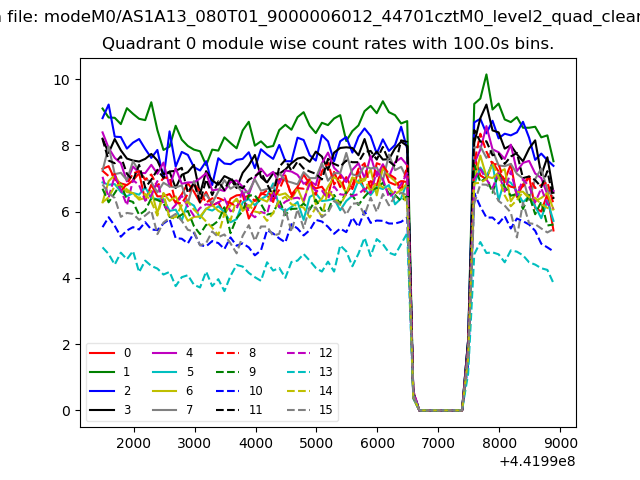 |
 |
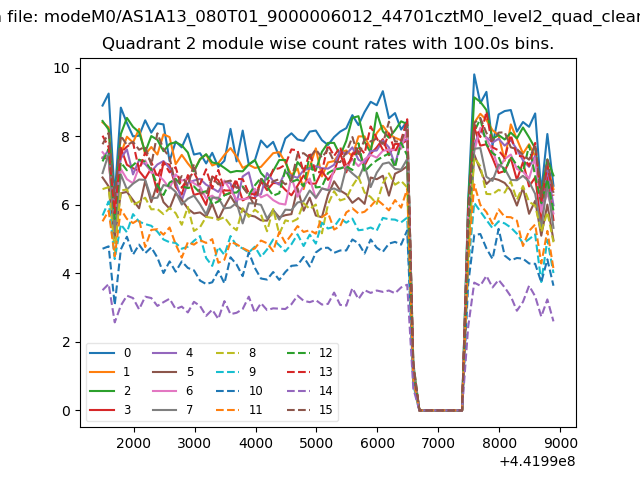
| Module-wise count rates for Quadrant B Data is divided into 100 sec bins |
 |
 |
| Module-wise count rates for Quadrant C Data is divided into 100 sec bins |
 |
 |
| Module-wise count rates for Quadrant D Data is divided into 100 sec bins |
 |
 |
| Parameter | Plot |
|---|---|
| CZT HV Monitor | 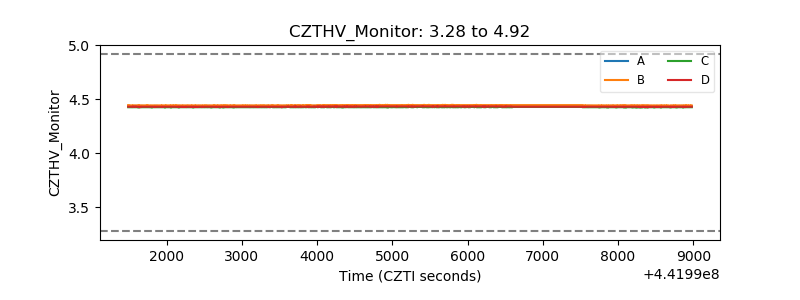 |
| D_VDD | 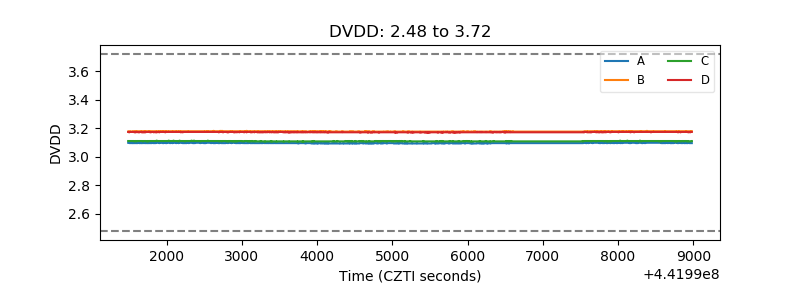 |
| Temperature 1 | 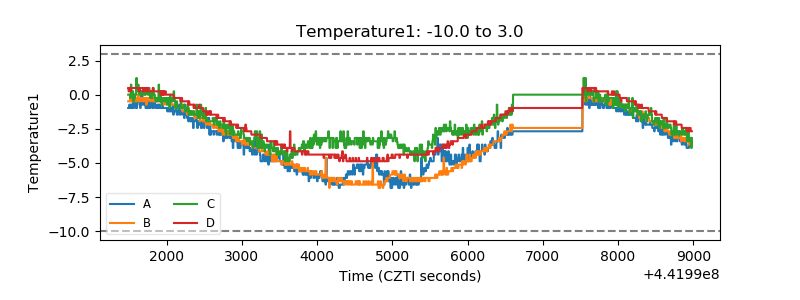 |
| Veto HV Monitor | 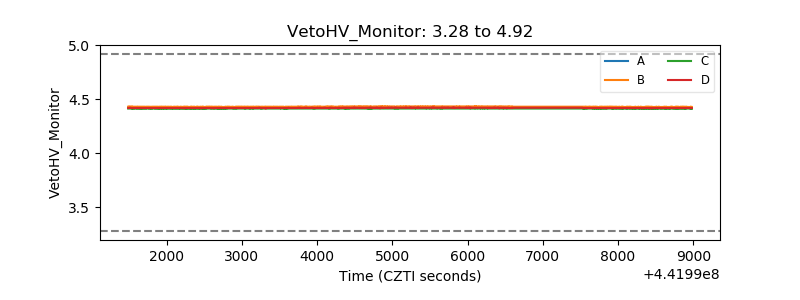 |
| Veto LLD | 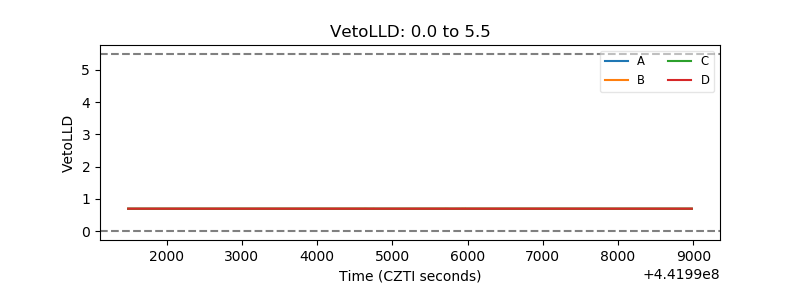 |
| Alpha Counter | 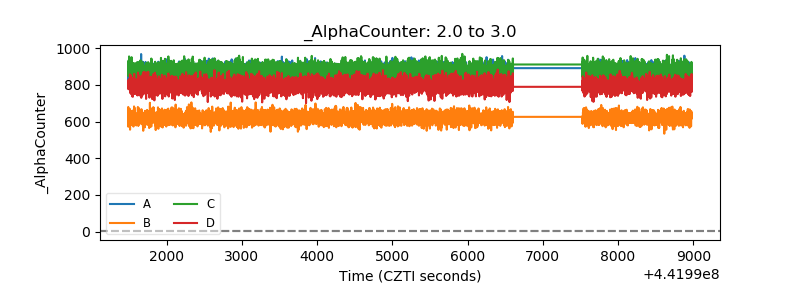 |
| _CPM_Rate | 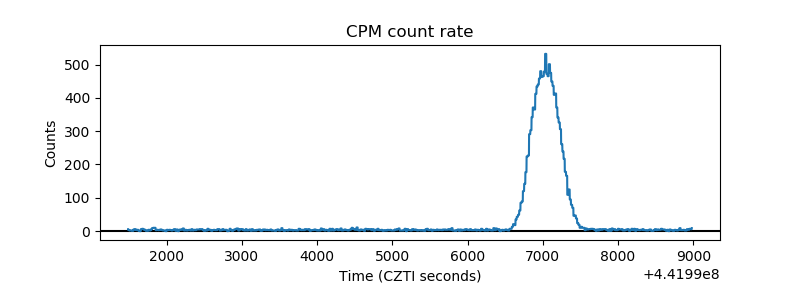 |
| CZT Counter | 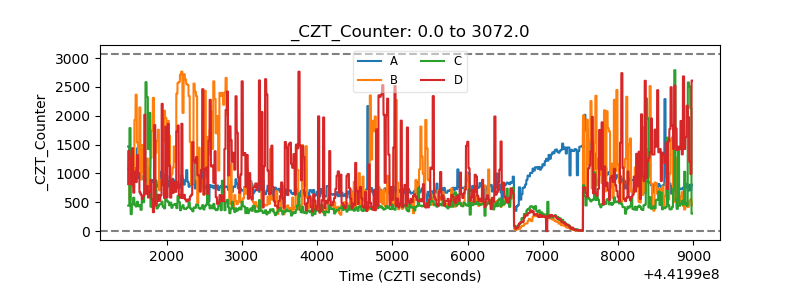 |
| +2.5 Volts monitor | 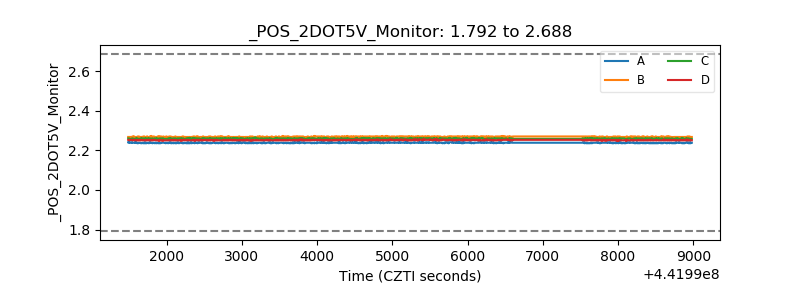 |
| +5 Volts monitor | 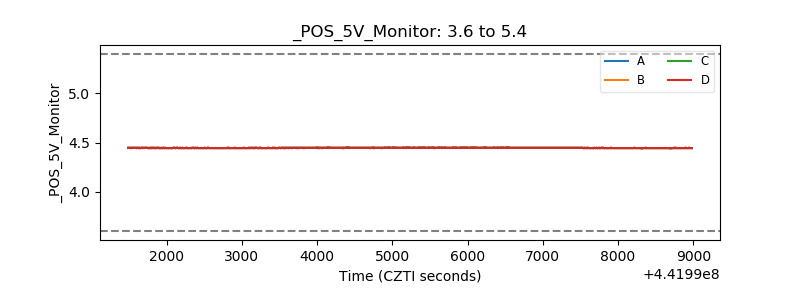 |
| _ROLL_ROT | 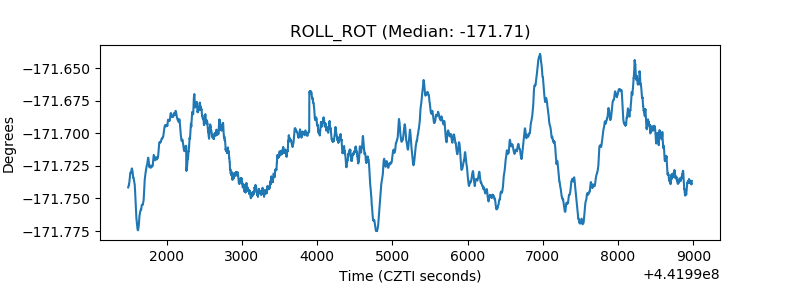 |
| _Roll_DEC | 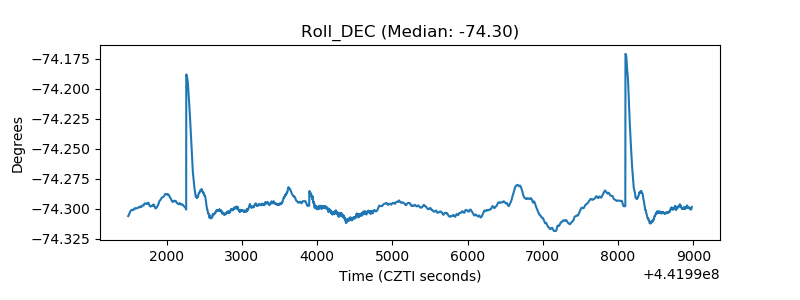 |
| _Roll_RA | 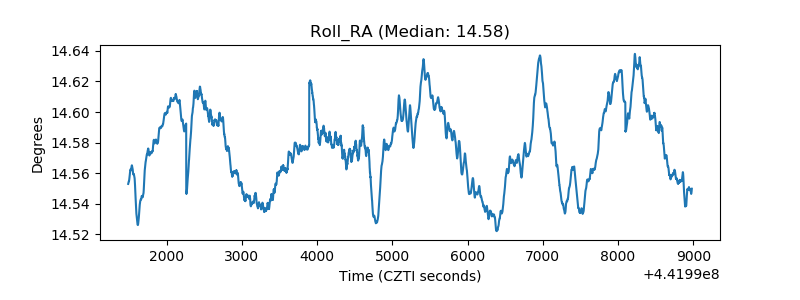 |
| Veto Counter | 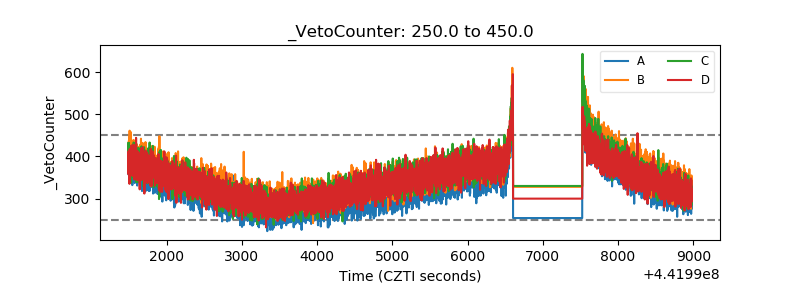 |