| Param | Original file | Final file |
|---|---|---|
| Filename | modeM0/AS1A13_080T01_9000006012_44703cztM0_level2.fits | modeM0/AS1A13_080T01_9000006012_44703cztM0_level2_quad_clean.evt |
| Size (bytes) | 511,585,920 | 99,763,200 |
| Size | 487.9 MB | 95.1 MB |
| Events in quadrant A | 4,971,850 | 677,100 |
| Events in quadrant B | 4,470,367 | 673,453 |
| Events in quadrant C | 2,991,892 | 653,701 |
| Events in quadrant D | 6,019,495 | 580,660 |
| Mode SS | |||
|---|---|---|---|
| Quadrant | BADHDUFLAG | Total packets | Discarded packets |
| A | 0 | 126 | 0 |
| B | 0 | 126 | 0 |
| C | 0 | 126 | 0 |
| D | 0 | 126 | 0 |
| Mode M9 | |||
|---|---|---|---|
| Quadrant | BADHDUFLAG | Total packets | Discarded packets |
| A | 0 | 11 | 0 |
| B | 0 | 11 | 0 |
| C | 0 | 11 | 0 |
| D | 0 | 11 | 0 |
| Mode M0 | |||
|---|---|---|---|
| Quadrant | BADHDUFLAG | Total packets | Discarded packets |
| A | 0 | 19759 | 1 |
| B | 0 | 17526 | 1 |
| C | 0 | 13476 | 1 |
| D | 0 | 22272 | 1 |
| Quadrant | Total seconds | Saturated seconds | Saturation percentage |
|---|---|---|---|
| A | 6242 | 117 | 1.874399% |
| B | 6242 | 349 | 5.591157% |
| C | 6243 | 61 | 0.977094% |
| D | 6243 | 329 | 5.269902% |
Noise dominated data is calculated using 1-second bins in cleaned event files. If a bin has >2000 counts, and if more than 50% of those come from <1% of pixels, then it is considered to be noise-dominated and hence unusable.
| Quadrant | # 1 sec bins | Bins with >0 counts | Bins with >2000 counts | High rate bins dominated by noise | Noise dominated (total time) | Noise dominated (detector-on time) | Marked lightcurve |
|---|---|---|---|---|---|---|---|
| A | 7297 | 6243 | 34 | 34 | 0.47% | 0.54% | 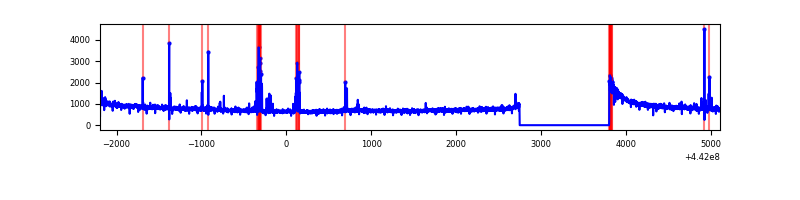 |
| B | 7297 | 6243 | 174 | 174 | 2.38% | 2.79% | 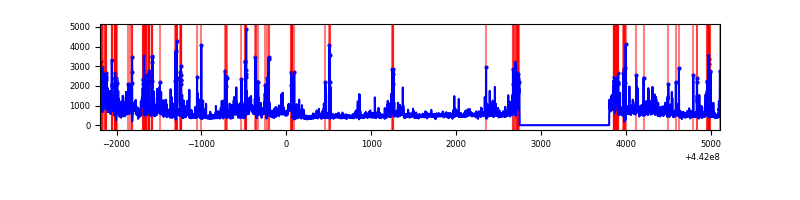 |
| C | 7298 | 6244 | 48 | 48 | 0.66% | 0.77% | 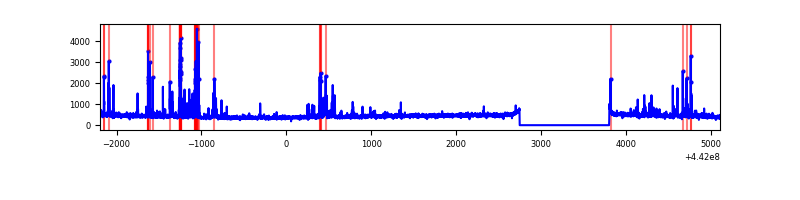 |
| D | 7298 | 6244 | 365 | 365 | 5.00% | 5.85% | 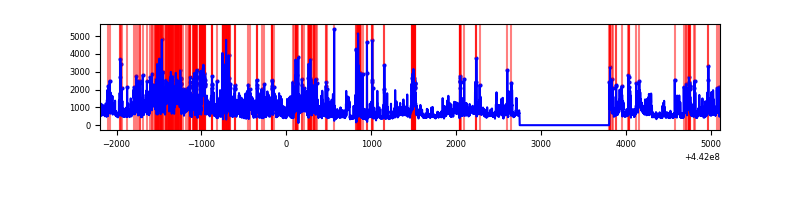 |
Top three noisy pixels from each quadrant. If the there are fewer than three noisy pixels in the level2.evt file, extra rows are filled as -1
| Pixel properties | Quadrant properties | ||||||
|---|---|---|---|---|---|---|---|
| Quadrant | DetID | PixID | Counts | Sigma | Mean | Median | Sigma |
| A | 10 | 83 | 2148235 | 15080.12 | 683 | 670 | 142.4 |
| A | 13 | 248 | 108676 | 758.41 | 683 | 670 | 142.4 |
| A | 10 | 248 | 28953 | 198.6 | 683 | 670 | 142.4 |
| B | 0 | 189 | 587433 | 4470.25 | 674 | 655 | 131.3 |
| B | 15 | 36 | 322338 | 2450.68 | 674 | 655 | 131.3 |
| B | 4 | 171 | 142033 | 1077.06 | 674 | 655 | 131.3 |
| C | 12 | 2 | 136654 | 880.08 | 657 | 661 | 154.5 |
| C | 15 | 208 | 87329 | 560.87 | 657 | 661 | 154.5 |
| C | 2 | 14 | 74063 | 475.02 | 657 | 661 | 154.5 |
| D | 11 | 241 | 1901651 | 11508.67 | 646 | 624 | 165.2 |
| D | 13 | 249 | 310703 | 1877.19 | 646 | 624 | 165.2 |
| D | 13 | 171 | 308227 | 1862.2 | 646 | 624 | 165.2 |
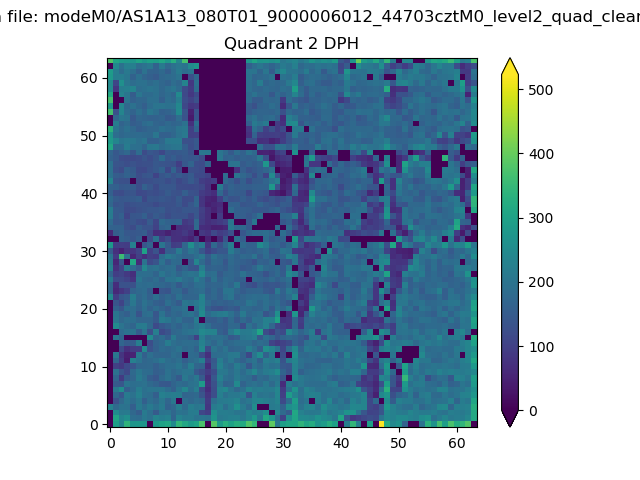
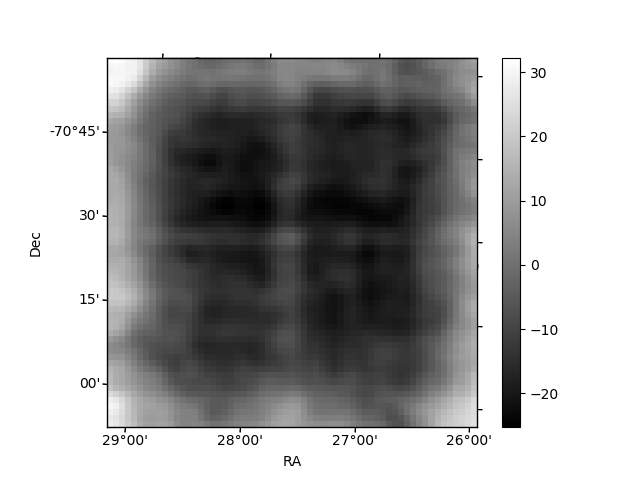
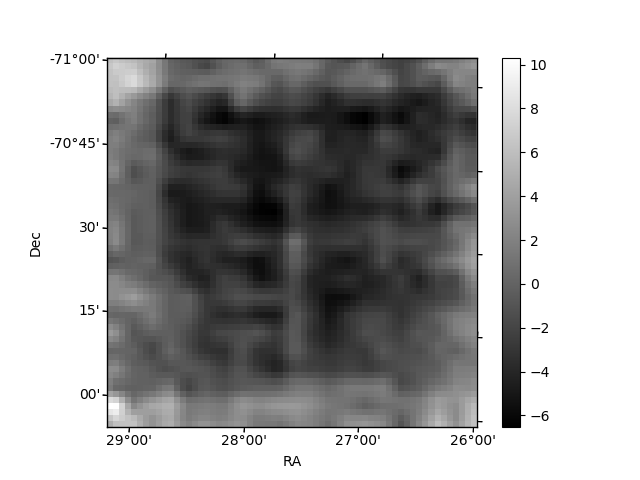
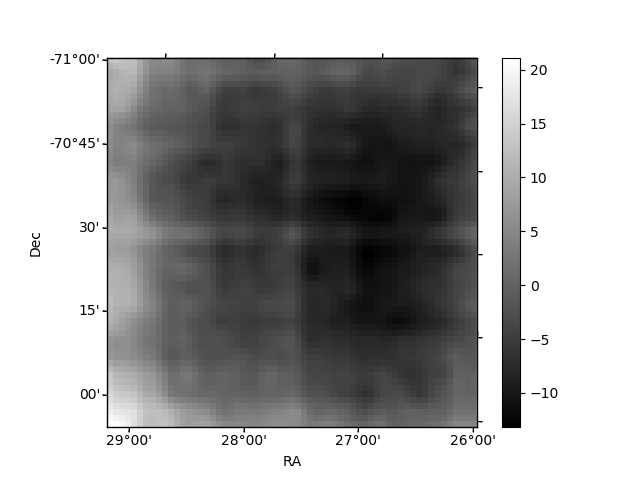
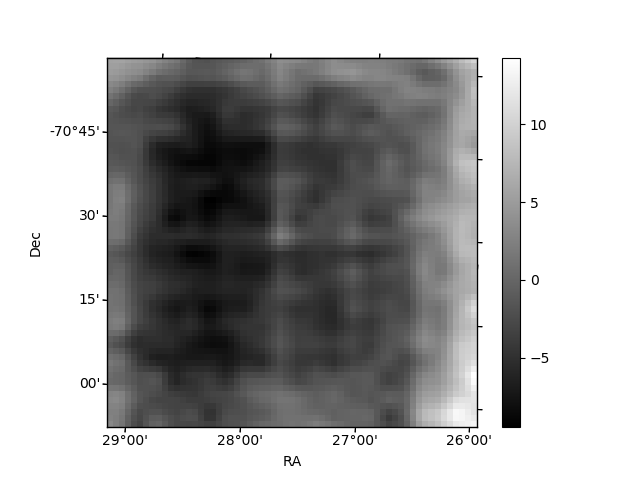
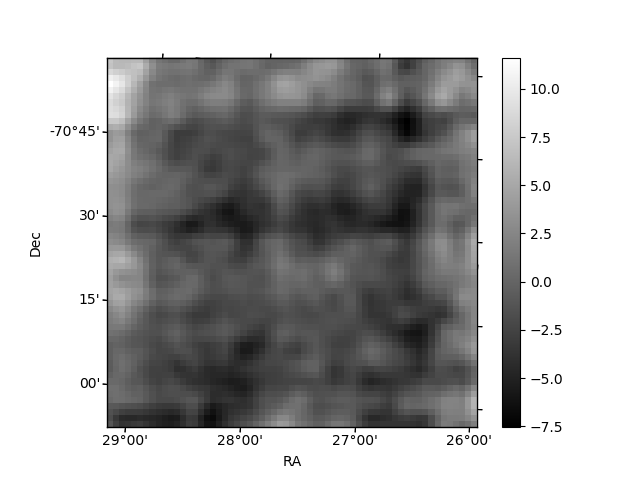
Histogram calculated using DETX and DETY for each event in the final _common_clean file
| Quadrant A | 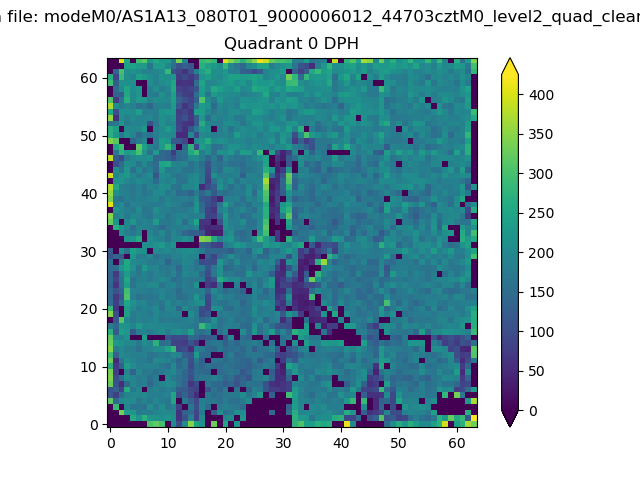 |
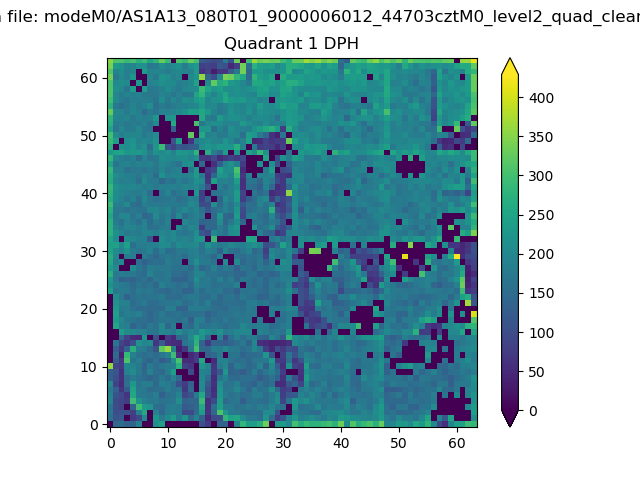 |
Quadrant B |
|---|---|---|---|
| Quadrant D | 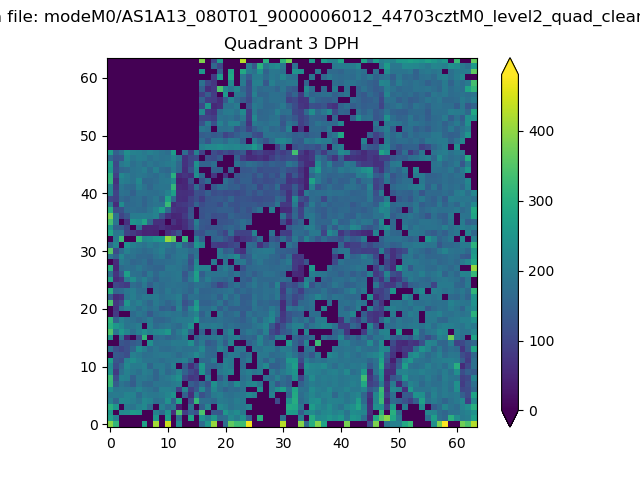 |
 |
Quadrant C |
| Plot type | Count rate plots | Images |
|---|---|---|
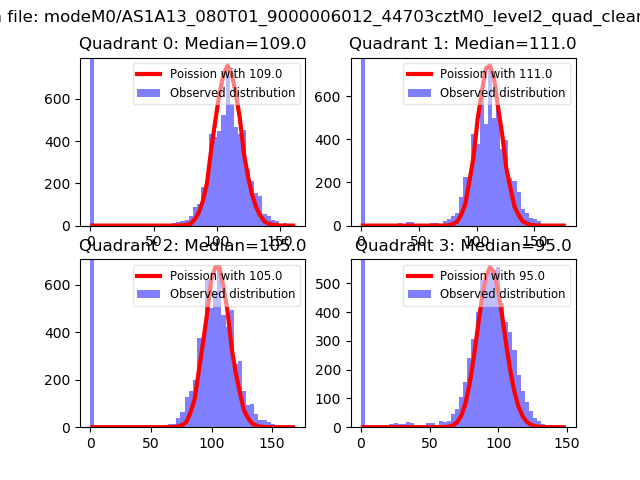
| Comparison with Poisson distribution Blue bars denote a histogram of data divided into 1 sec bins. Red curve is a Poisson curve with rate = median count rate of data. |
 |
 |
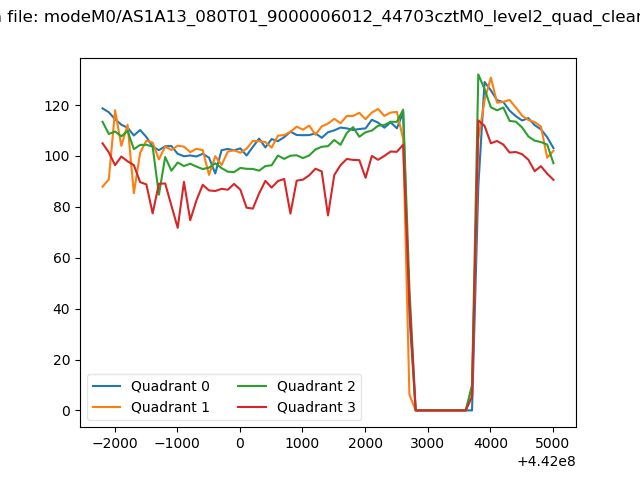
| Quadrant-wise count rates Data is divided into 100 sec bins |
 |
|
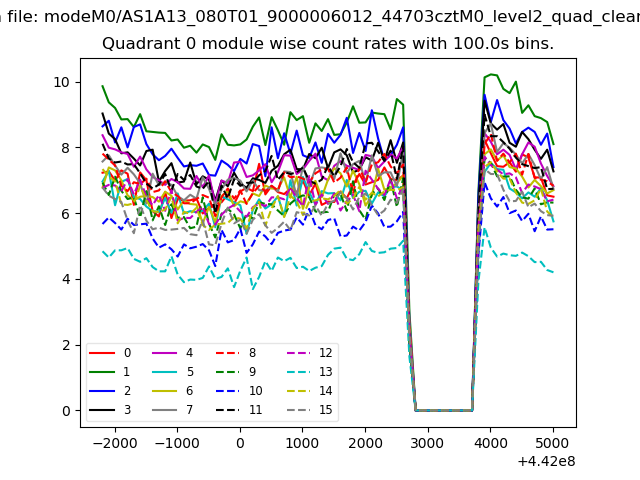
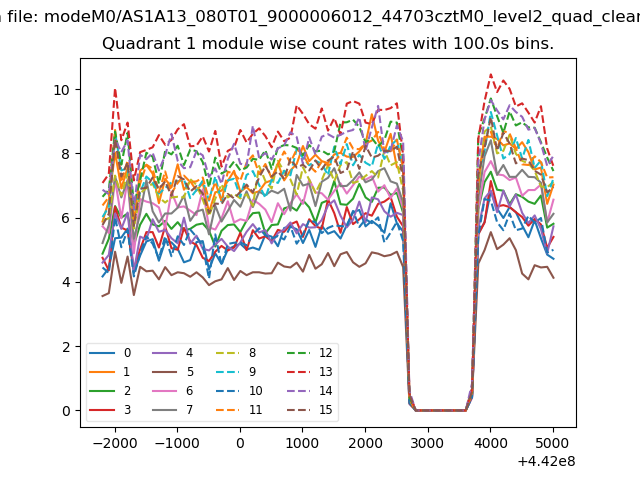
| Module-wise count rates for Quadrant A Data is divided into 100 sec bins |
 |
 |
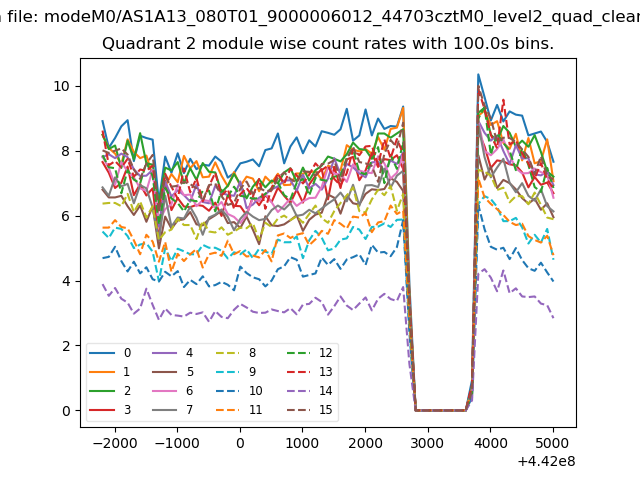
| Module-wise count rates for Quadrant B Data is divided into 100 sec bins |
 |
 |
| Module-wise count rates for Quadrant C Data is divided into 100 sec bins |
 |
 |
| Module-wise count rates for Quadrant D Data is divided into 100 sec bins |
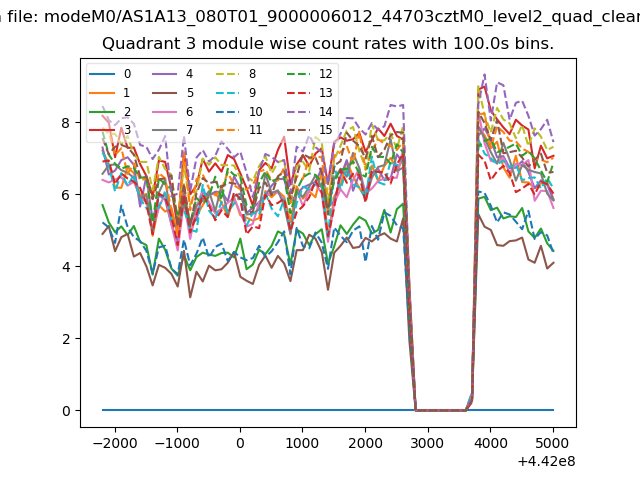 |
 |
| Parameter | Plot |
|---|---|
| CZT HV Monitor | 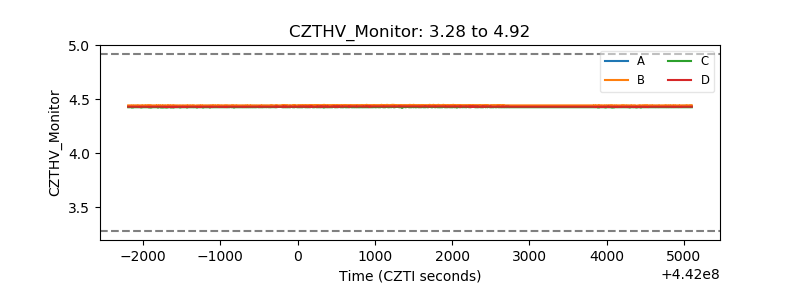 |
| D_VDD | 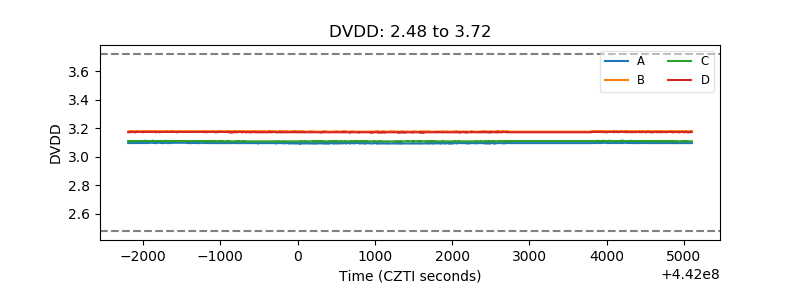 |
| Temperature 1 | 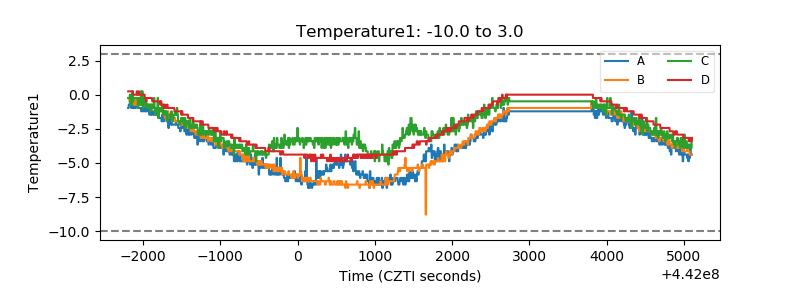 |
| Veto HV Monitor | 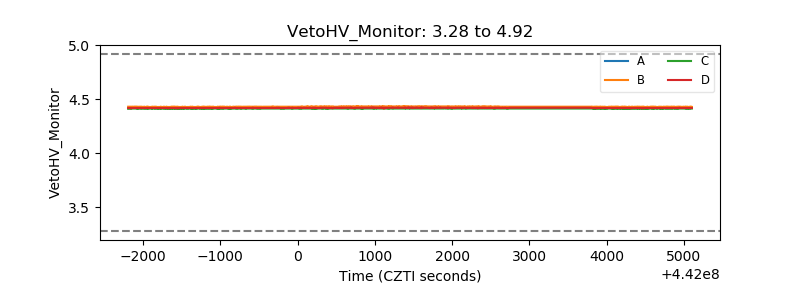 |
| Veto LLD | 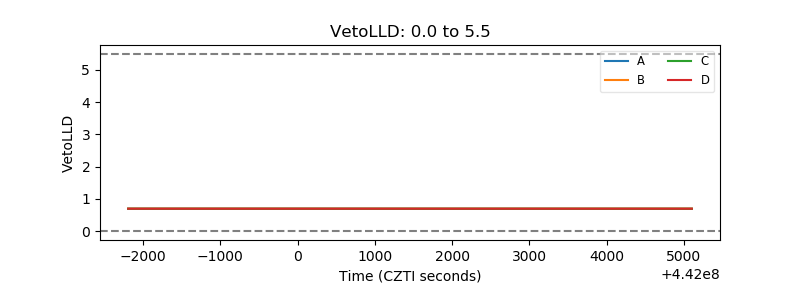 |
| Alpha Counter | 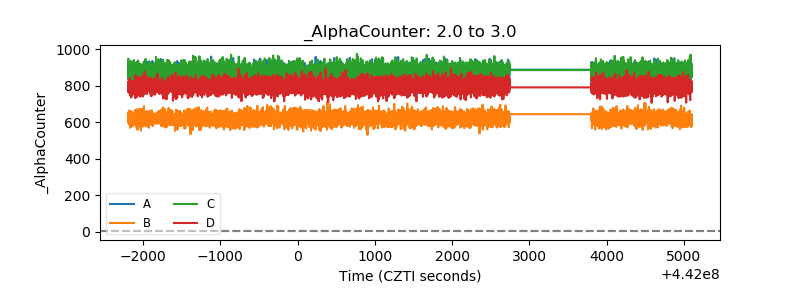 |
| _CPM_Rate | 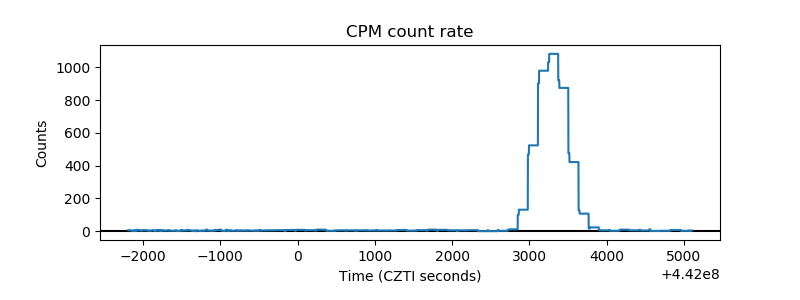 |
| CZT Counter | 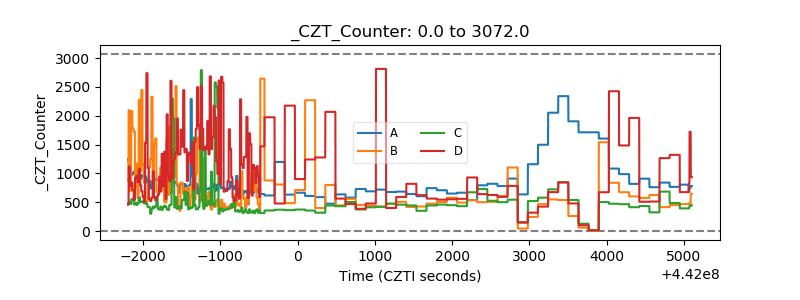 |
| +2.5 Volts monitor | 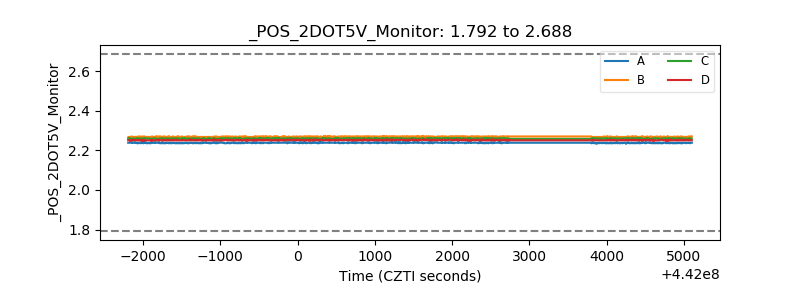 |
| +5 Volts monitor | 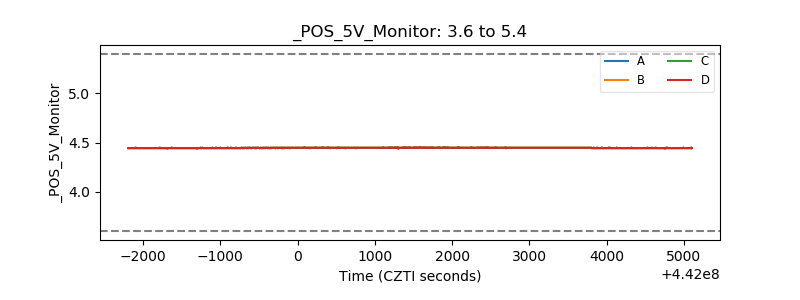 |
| _ROLL_ROT | 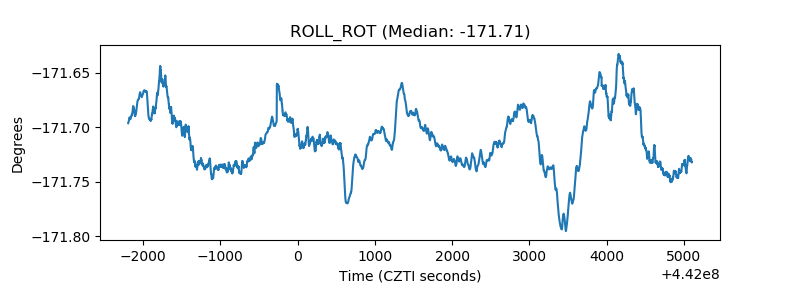 |
| _Roll_DEC | 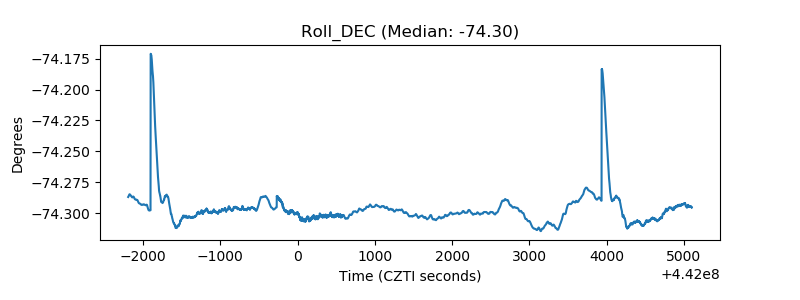 |
| _Roll_RA | 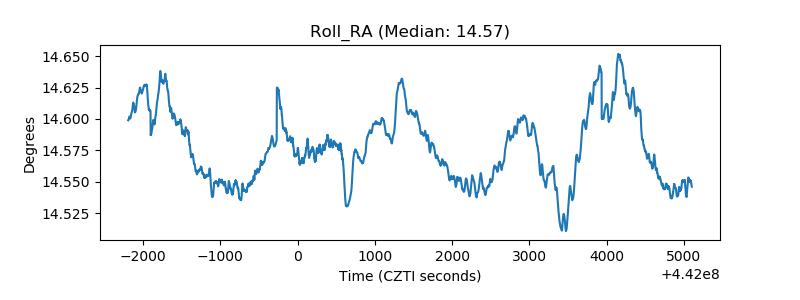 |
| Veto Counter | 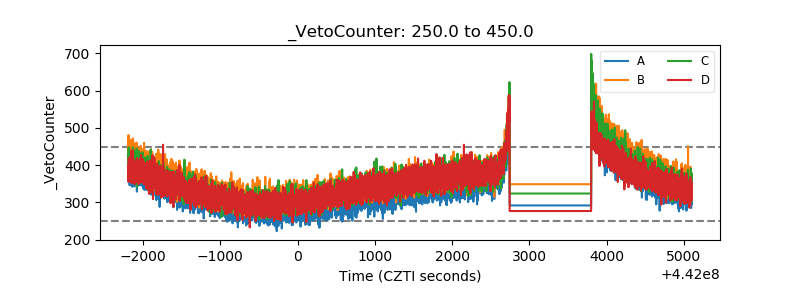 |