| Param | Original file | Final file |
|---|---|---|
| Filename | modeM0/AS1A13_009T01_9000006016_44718cztM0_level2.fits | modeM0/AS1A13_009T01_9000006016_44718cztM0_level2_quad_clean.evt |
| Size (bytes) | 318,343,680 | 56,482,560 |
| Size | 303.6 MB | 53.9 MB |
| Events in quadrant A | 3,337,637 | 365,957 |
| Events in quadrant B | 1,871,309 | 409,611 |
| Events in quadrant C | 1,647,880 | 392,180 |
| Events in quadrant D | 4,657,777 | 297,283 |
| Mode M9 | |||
|---|---|---|---|
| Quadrant | BADHDUFLAG | Total packets | Discarded packets |
| A | 0 | 11 | 0 |
| B | 0 | 11 | 0 |
| C | 0 | 11 | 0 |
| D | 0 | 11 | 0 |
| Mode SS | |||
|---|---|---|---|
| Quadrant | BADHDUFLAG | Total packets | Discarded packets |
| A | 0 | 72 | 0 |
| B | 0 | 72 | 0 |
| C | 0 | 72 | 0 |
| D | 0 | 72 | 0 |
| Mode M0 | |||
|---|---|---|---|
| Quadrant | BADHDUFLAG | Total packets | Discarded packets |
| A | 0 | 12640 | 1 |
| B | 0 | 7936 | 1 |
| C | 0 | 7289 | 2 |
| D | 0 | 16272 | 1 |
| Quadrant | Total seconds | Saturated seconds | Saturation percentage |
|---|---|---|---|
| A | 3456 | 366 | 10.590278% |
| B | 3456 | 54 | 1.562500% |
| C | 3455 | 31 | 0.897250% |
| D | 3455 | 739 | 21.389291% |
Noise dominated data is calculated using 1-second bins in cleaned event files. If a bin has >2000 counts, and if more than 50% of those come from <1% of pixels, then it is considered to be noise-dominated and hence unusable.
| Quadrant | # 1 sec bins | Bins with >0 counts | Bins with >2000 counts | High rate bins dominated by noise | Noise dominated (total time) | Noise dominated (detector-on time) | Marked lightcurve |
|---|---|---|---|---|---|---|---|
| A | 4576 | 3457 | 199 | 199 | 4.35% | 5.76% | 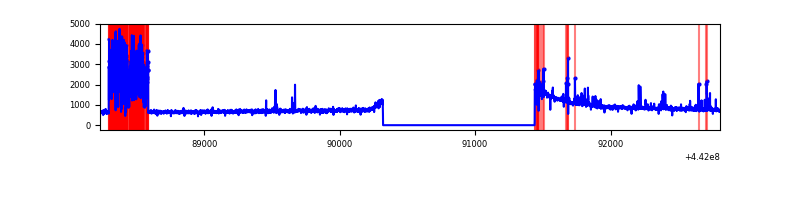 |
| B | 4576 | 3457 | 6 | 6 | 0.13% | 0.17% | 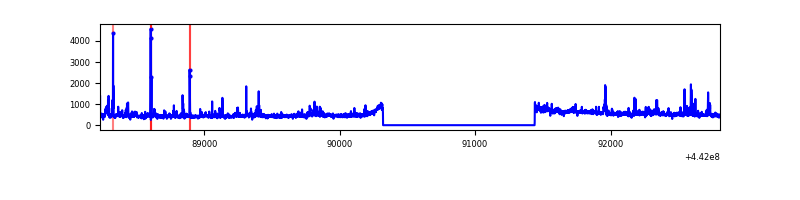 |
| C | 4575 | 3456 | 7 | 7 | 0.15% | 0.20% | 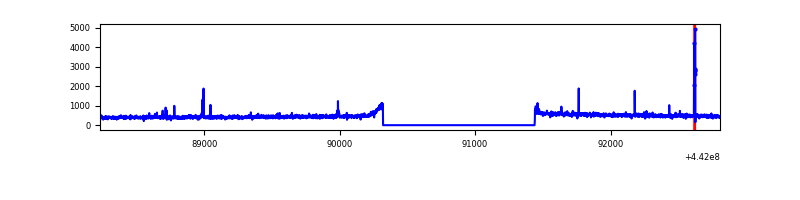 |
| D | 4575 | 3456 | 564 | 564 | 12.33% | 16.32% | 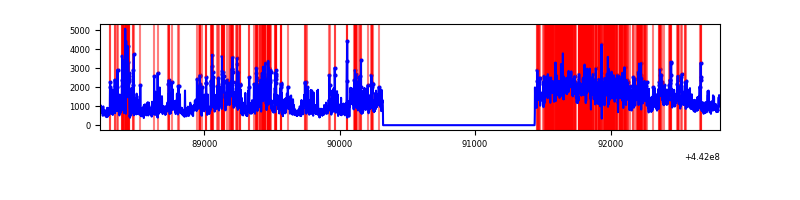 |
Top three noisy pixels from each quadrant. If the there are fewer than three noisy pixels in the level2.evt file, extra rows are filled as -1
| Pixel properties | Quadrant properties | ||||||
|---|---|---|---|---|---|---|---|
| Quadrant | DetID | PixID | Counts | Sigma | Mean | Median | Sigma |
| A | 10 | 83 | 1091086 | 13062.25 | 398 | 390 | 83.5 |
| A | 15 | 223 | 612091 | 7325.77 | 398 | 390 | 83.5 |
| A | 13 | 248 | 81114 | 966.76 | 398 | 390 | 83.5 |
| B | 0 | 189 | 93798 | 1140.9 | 410 | 398 | 81.9 |
| B | 5 | 172 | 41475 | 501.76 | 410 | 398 | 81.9 |
| B | 0 | 190 | 40008 | 483.84 | 410 | 398 | 81.9 |
| C | 14 | 254 | 43866 | 451.62 | 404 | 408 | 96.2 |
| C | 3 | 233 | 11934 | 119.78 | 404 | 408 | 96.2 |
| C | 12 | 250 | 7421 | 72.88 | 404 | 408 | 96.2 |
| D | 11 | 241 | 1931984 | 20353.71 | 378 | 366 | 94.9 |
| D | 13 | 174 | 373596 | 3932.77 | 378 | 366 | 94.9 |
| D | 1 | 52 | 366237 | 3855.23 | 378 | 366 | 94.9 |
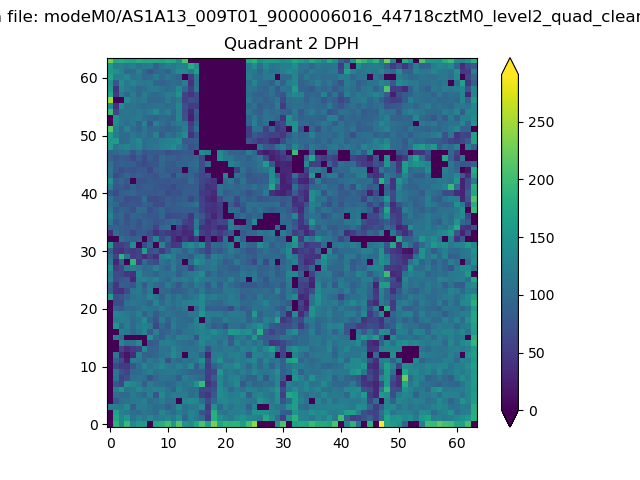
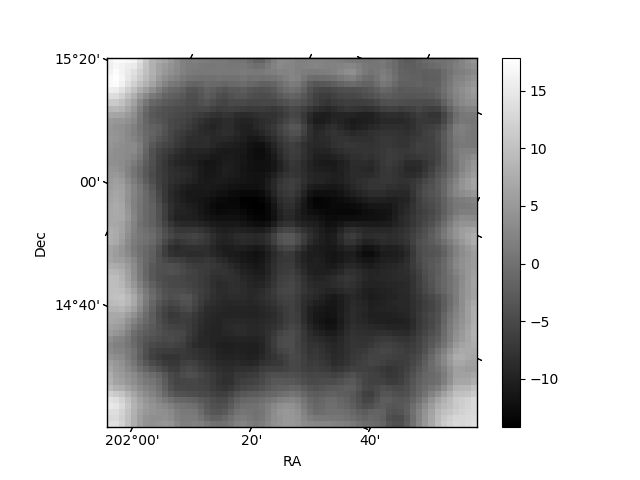
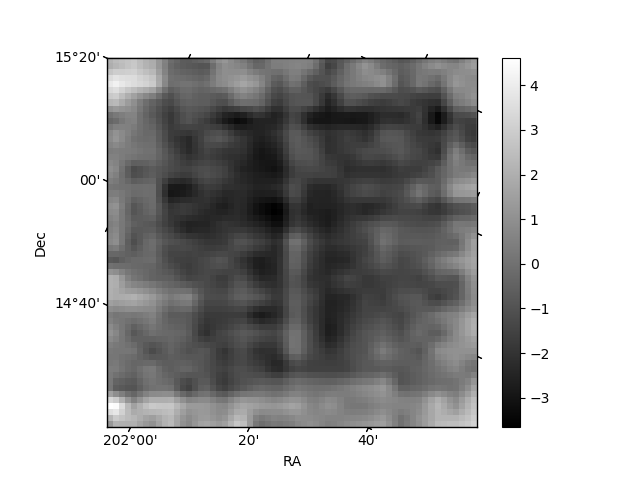
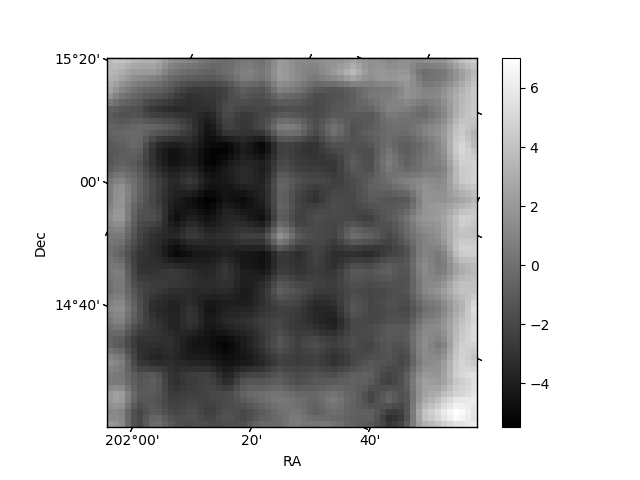
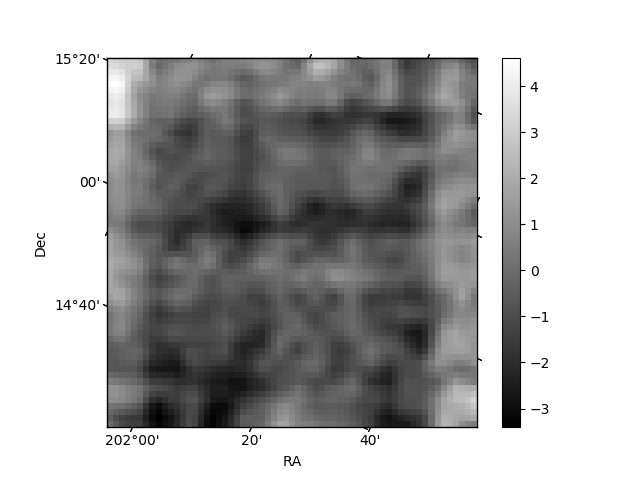
Histogram calculated using DETX and DETY for each event in the final _common_clean file
| Quadrant A | 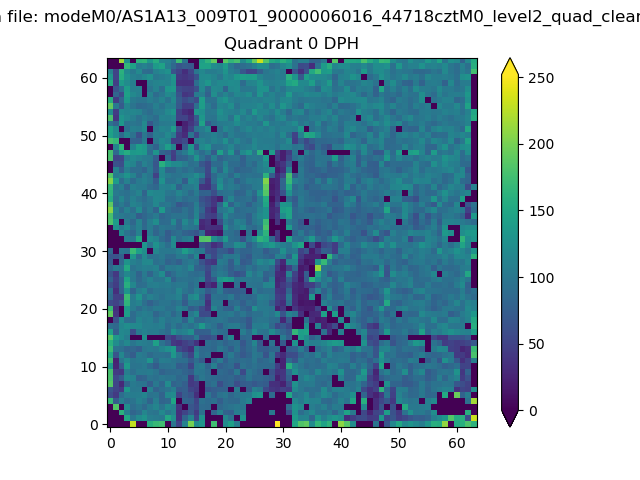 |
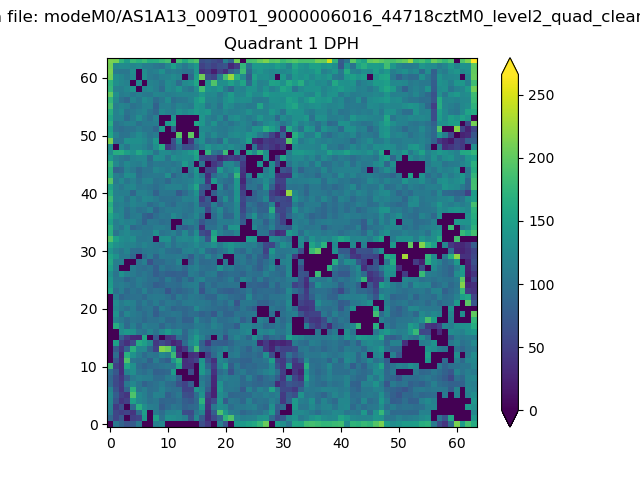 |
Quadrant B |
|---|---|---|---|
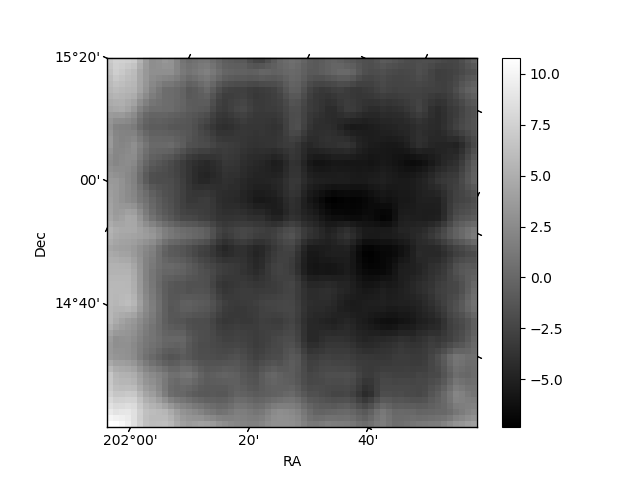
| Quadrant D | 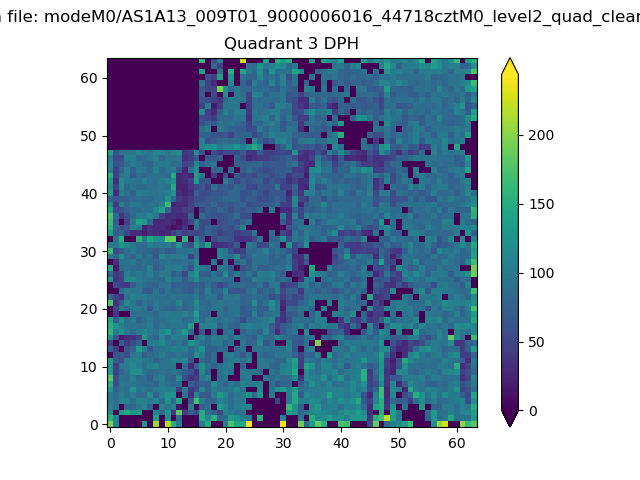 |
 |
Quadrant C |
| Plot type | Count rate plots | Images |
|---|---|---|
| Comparison with Poisson distribution Blue bars denote a histogram of data divided into 1 sec bins. Red curve is a Poisson curve with rate = median count rate of data. |
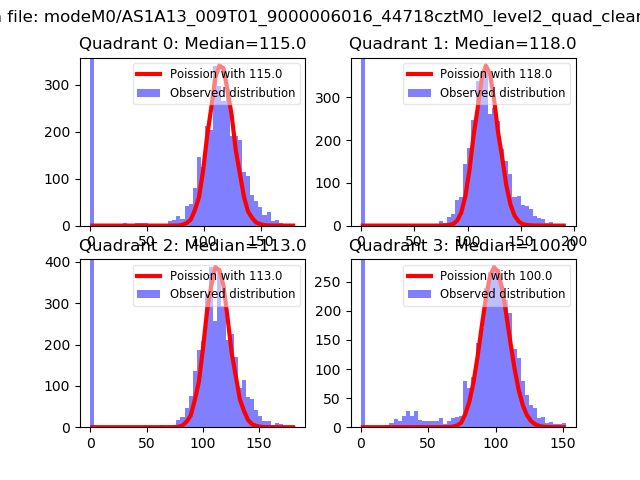 |
 |
| Quadrant-wise count rates Data is divided into 100 sec bins |
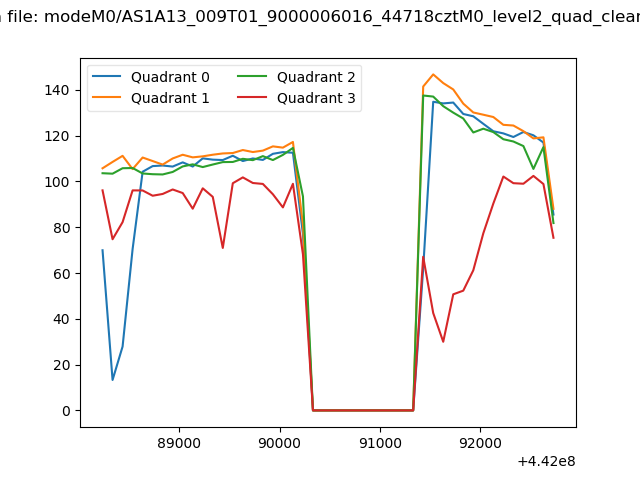 |
|
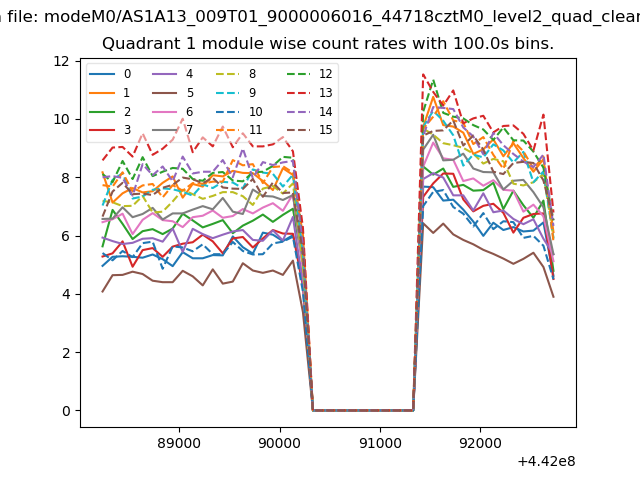
| Module-wise count rates for Quadrant A Data is divided into 100 sec bins |
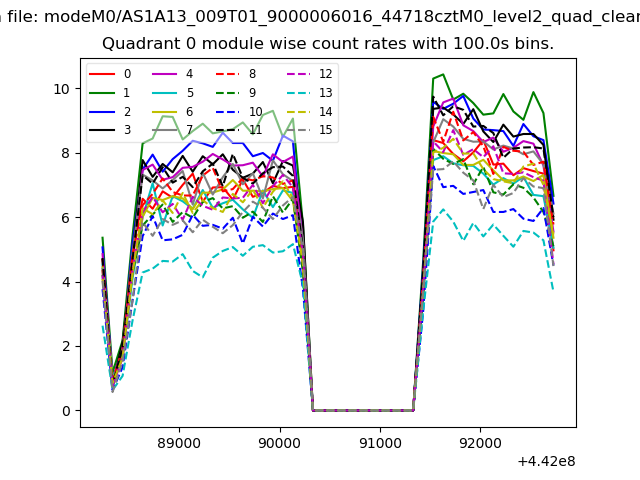 |
 |
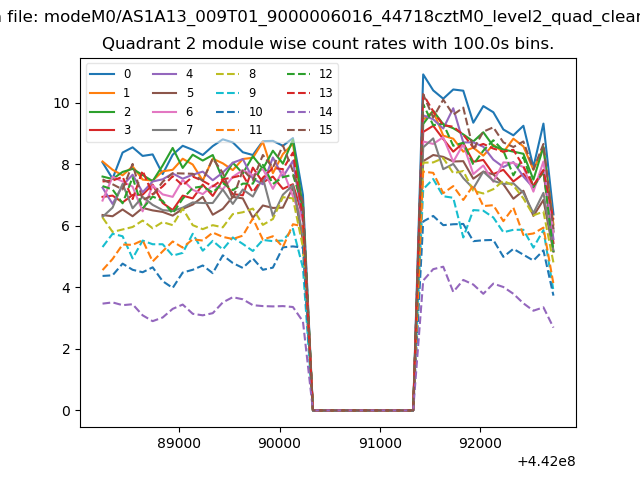
| Module-wise count rates for Quadrant B Data is divided into 100 sec bins |
 |
 |
| Module-wise count rates for Quadrant C Data is divided into 100 sec bins |
 |
 |
| Module-wise count rates for Quadrant D Data is divided into 100 sec bins |
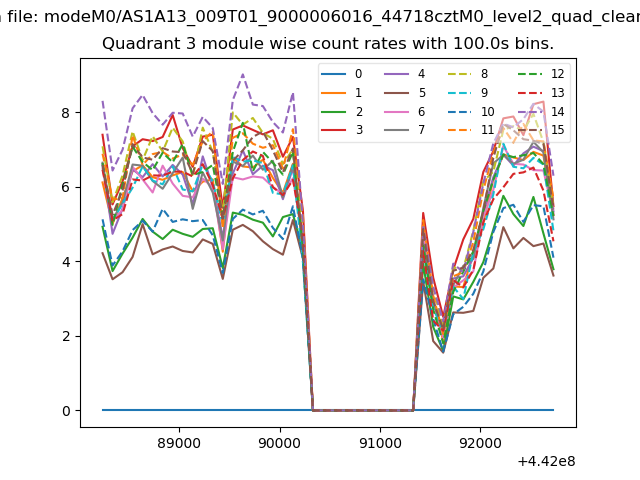 |
 |
| Parameter | Plot |
|---|---|
| CZT HV Monitor | 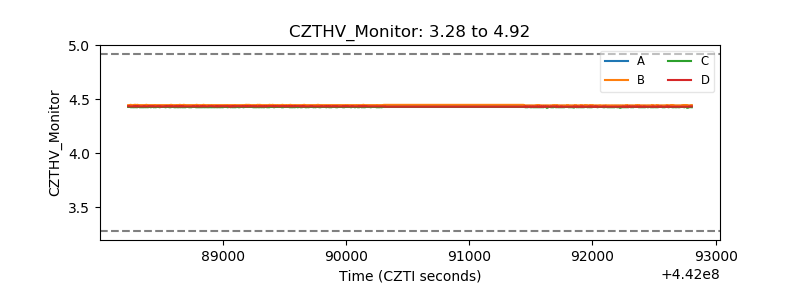 |
| D_VDD | 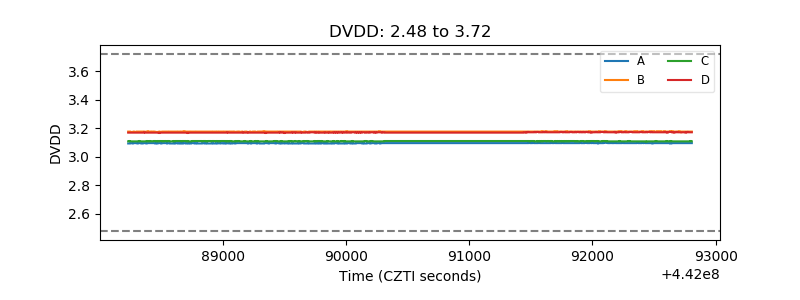 |
| Temperature 1 | 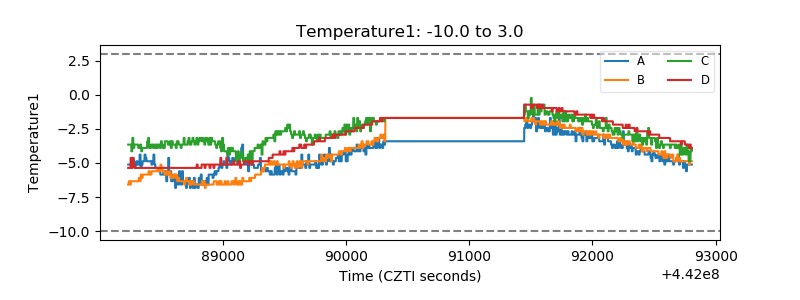 |
| Veto HV Monitor | 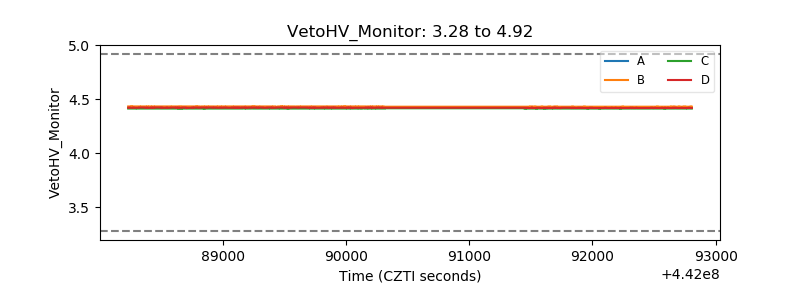 |
| Veto LLD | 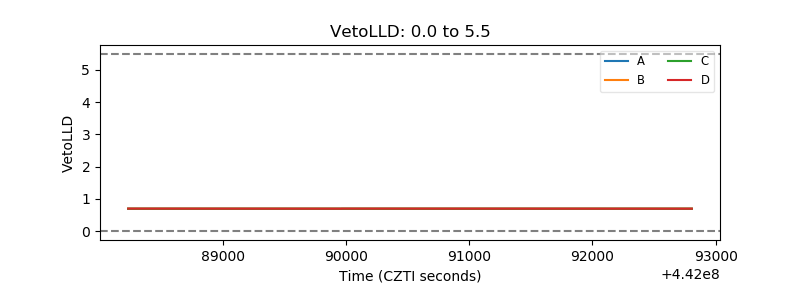 |
| Alpha Counter | 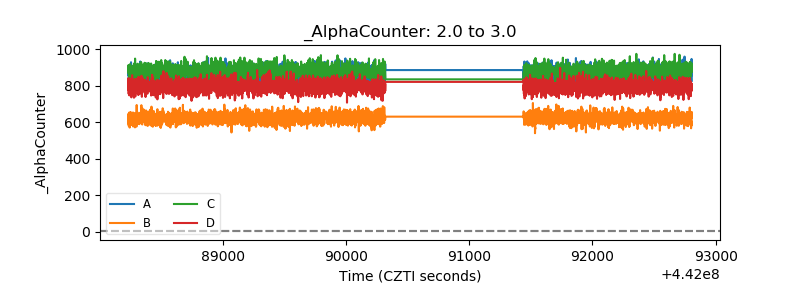 |
| _CPM_Rate | 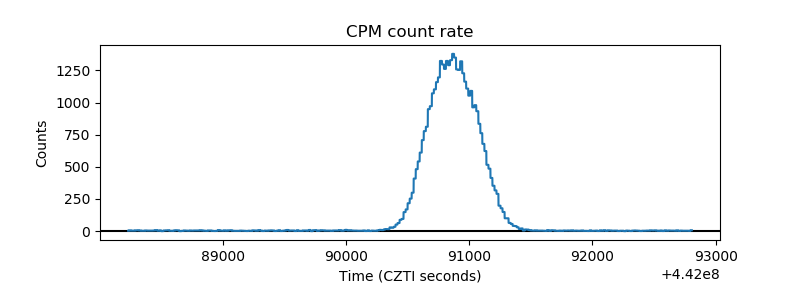 |
| CZT Counter | 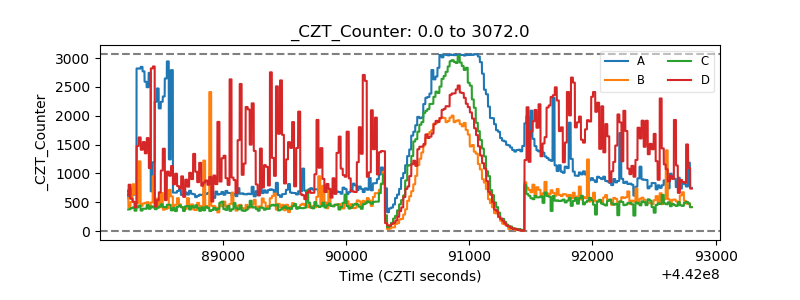 |
| +2.5 Volts monitor | 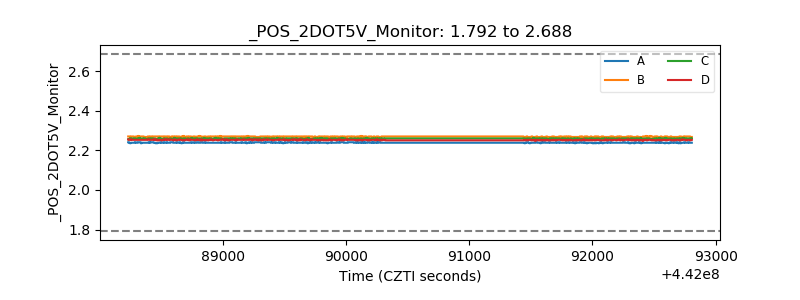 |
| +5 Volts monitor | 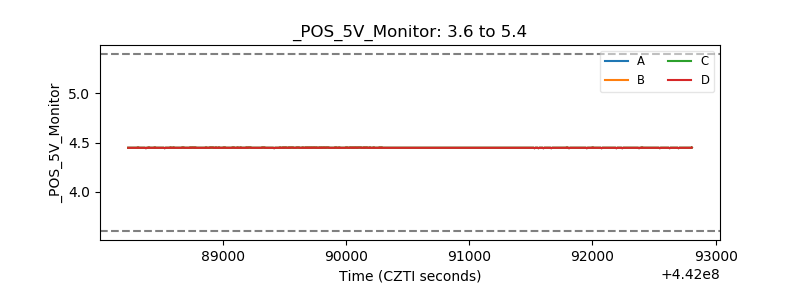 |
| _ROLL_ROT | 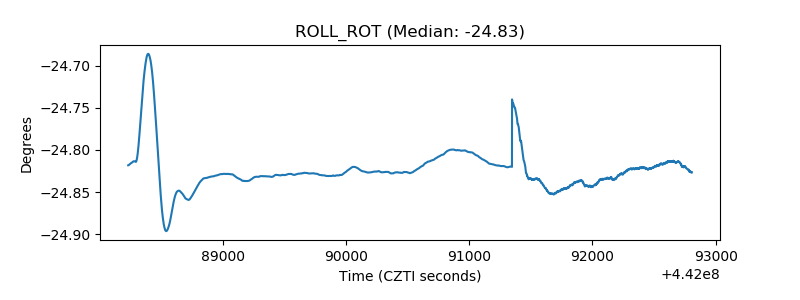 |
| _Roll_DEC | 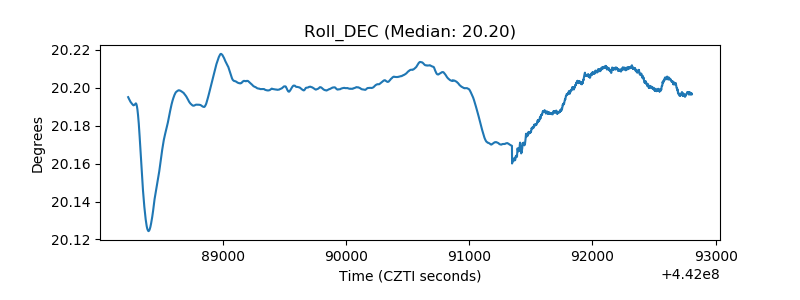 |
| _Roll_RA | 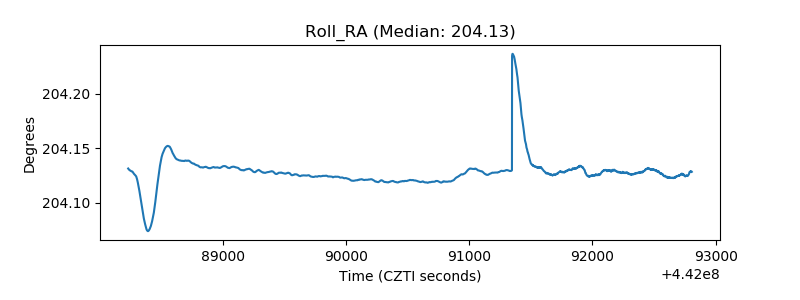 |
| Veto Counter | 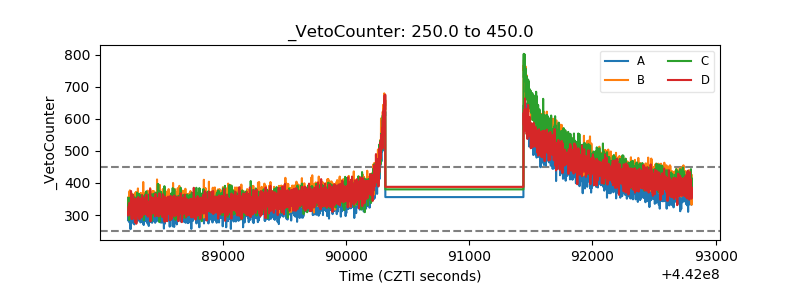 |