| Param | Original file | Final file |
|---|---|---|
| Filename | modeM0/AS1A13_009T01_9000006016_44719cztM0_level2.fits | modeM0/AS1A13_009T01_9000006016_44719cztM0_level2_quad_clean.evt |
| Size (bytes) | 585,080,640 | 103,320,000 |
| Size | 558.0 MB | 98.5 MB |
| Events in quadrant A | 5,141,857 | 728,783 |
| Events in quadrant B | 3,585,068 | 765,632 |
| Events in quadrant C | 3,053,753 | 732,950 |
| Events in quadrant D | 9,387,252 | 460,448 |
| Mode M9 | |||
|---|---|---|---|
| Quadrant | BADHDUFLAG | Total packets | Discarded packets |
| A | 0 | 17 | 0 |
| B | 0 | 18 | 0 |
| C | 0 | 18 | 0 |
| D | 0 | 18 | 0 |
| Mode SS | |||
|---|---|---|---|
| Quadrant | BADHDUFLAG | Total packets | Discarded packets |
| A | 0 | 128 | 0 |
| B | 0 | 128 | 0 |
| C | 0 | 128 | 0 |
| D | 0 | 128 | 0 |
| Mode M0 | |||
|---|---|---|---|
| Quadrant | BADHDUFLAG | Total packets | Discarded packets |
| A | 0 | 20457 | 2 |
| B | 0 | 14888 | 2 |
| C | 0 | 13429 | 2 |
| D | 0 | 32305 | 4 |
| Quadrant | Total seconds | Saturated seconds | Saturation percentage |
|---|---|---|---|
| A | 6318 | 214 | 3.387148% |
| B | 6318 | 110 | 1.741057% |
| C | 6318 | 51 | 0.807217% |
| D | 6317 | 2124 | 33.623555% |
Noise dominated data is calculated using 1-second bins in cleaned event files. If a bin has >2000 counts, and if more than 50% of those come from <1% of pixels, then it is considered to be noise-dominated and hence unusable.
| Quadrant | # 1 sec bins | Bins with >0 counts | Bins with >2000 counts | High rate bins dominated by noise | Noise dominated (total time) | Noise dominated (detector-on time) | Marked lightcurve |
|---|---|---|---|---|---|---|---|
| A | 7513 | 6319 | 25 | 25 | 0.33% | 0.40% | 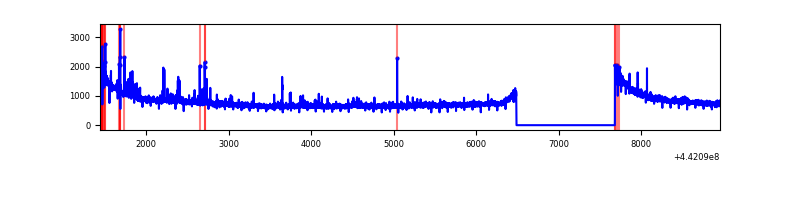 |
| B | 7513 | 6319 | 37 | 37 | 0.49% | 0.59% | 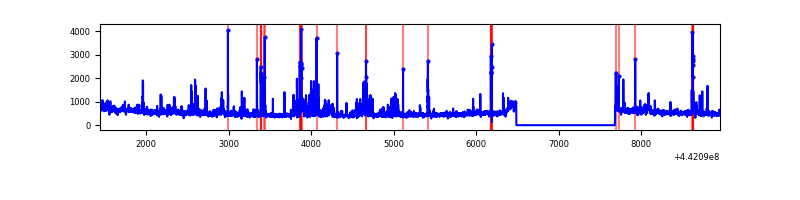 |
| C | 7513 | 6319 | 20 | 20 | 0.27% | 0.32% | 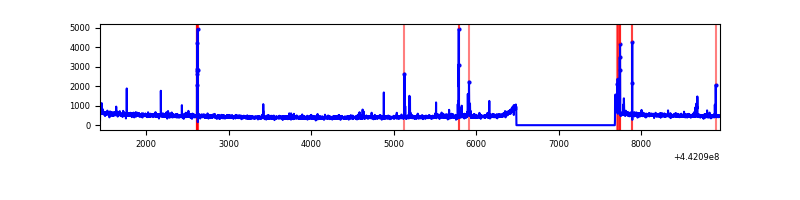 |
| D | 7512 | 6318 | 1755 | 1755 | 23.36% | 27.78% | 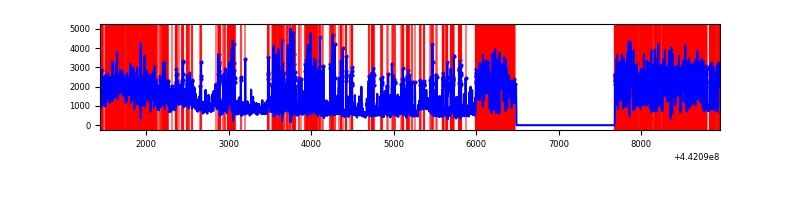 |
Top three noisy pixels from each quadrant. If the there are fewer than three noisy pixels in the level2.evt file, extra rows are filled as -1
| Pixel properties | Quadrant properties | ||||||
|---|---|---|---|---|---|---|---|
| Quadrant | DetID | PixID | Counts | Sigma | Mean | Median | Sigma |
| A | 10 | 83 | 2093248 | 13446.66 | 747 | 732 | 155.6 |
| A | 13 | 248 | 91728 | 584.75 | 747 | 732 | 155.6 |
| A | 15 | 223 | 33487 | 210.49 | 747 | 732 | 155.6 |
| B | 0 | 190 | 206074 | 1382.44 | 754 | 733 | 148.5 |
| B | 0 | 189 | 158870 | 1064.64 | 754 | 733 | 148.5 |
| B | 5 | 255 | 87550 | 584.49 | 754 | 733 | 148.5 |
| C | 14 | 254 | 51373 | 290.98 | 739 | 746 | 174.0 |
| C | 12 | 2 | 42792 | 241.66 | 739 | 746 | 174.0 |
| C | 12 | 250 | 31247 | 175.3 | 739 | 746 | 174.0 |
| D | 11 | 241 | 3897121 | 23749.42 | 639 | 619 | 164.1 |
| D | 1 | 52 | 724737 | 4413.54 | 639 | 619 | 164.1 |
| D | 13 | 249 | 720074 | 4385.12 | 639 | 619 | 164.1 |
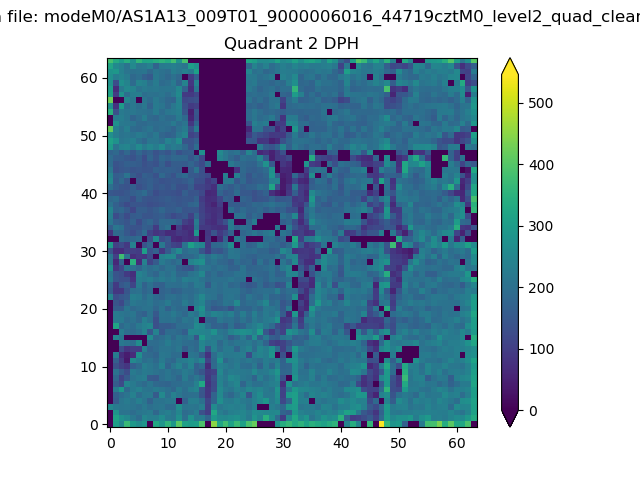
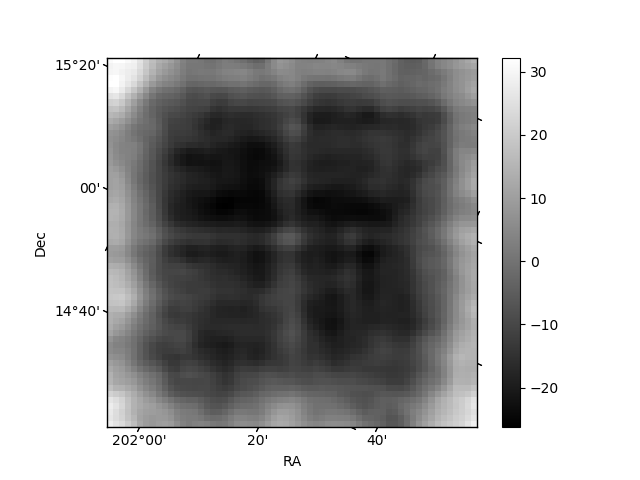
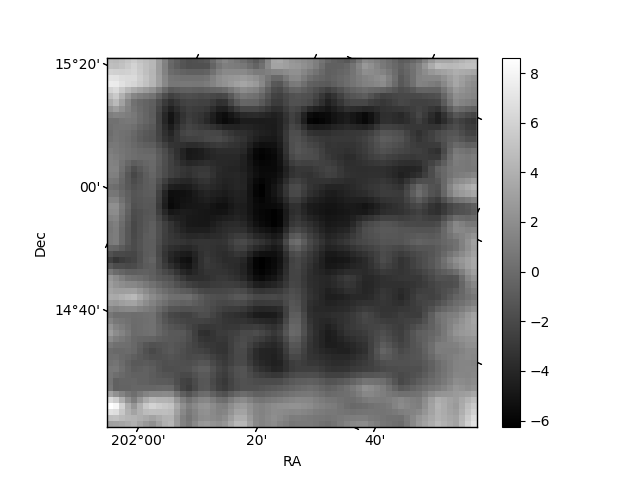
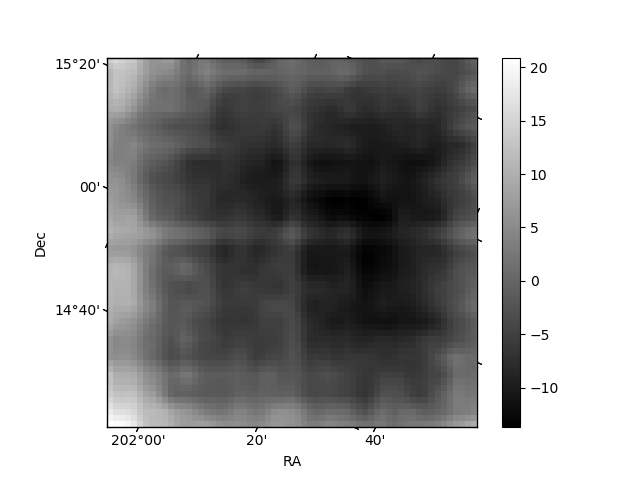
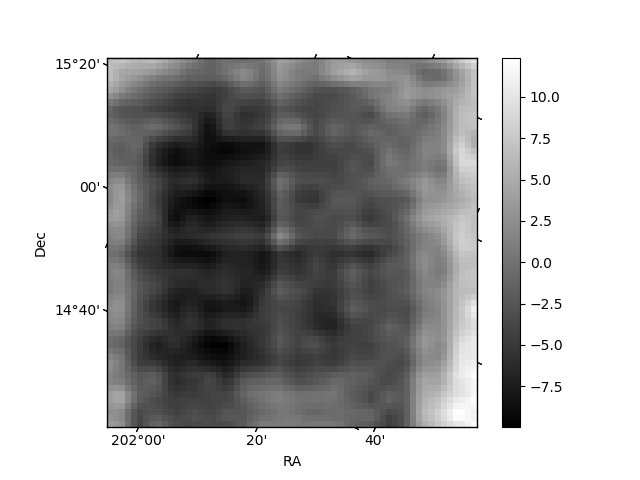
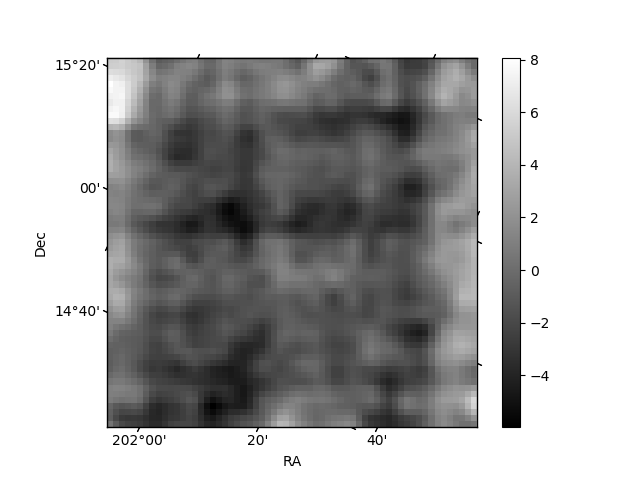
Histogram calculated using DETX and DETY for each event in the final _common_clean file
| Quadrant A | 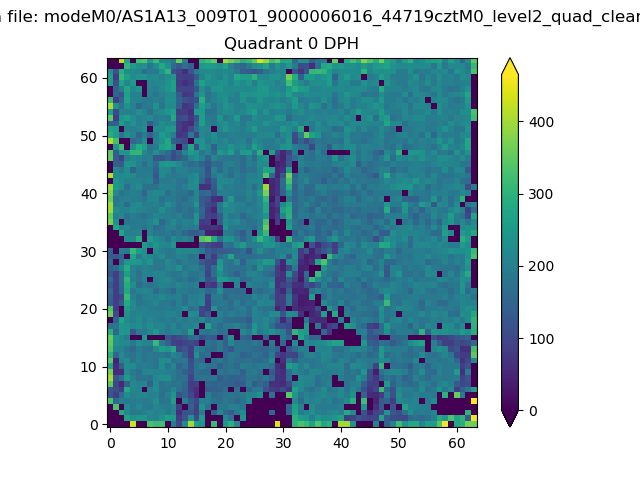 |
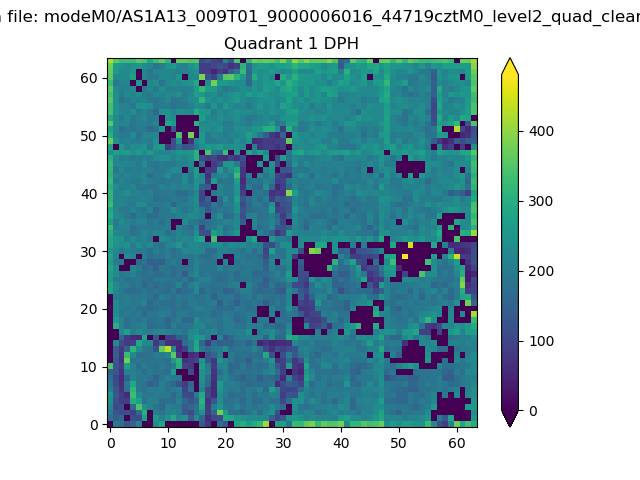 |
Quadrant B |
|---|---|---|---|
| Quadrant D | 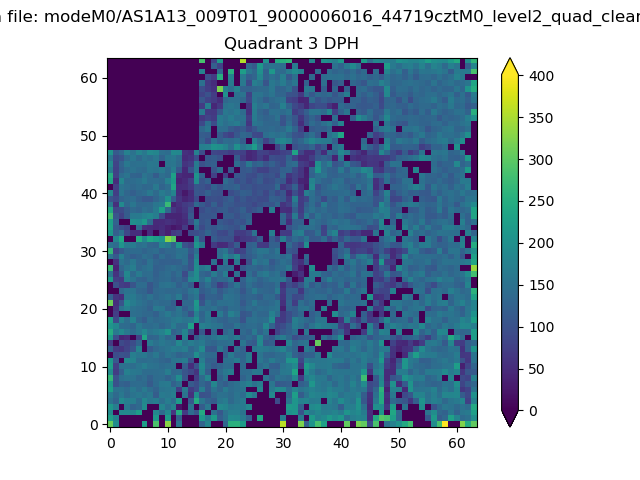 |
 |
Quadrant C |
| Plot type | Count rate plots | Images |
|---|---|---|
| Comparison with Poisson distribution Blue bars denote a histogram of data divided into 1 sec bins. Red curve is a Poisson curve with rate = median count rate of data. |
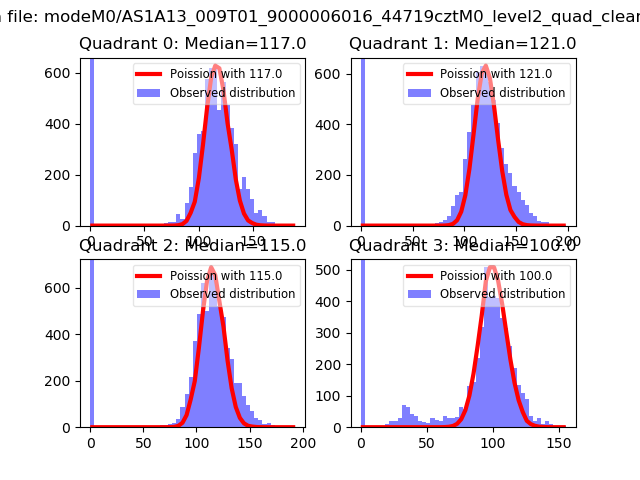 |
 |
| Quadrant-wise count rates Data is divided into 100 sec bins |
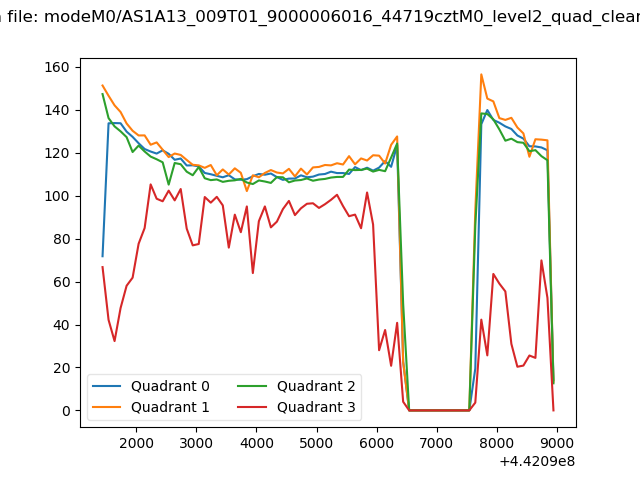 |
|
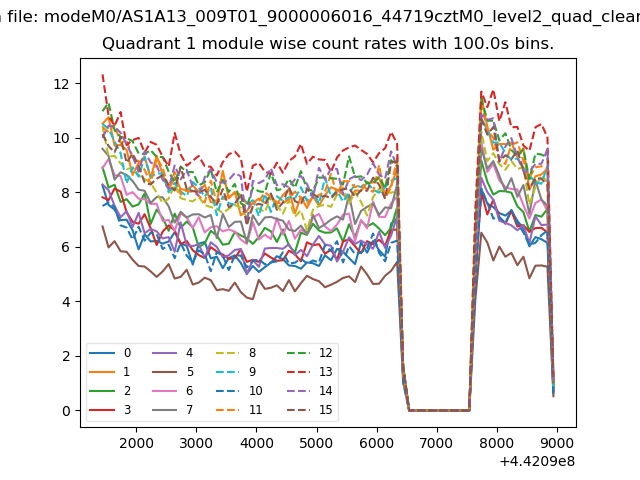
| Module-wise count rates for Quadrant A Data is divided into 100 sec bins |
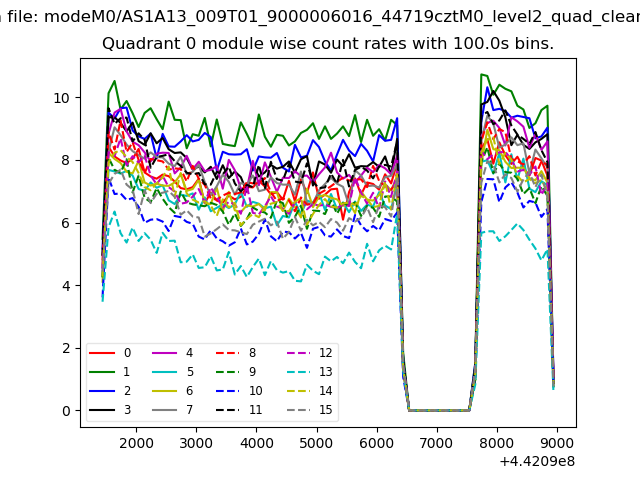 |
 |
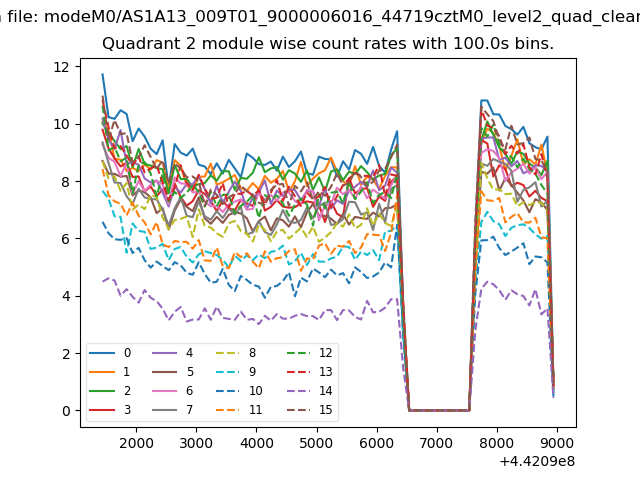
| Module-wise count rates for Quadrant B Data is divided into 100 sec bins |
 |
 |
| Module-wise count rates for Quadrant C Data is divided into 100 sec bins |
 |
 |
| Module-wise count rates for Quadrant D Data is divided into 100 sec bins |
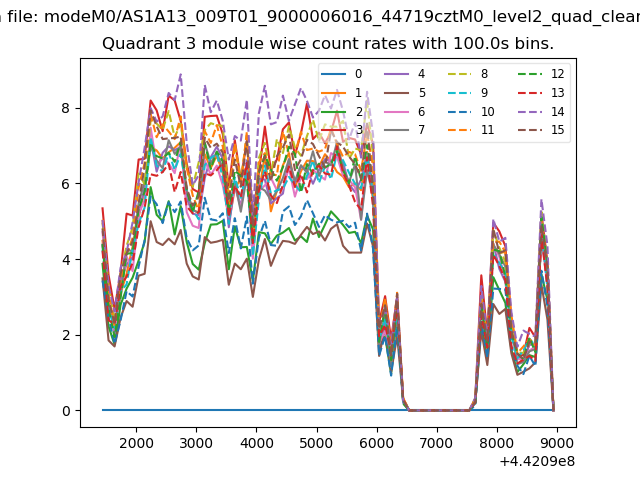 |
 |
| Parameter | Plot |
|---|---|
| CZT HV Monitor |  |
| D_VDD | 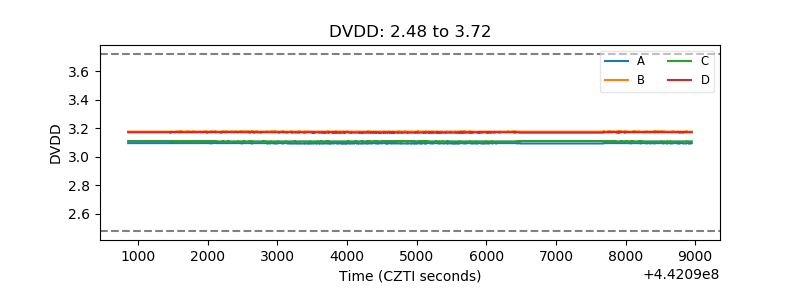 |
| Temperature 1 | 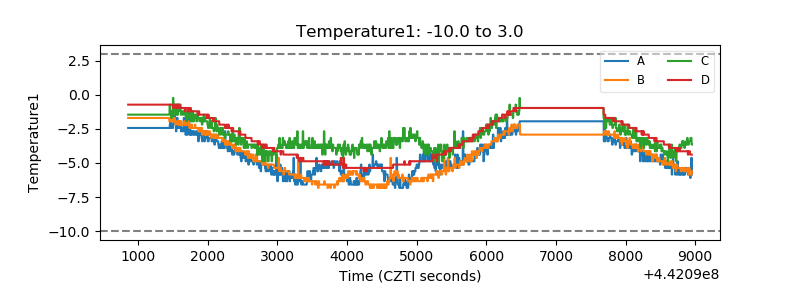 |
| Veto HV Monitor | 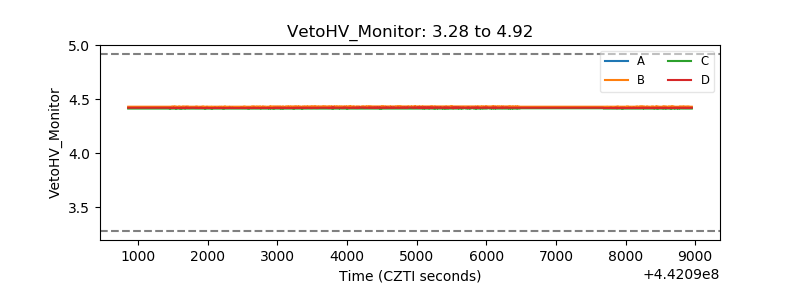 |
| Veto LLD | 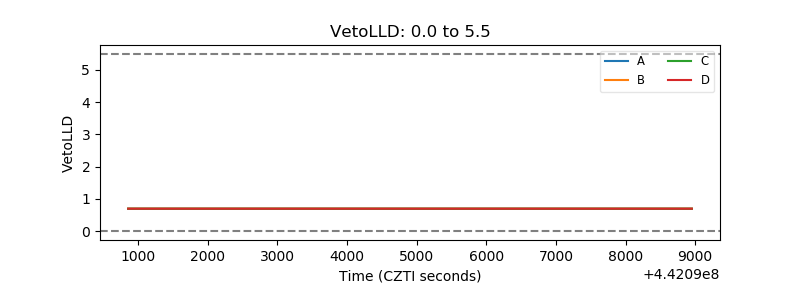 |
| Alpha Counter | 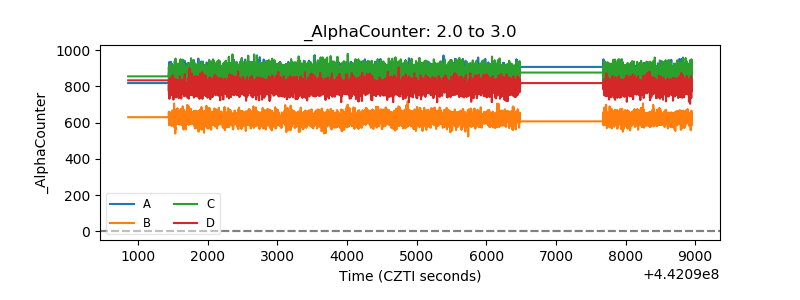 |
| _CPM_Rate | 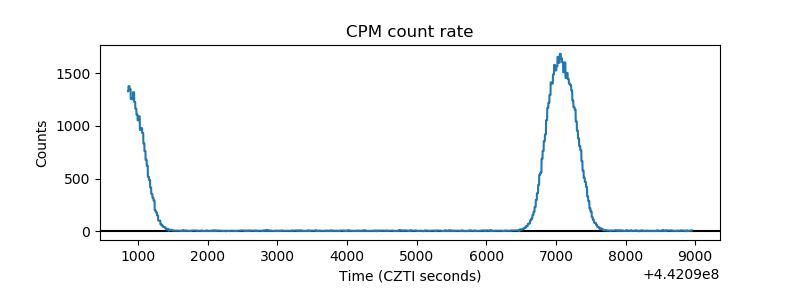 |
| CZT Counter | 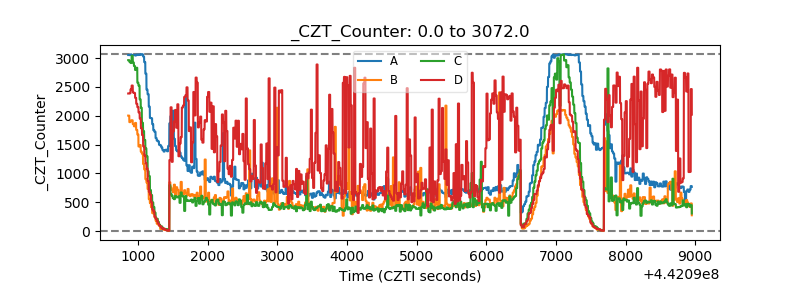 |
| +2.5 Volts monitor | 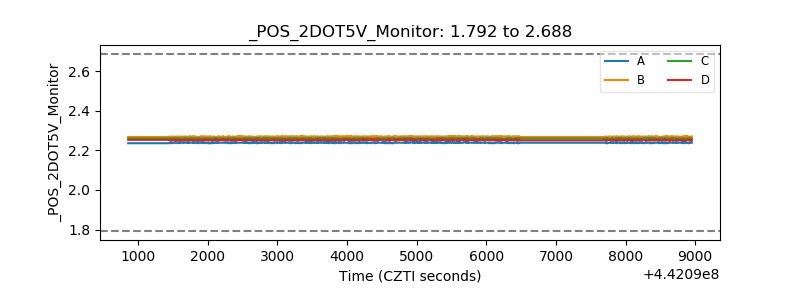 |
| +5 Volts monitor | 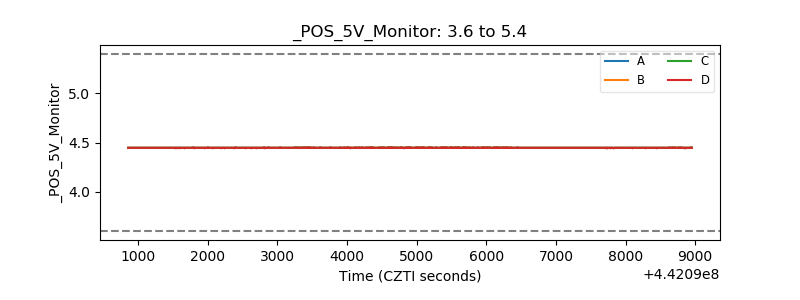 |
| _ROLL_ROT | 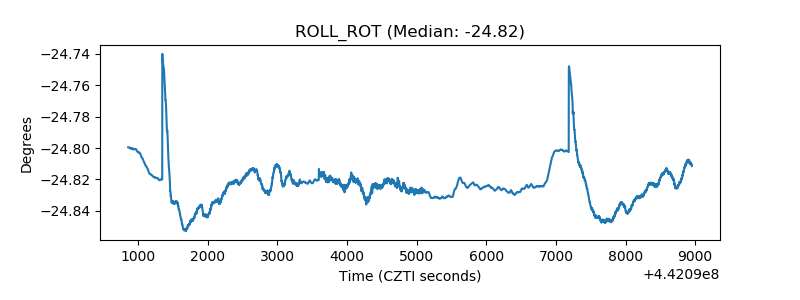 |
| _Roll_DEC | 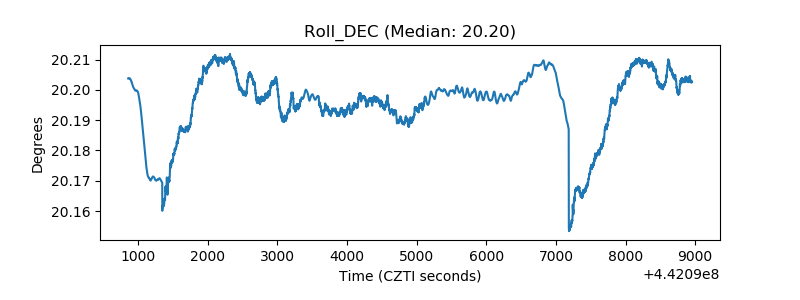 |
| _Roll_RA | 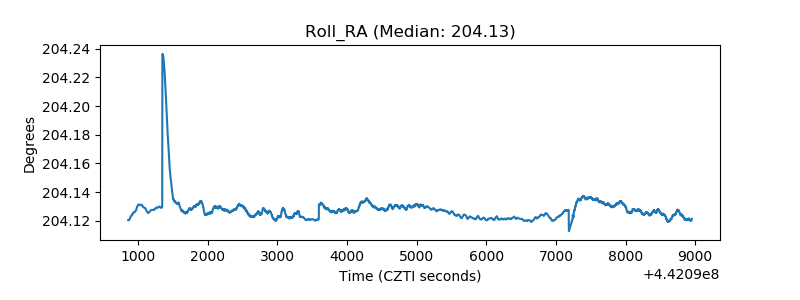 |
| Veto Counter | 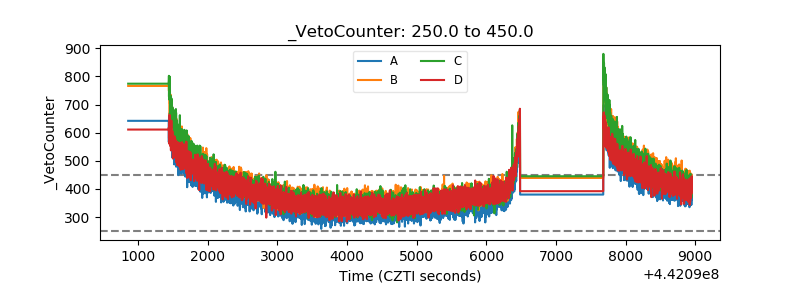 |