| Param | Original file | Final file |
|---|---|---|
| Filename | modeM0/AS1A13_009T01_9000006016_44720cztM0_level2.fits | modeM0/AS1A13_009T01_9000006016_44720cztM0_level2_quad_clean.evt |
| Size (bytes) | 621,313,920 | 107,763,840 |
| Size | 592.5 MB | 102.8 MB |
| Events in quadrant A | 5,277,835 | 762,334 |
| Events in quadrant B | 3,547,276 | 807,922 |
| Events in quadrant C | 3,208,829 | 775,561 |
| Events in quadrant D | 10,454,171 | 457,688 |
| Mode M9 | |||
|---|---|---|---|
| Quadrant | BADHDUFLAG | Total packets | Discarded packets |
| A | 0 | 24 | 0 |
| B | 0 | 24 | 0 |
| C | 0 | 24 | 0 |
| D | 0 | 24 | 0 |
| Mode SS | |||
|---|---|---|---|
| Quadrant | BADHDUFLAG | Total packets | Discarded packets |
| A | 0 | 136 | 0 |
| B | 0 | 136 | 0 |
| C | 0 | 136 | 0 |
| D | 0 | 136 | 0 |
| Mode M0 | |||
|---|---|---|---|
| Quadrant | BADHDUFLAG | Total packets | Discarded packets |
| A | 0 | 21199 | 2 |
| B | 0 | 14947 | 2 |
| C | 0 | 14029 | 2 |
| D | 0 | 35620 | 2 |
| Quadrant | Total seconds | Saturated seconds | Saturation percentage |
|---|---|---|---|
| A | 6589 | 277 | 4.203976% |
| B | 6590 | 170 | 2.579666% |
| C | 6590 | 66 | 1.001517% |
| D | 6590 | 2492 | 37.814871% |
Noise dominated data is calculated using 1-second bins in cleaned event files. If a bin has >2000 counts, and if more than 50% of those come from <1% of pixels, then it is considered to be noise-dominated and hence unusable.
| Quadrant | # 1 sec bins | Bins with >0 counts | Bins with >2000 counts | High rate bins dominated by noise | Noise dominated (total time) | Noise dominated (detector-on time) | Marked lightcurve |
|---|---|---|---|---|---|---|---|
| A | 8999 | 6591 | 17 | 17 | 0.19% | 0.26% | 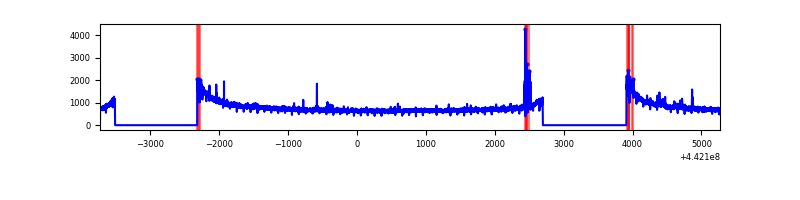 |
| B | 9000 | 6592 | 29 | 29 | 0.32% | 0.44% | 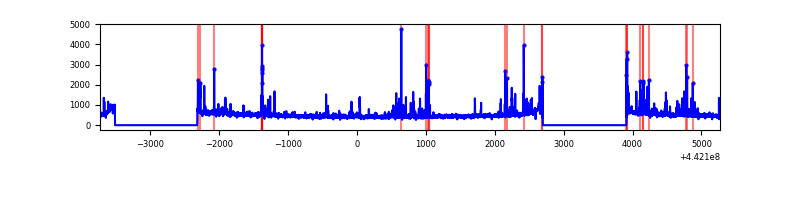 |
| C | 9000 | 6592 | 15 | 15 | 0.17% | 0.23% | 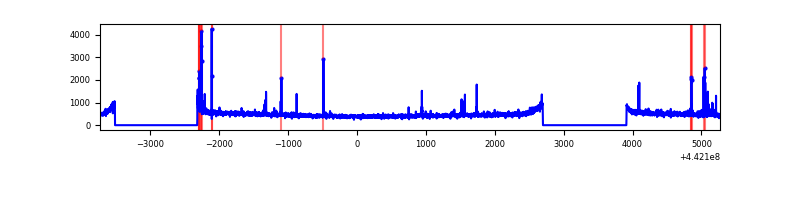 |
| D | 9000 | 6592 | 2157 | 2157 | 23.97% | 32.72% | 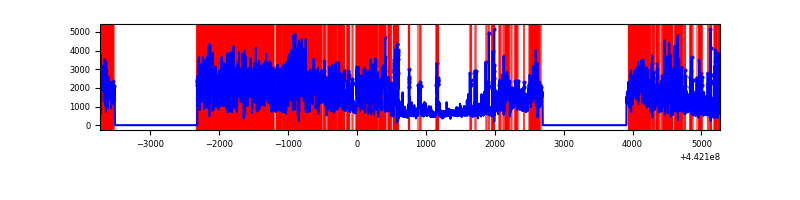 |
Top three noisy pixels from each quadrant. If the there are fewer than three noisy pixels in the level2.evt file, extra rows are filled as -1
| Pixel properties | Quadrant properties | ||||||
|---|---|---|---|---|---|---|---|
| Quadrant | DetID | PixID | Counts | Sigma | Mean | Median | Sigma |
| A | 10 | 83 | 2076246 | 12551.5 | 792 | 774 | 165.4 |
| A | 13 | 248 | 67908 | 406.0 | 792 | 774 | 165.4 |
| A | 15 | 223 | 55951 | 333.69 | 792 | 774 | 165.4 |
| B | 5 | 255 | 96135 | 604.92 | 798 | 773 | 157.6 |
| B | 0 | 219 | 77558 | 487.08 | 798 | 773 | 157.6 |
| B | 0 | 189 | 69986 | 439.04 | 798 | 773 | 157.6 |
| C | 14 | 254 | 71211 | 380.55 | 786 | 792 | 185.0 |
| C | 12 | 250 | 26270 | 137.69 | 786 | 792 | 185.0 |
| C | 0 | 207 | 20341 | 105.65 | 786 | 792 | 185.0 |
| D | 11 | 241 | 4375046 | 26477.29 | 658 | 641 | 165.2 |
| D | 3 | 13 | 1020401 | 6172.38 | 658 | 641 | 165.2 |
| D | 1 | 52 | 1018731 | 6162.27 | 658 | 641 | 165.2 |
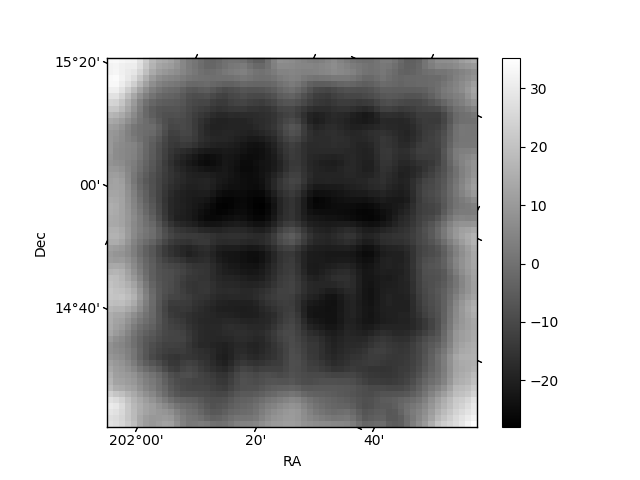
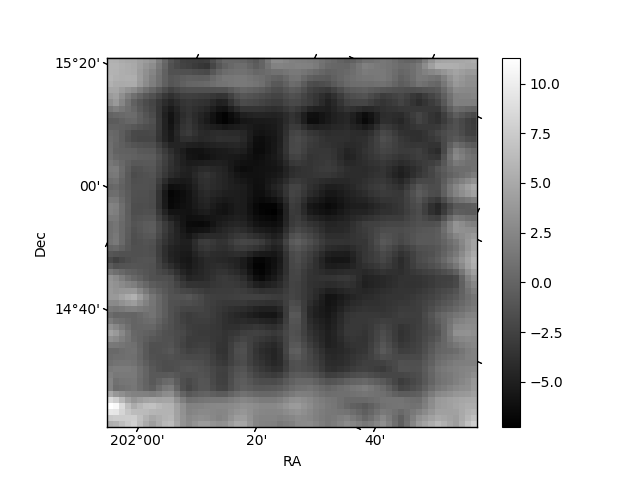
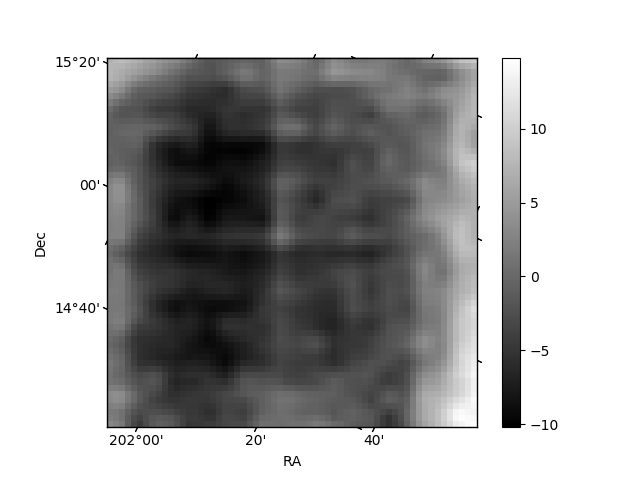
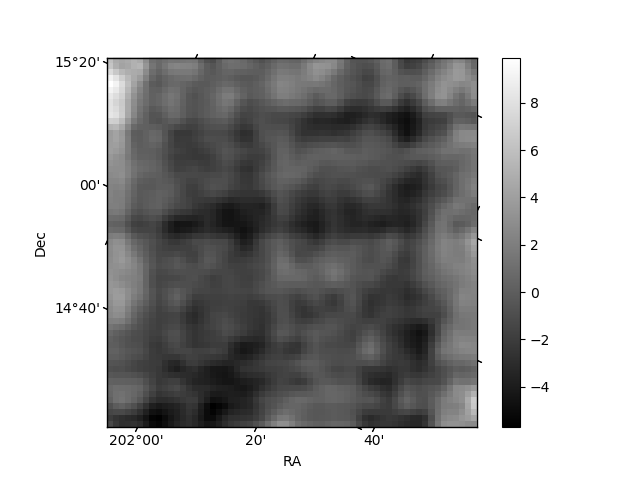
Histogram calculated using DETX and DETY for each event in the final _common_clean file
| Quadrant A | 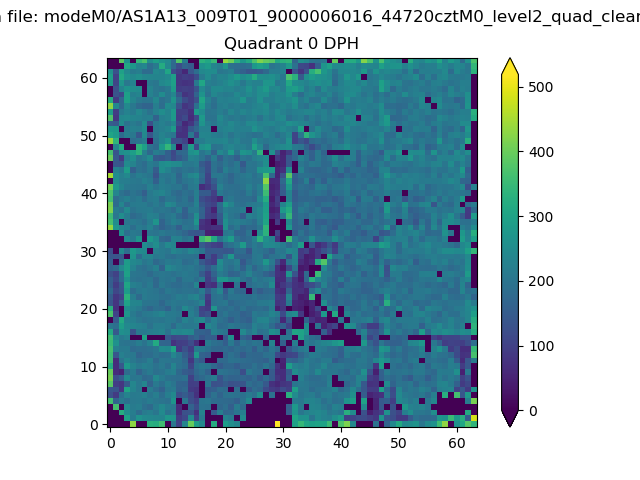 |
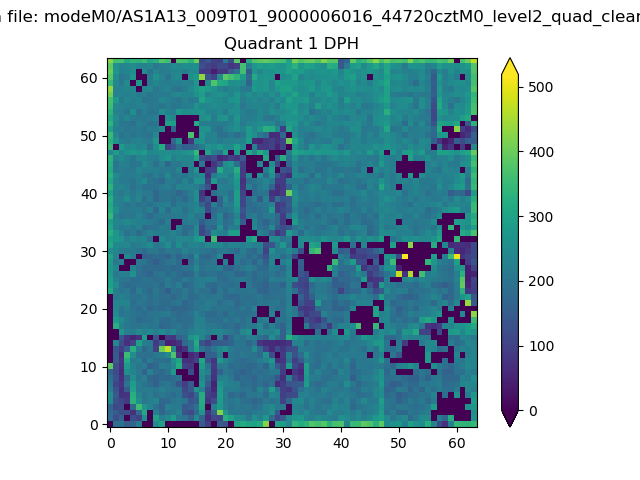 |
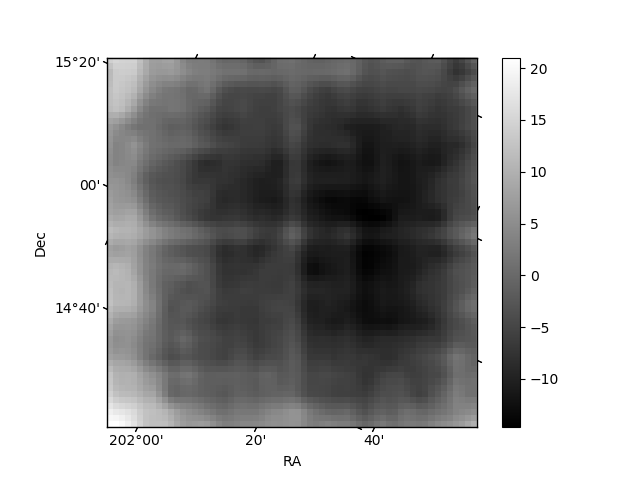
Quadrant B |
|---|---|---|---|
| Quadrant D | 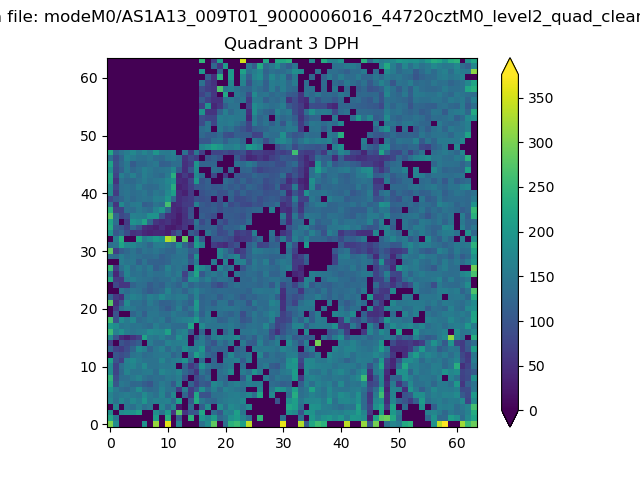 |
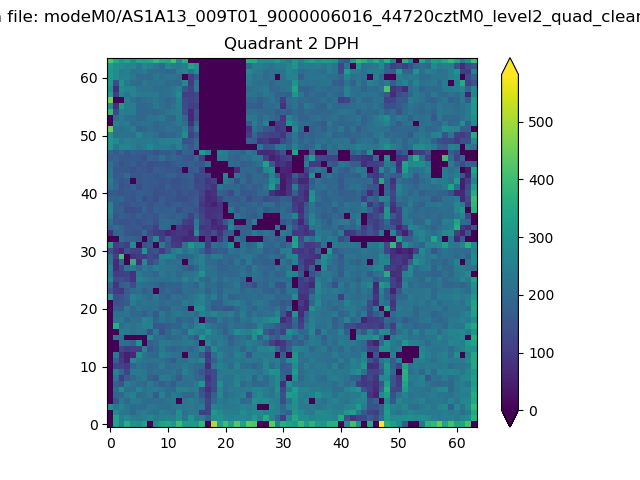 |
Quadrant C |
| Plot type | Count rate plots | Images |
|---|---|---|
| Comparison with Poisson distribution Blue bars denote a histogram of data divided into 1 sec bins. Red curve is a Poisson curve with rate = median count rate of data. |
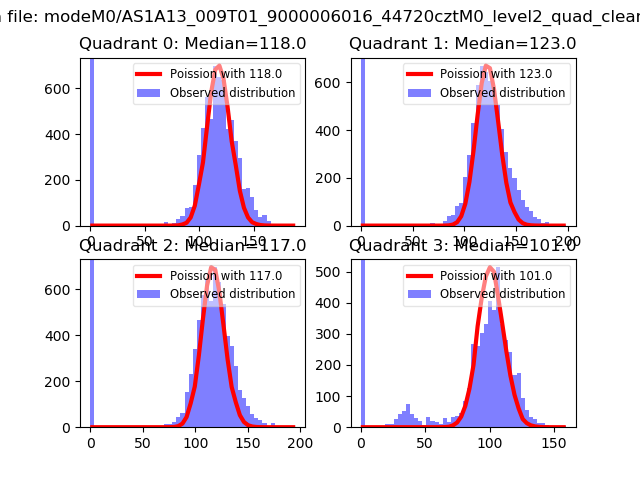 |
 |
| Quadrant-wise count rates Data is divided into 100 sec bins |
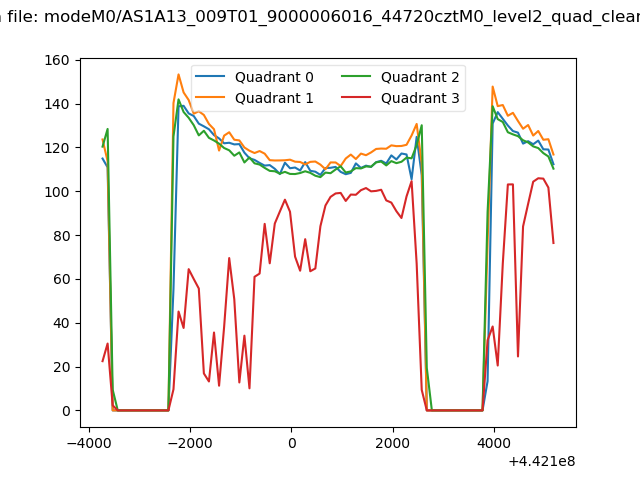 |
|
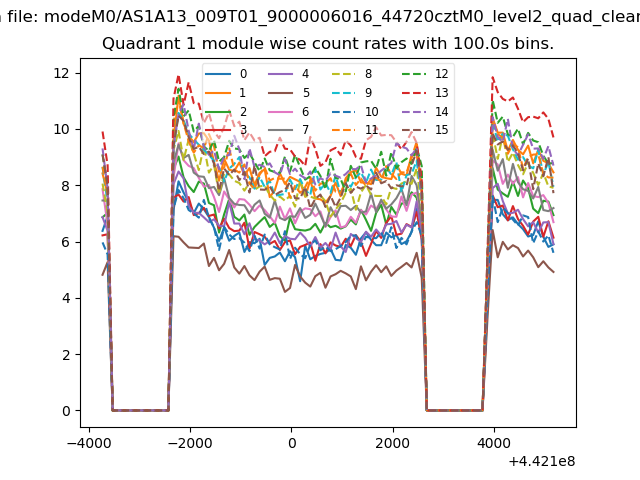
| Module-wise count rates for Quadrant A Data is divided into 100 sec bins |
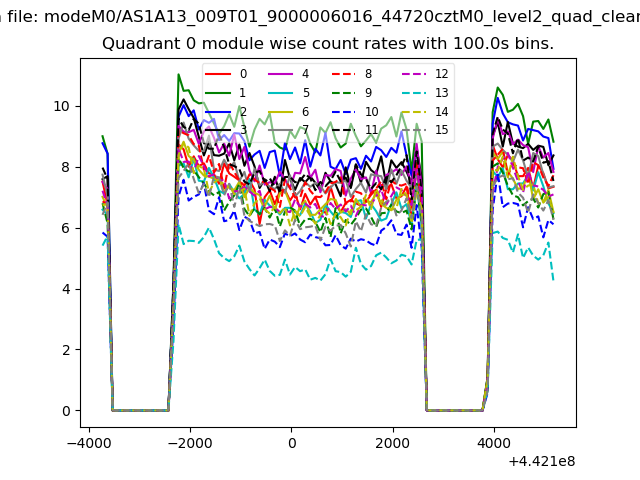 |
 |
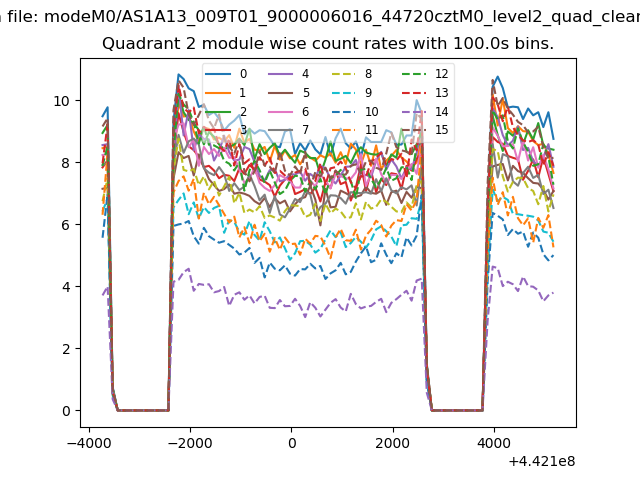
| Module-wise count rates for Quadrant B Data is divided into 100 sec bins |
 |
 |
| Module-wise count rates for Quadrant C Data is divided into 100 sec bins |
 |
 |
| Module-wise count rates for Quadrant D Data is divided into 100 sec bins |
 |
 |
| Parameter | Plot |
|---|---|
| CZT HV Monitor | 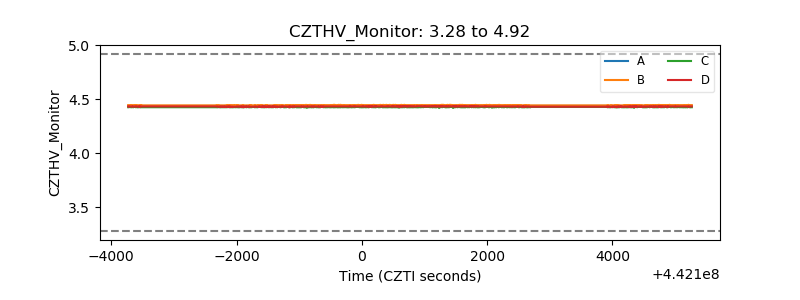 |
| D_VDD | 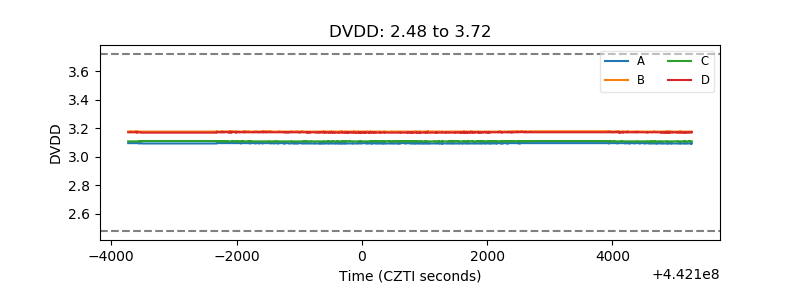 |
| Temperature 1 | 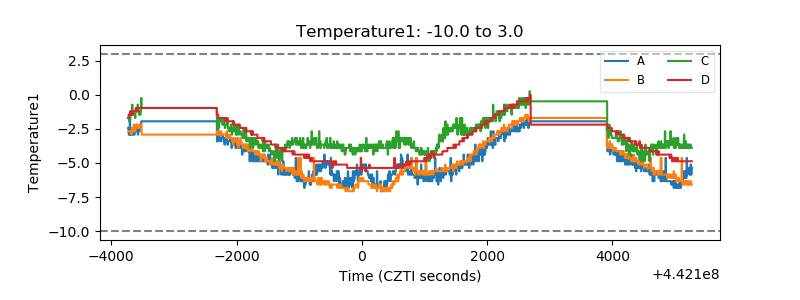 |
| Veto HV Monitor | 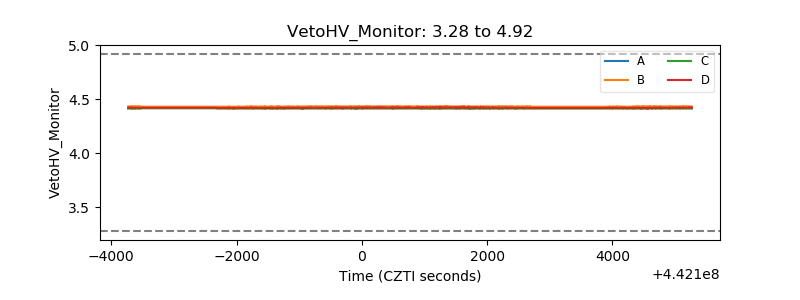 |
| Veto LLD | 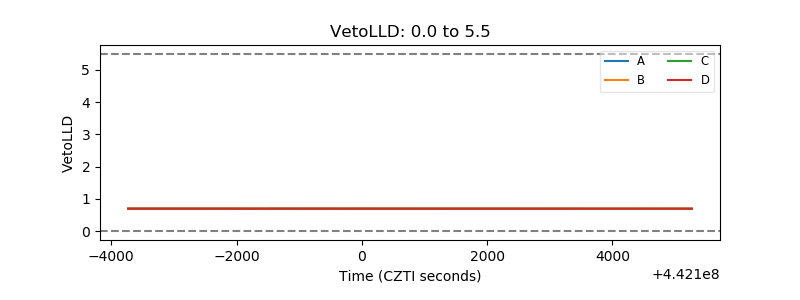 |
| Alpha Counter | 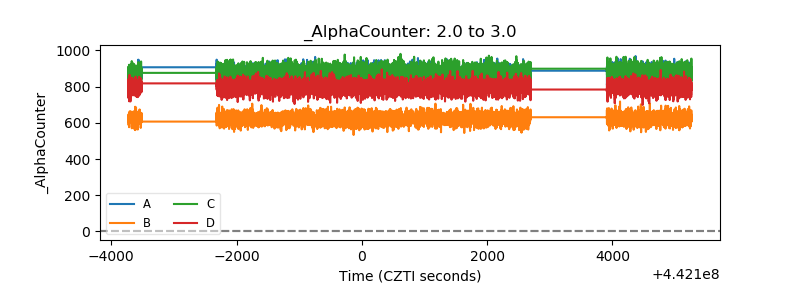 |
| _CPM_Rate | 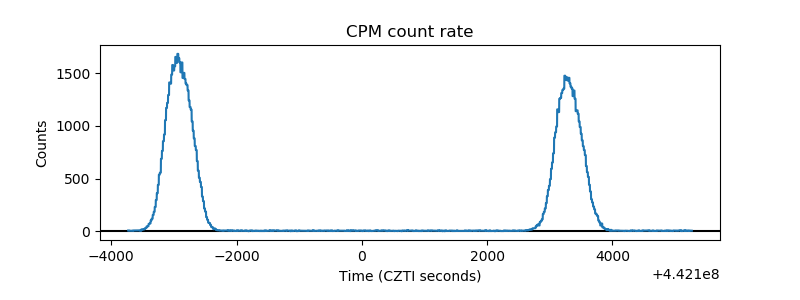 |
| CZT Counter | 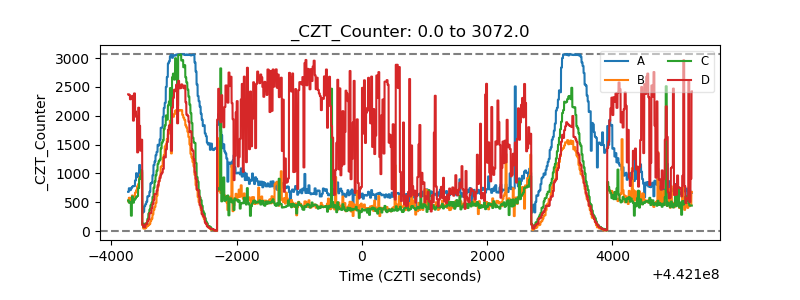 |
| +2.5 Volts monitor | 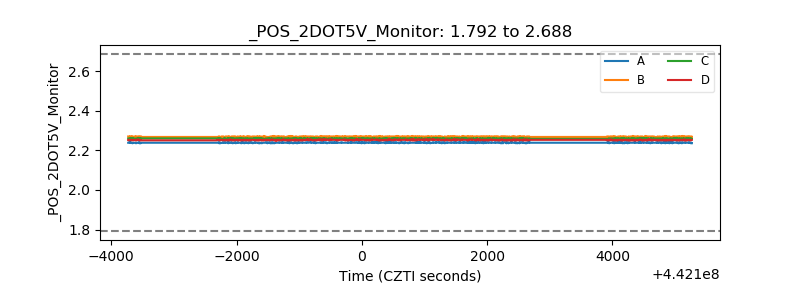 |
| +5 Volts monitor | 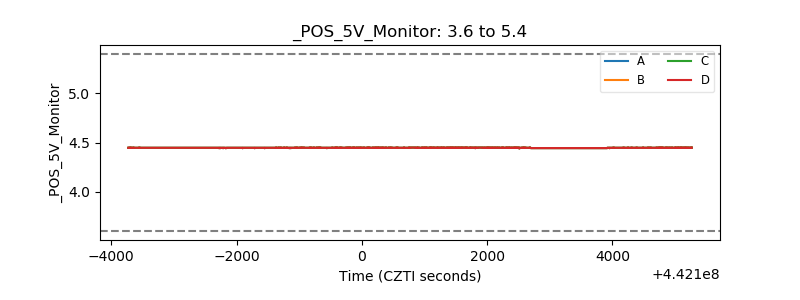 |
| _ROLL_ROT | 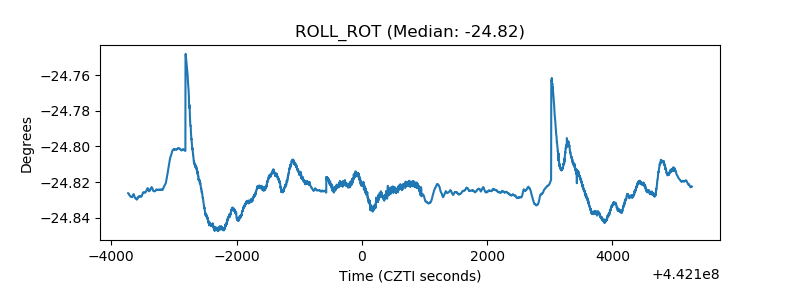 |
| _Roll_DEC | 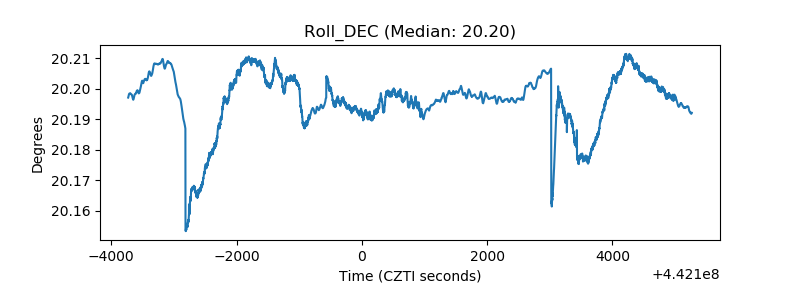 |
| _Roll_RA | 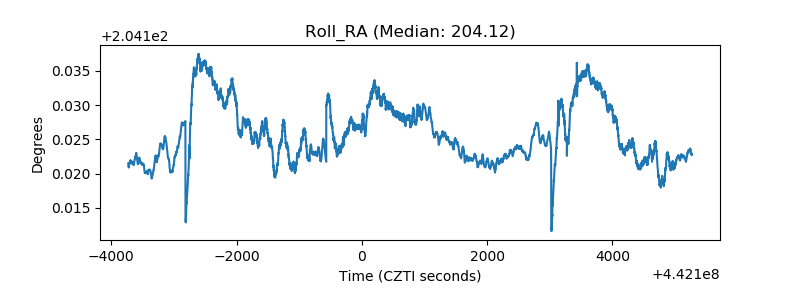 |
| Veto Counter | 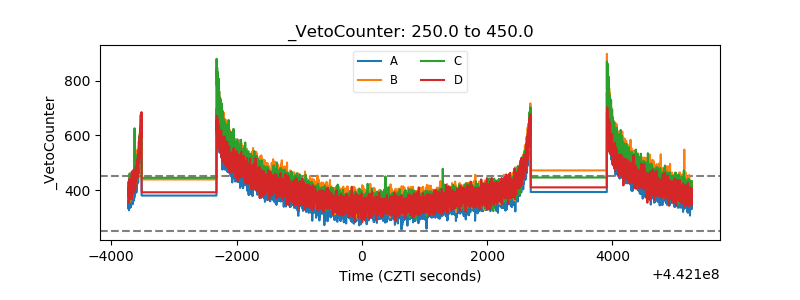 |