| Param | Original file | Final file |
|---|---|---|
| Filename | modeM0/AS1A13_009T01_9000006016_44722cztM0_level2.fits | modeM0/AS1A13_009T01_9000006016_44722cztM0_level2_quad_clean.evt |
| Size (bytes) | 642,648,960 | 108,987,840 |
| Size | 612.9 MB | 103.9 MB |
| Events in quadrant A | 7,188,024 | 693,292 |
| Events in quadrant B | 4,606,348 | 758,447 |
| Events in quadrant C | 3,082,730 | 763,074 |
| Events in quadrant D | 8,380,460 | 606,984 |
| Mode M9 | |||
|---|---|---|---|
| Quadrant | BADHDUFLAG | Total packets | Discarded packets |
| A | 0 | 17 | 0 |
| B | 0 | 18 | 0 |
| C | 0 | 18 | 0 |
| D | 0 | 18 | 0 |
| Mode SS | |||
|---|---|---|---|
| Quadrant | BADHDUFLAG | Total packets | Discarded packets |
| A | 0 | 140 | 0 |
| B | 0 | 140 | 0 |
| C | 0 | 140 | 0 |
| D | 0 | 140 | 0 |
| Mode M0 | |||
|---|---|---|---|
| Quadrant | BADHDUFLAG | Total packets | Discarded packets |
| A | 0 | 26705 | 2 |
| B | 0 | 18499 | 2 |
| C | 0 | 14210 | 2 |
| D | 0 | 29708 | 2 |
| Quadrant | Total seconds | Saturated seconds | Saturation percentage |
|---|---|---|---|
| A | 6861 | 891 | 12.986445% |
| B | 6861 | 492 | 7.170966% |
| C | 6861 | 29 | 0.422679% |
| D | 6861 | 1075 | 15.668270% |
Noise dominated data is calculated using 1-second bins in cleaned event files. If a bin has >2000 counts, and if more than 50% of those come from <1% of pixels, then it is considered to be noise-dominated and hence unusable.
| Quadrant | # 1 sec bins | Bins with >0 counts | Bins with >2000 counts | High rate bins dominated by noise | Noise dominated (total time) | Noise dominated (detector-on time) | Marked lightcurve |
|---|---|---|---|---|---|---|---|
| A | 7896 | 6862 | 481 | 481 | 6.09% | 7.01% | 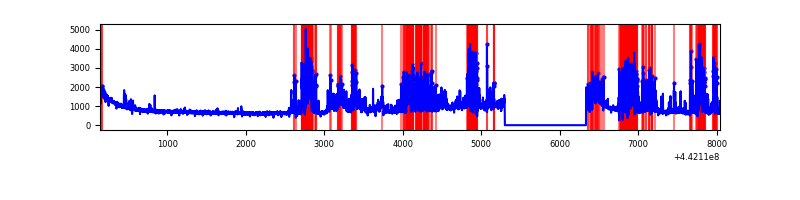 |
| B | 7896 | 6862 | 338 | 338 | 4.28% | 4.93% | 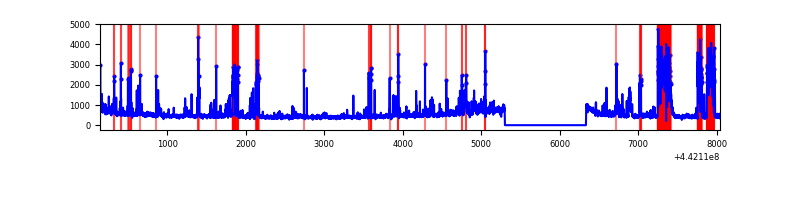 |
| C | 7896 | 6862 | 2 | 2 | 0.03% | 0.03% | 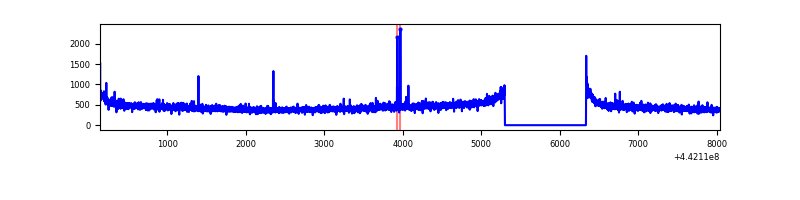 |
| D | 7896 | 6862 | 854 | 854 | 10.82% | 12.45% | 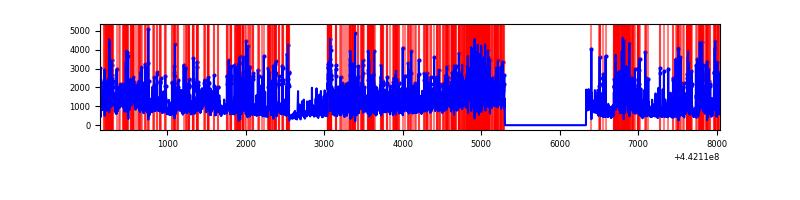 |
Top three noisy pixels from each quadrant. If the there are fewer than three noisy pixels in the level2.evt file, extra rows are filled as -1
| Pixel properties | Quadrant properties | ||||||
|---|---|---|---|---|---|---|---|
| Quadrant | DetID | PixID | Counts | Sigma | Mean | Median | Sigma |
| A | 10 | 83 | 2110125 | 13464.49 | 752 | 737 | 156.7 |
| A | 15 | 223 | 1923779 | 12275.02 | 752 | 737 | 156.7 |
| A | 13 | 248 | 209800 | 1334.48 | 752 | 737 | 156.7 |
| B | 0 | 189 | 1106699 | 7241.92 | 769 | 744 | 152.7 |
| B | 5 | 255 | 198816 | 1297.0 | 769 | 744 | 152.7 |
| B | 4 | 171 | 89970 | 584.26 | 769 | 744 | 152.7 |
| C | 0 | 207 | 23470 | 123.9 | 775 | 782 | 183.1 |
| C | 3 | 233 | 10733 | 54.34 | 775 | 782 | 183.1 |
| C | 14 | 254 | 10198 | 51.42 | 775 | 782 | 183.1 |
| D | 13 | 174 | 2127209 | 11687.52 | 718 | 700 | 181.9 |
| D | 13 | 249 | 1368292 | 7516.43 | 718 | 700 | 181.9 |
| D | 1 | 52 | 961848 | 5282.57 | 718 | 700 | 181.9 |
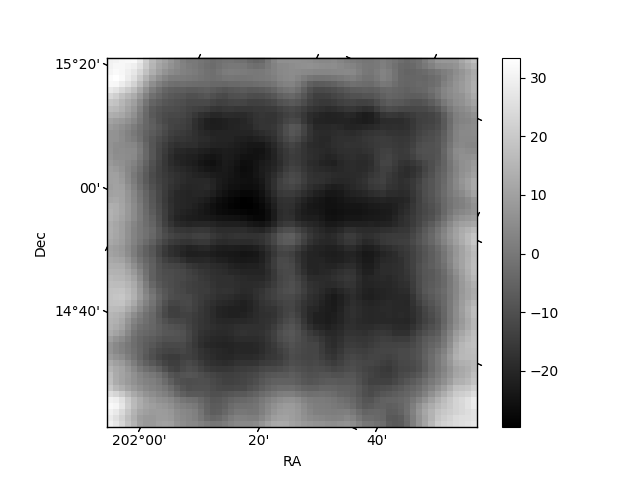
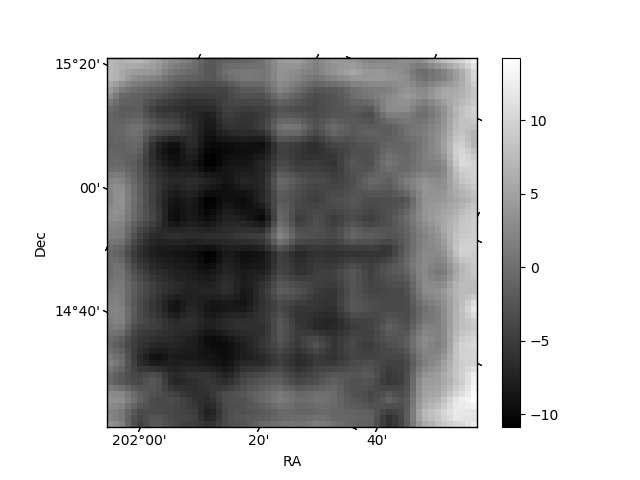
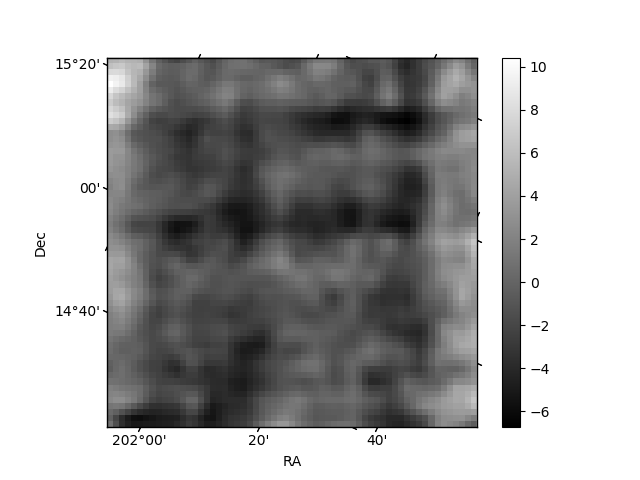
Histogram calculated using DETX and DETY for each event in the final _common_clean file
| Quadrant A | 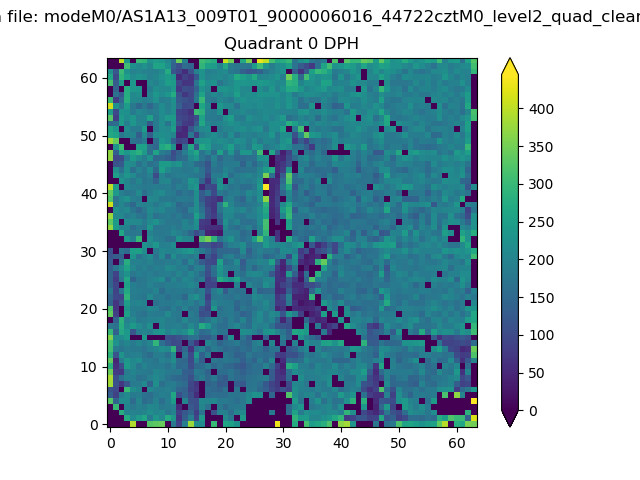 |
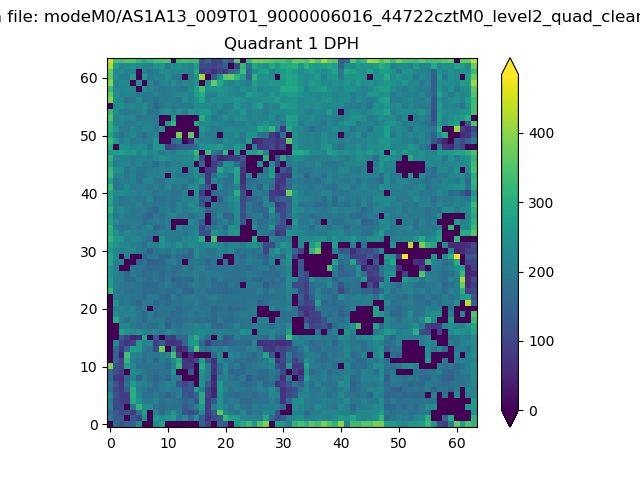 |
Quadrant B |
|---|---|---|---|
| Quadrant D | 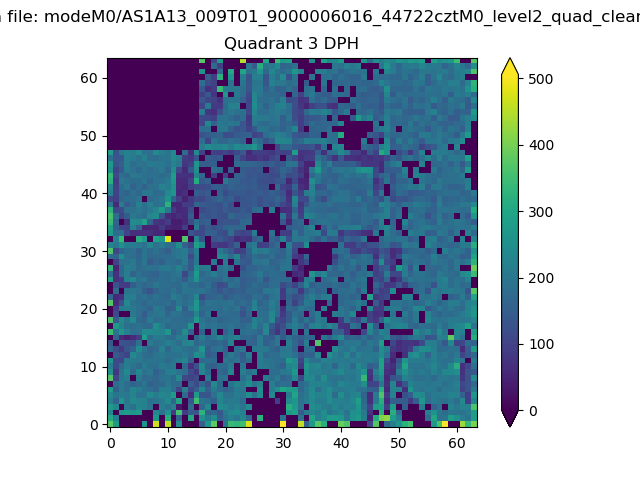 |
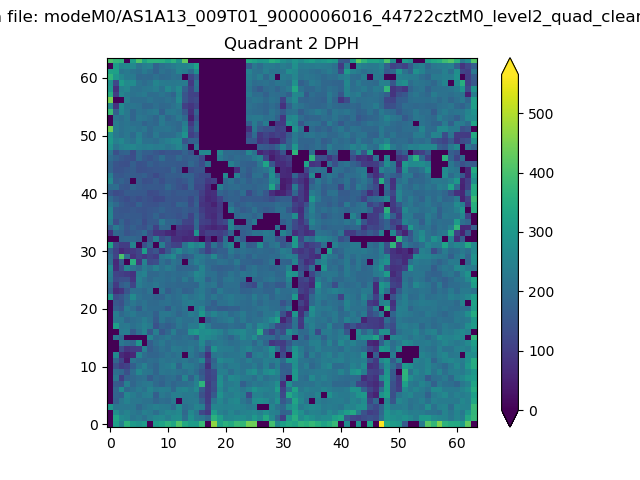 |
Quadrant C |
| Plot type | Count rate plots | Images |
|---|---|---|
| Comparison with Poisson distribution Blue bars denote a histogram of data divided into 1 sec bins. Red curve is a Poisson curve with rate = median count rate of data. |
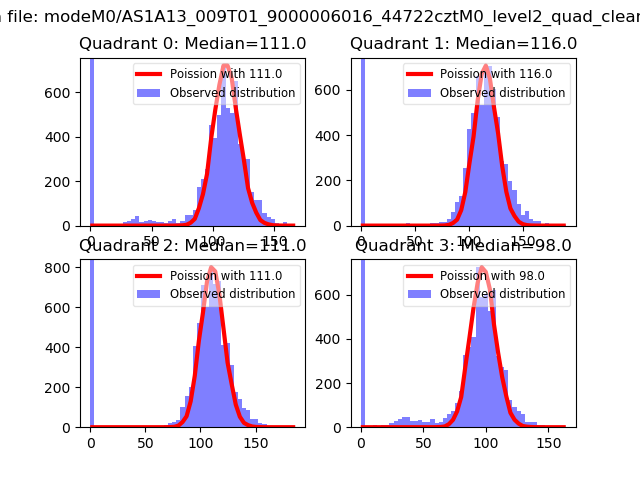 |
 |
| Quadrant-wise count rates Data is divided into 100 sec bins |
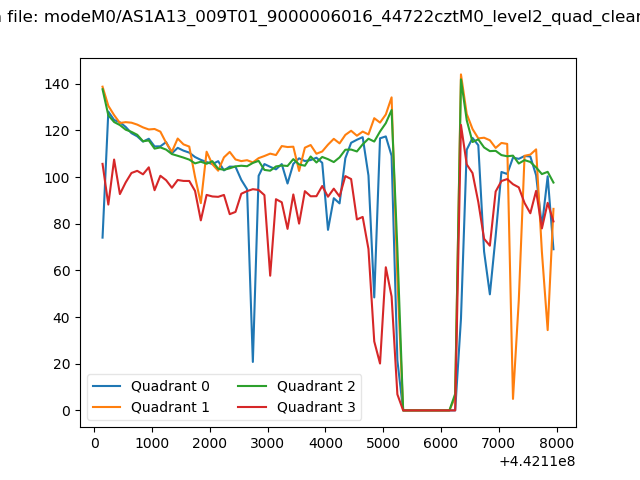 |
|
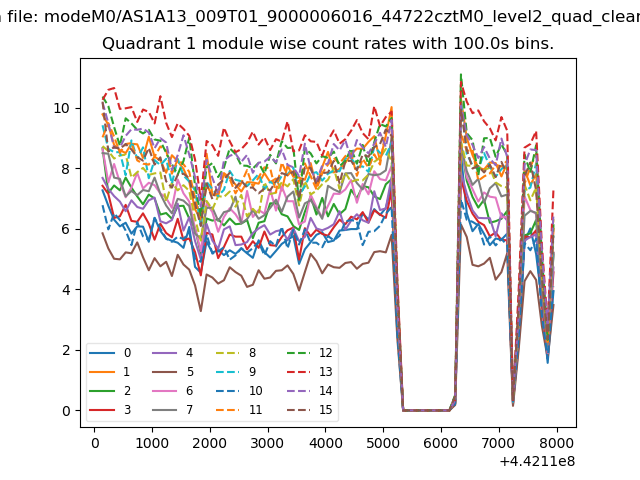
| Module-wise count rates for Quadrant A Data is divided into 100 sec bins |
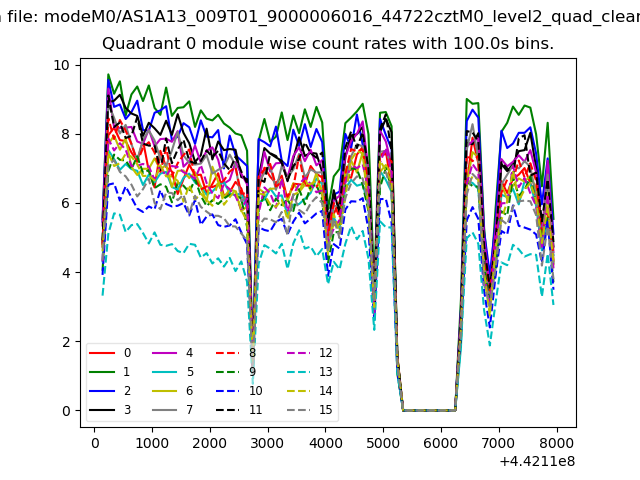 |
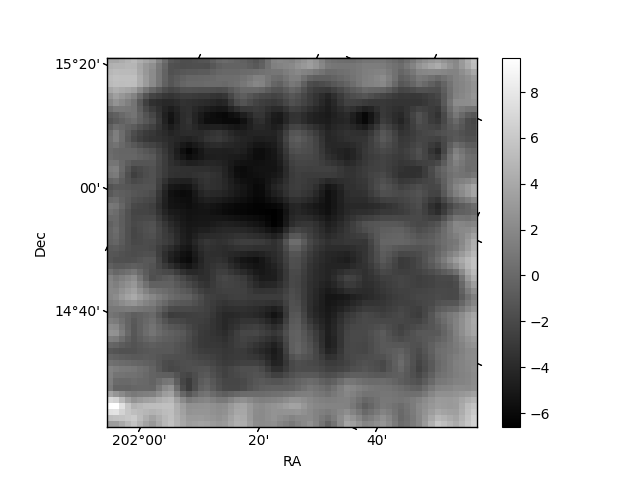 |
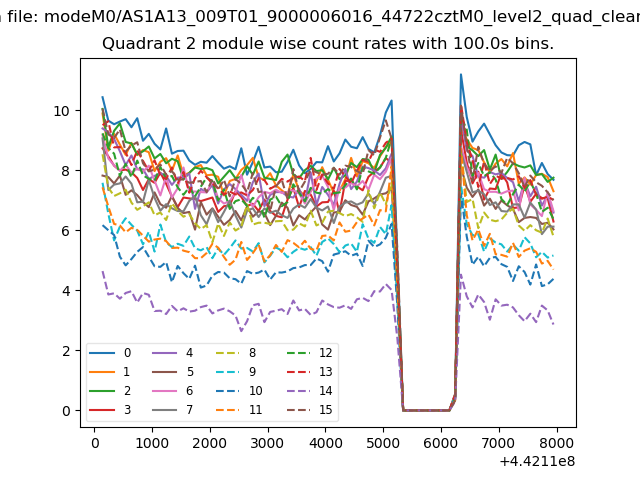
| Module-wise count rates for Quadrant B Data is divided into 100 sec bins |
 |
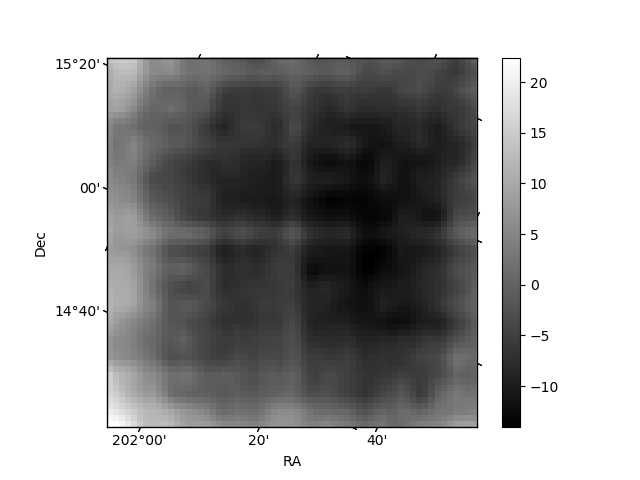 |
| Module-wise count rates for Quadrant C Data is divided into 100 sec bins |
 |
 |
| Module-wise count rates for Quadrant D Data is divided into 100 sec bins |
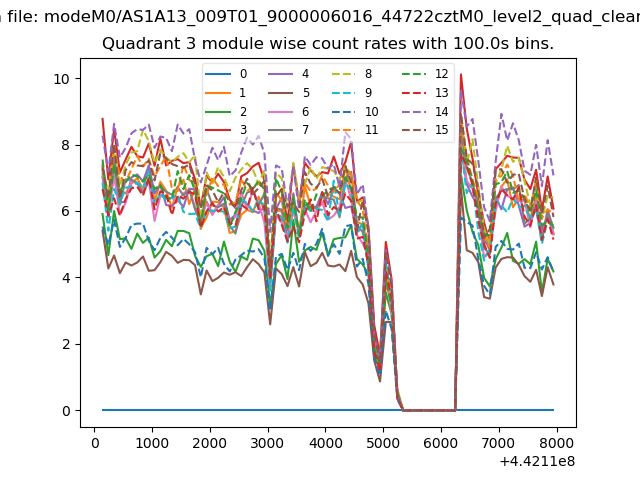 |
 |
| Parameter | Plot |
|---|---|
| CZT HV Monitor | 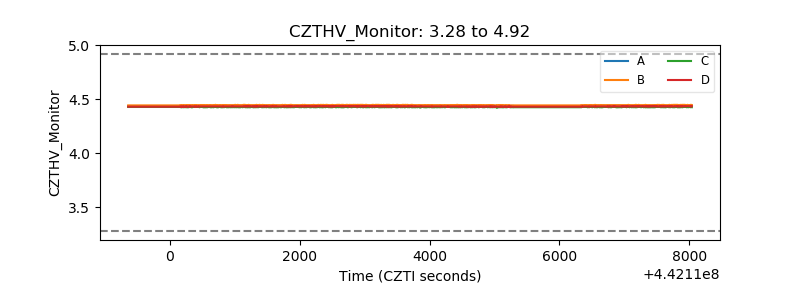 |
| D_VDD | 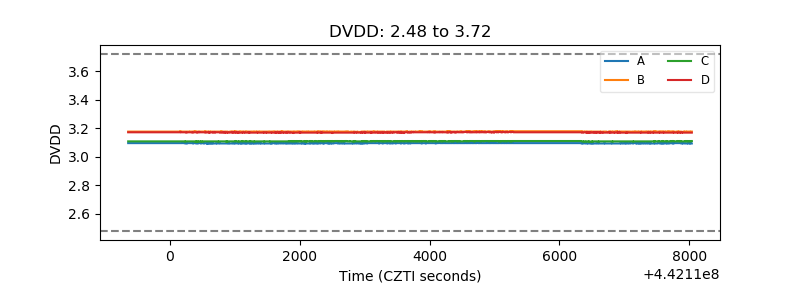 |
| Temperature 1 | 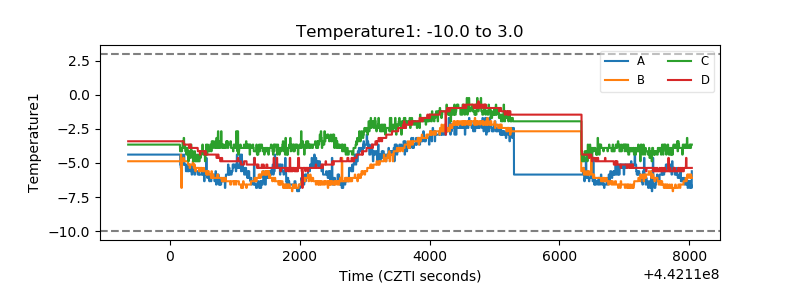 |
| Veto HV Monitor | 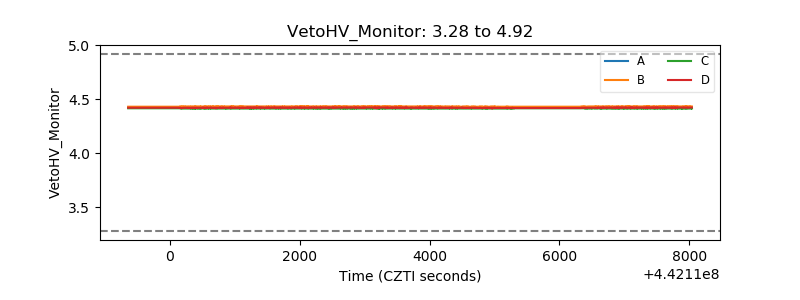 |
| Veto LLD | 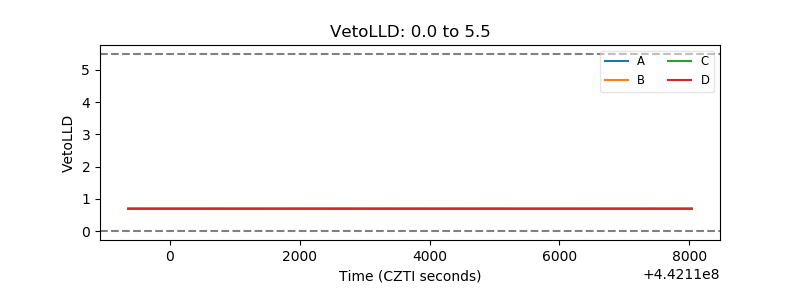 |
| Alpha Counter | 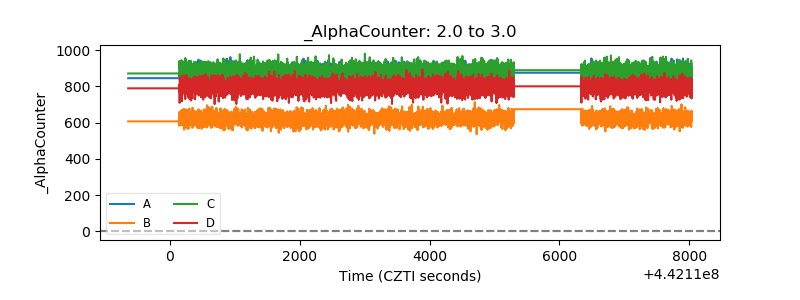 |
| _CPM_Rate | 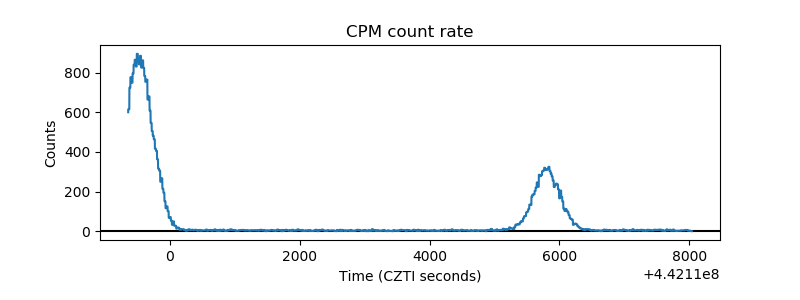 |
| CZT Counter | 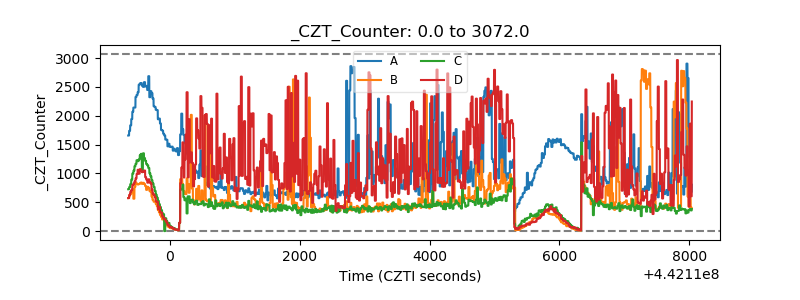 |
| +2.5 Volts monitor | 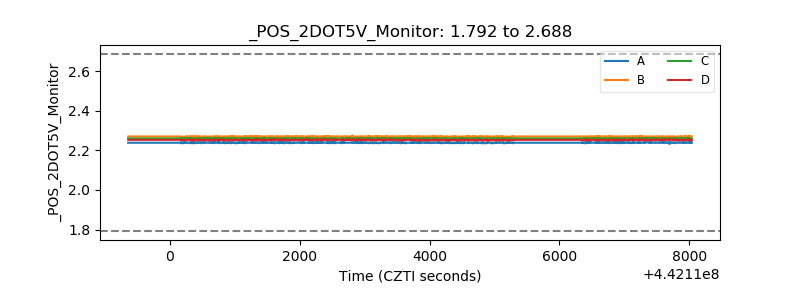 |
| +5 Volts monitor | 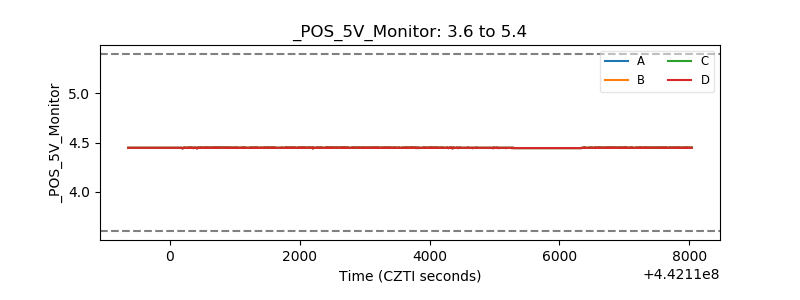 |
| _ROLL_ROT | 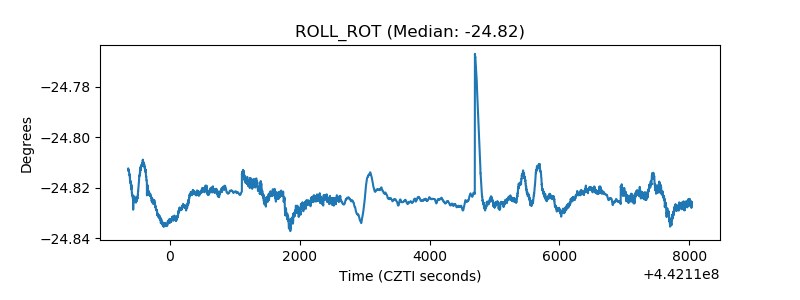 |
| _Roll_DEC | 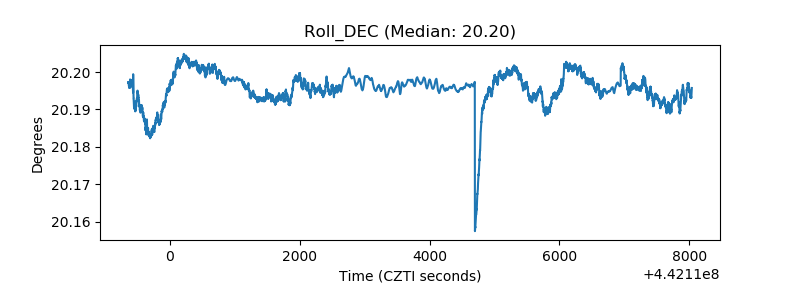 |
| _Roll_RA | 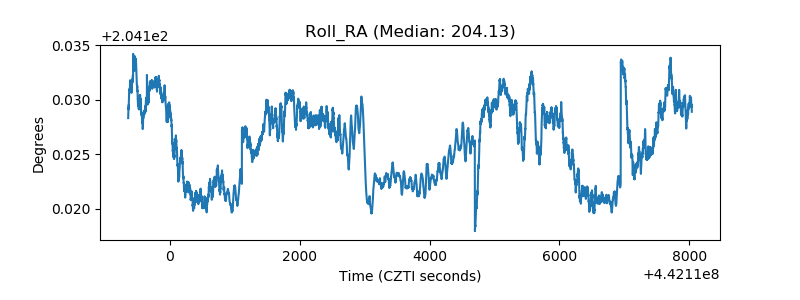 |
| Veto Counter | 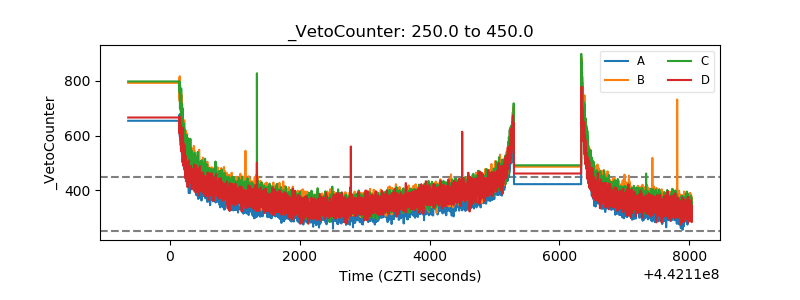 |