| Param | Original file | Final file |
|---|---|---|
| Filename | modeM0/AS1A13_009T01_9000006016_44723cztM0_level2.fits | modeM0/AS1A13_009T01_9000006016_44723cztM0_level2_quad_clean.evt |
| Size (bytes) | 693,023,040 | 111,000,960 |
| Size | 660.9 MB | 105.9 MB |
| Events in quadrant A | 7,707,498 | 706,754 |
| Events in quadrant B | 4,621,439 | 775,912 |
| Events in quadrant C | 3,233,894 | 779,520 |
| Events in quadrant D | 9,529,538 | 593,654 |
| Mode M9 | |||
|---|---|---|---|
| Quadrant | BADHDUFLAG | Total packets | Discarded packets |
| A | 0 | 7 | 0 |
| B | 0 | 7 | 0 |
| C | 0 | 8 | 0 |
| D | 0 | 8 | 0 |
| Mode SS | |||
|---|---|---|---|
| Quadrant | BADHDUFLAG | Total packets | Discarded packets |
| A | 0 | 148 | 0 |
| B | 0 | 148 | 0 |
| C | 0 | 148 | 0 |
| D | 0 | 148 | 0 |
| Mode M0 | |||
|---|---|---|---|
| Quadrant | BADHDUFLAG | Total packets | Discarded packets |
| A | 0 | 28365 | 3 |
| B | 0 | 18766 | 2 |
| C | 0 | 15082 | 2 |
| D | 0 | 33399 | 2 |
| Quadrant | Total seconds | Saturated seconds | Saturation percentage |
|---|---|---|---|
| A | 7248 | 977 | 13.479581% |
| B | 7248 | 475 | 6.553532% |
| C | 7248 | 35 | 0.482892% |
| D | 7248 | 1462 | 20.171082% |
Noise dominated data is calculated using 1-second bins in cleaned event files. If a bin has >2000 counts, and if more than 50% of those come from <1% of pixels, then it is considered to be noise-dominated and hence unusable.
| Quadrant | # 1 sec bins | Bins with >0 counts | Bins with >2000 counts | High rate bins dominated by noise | Noise dominated (total time) | Noise dominated (detector-on time) | Marked lightcurve |
|---|---|---|---|---|---|---|---|
| A | 7993 | 7249 | 574 | 574 | 7.18% | 7.92% | 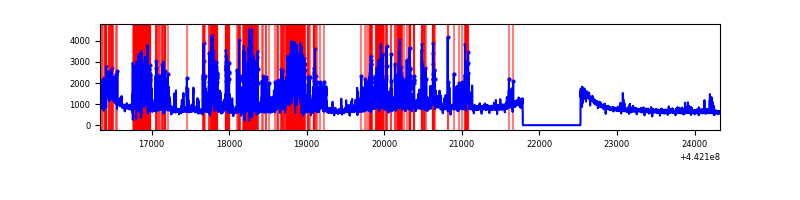 |
| B | 7993 | 7249 | 304 | 304 | 3.80% | 4.19% | 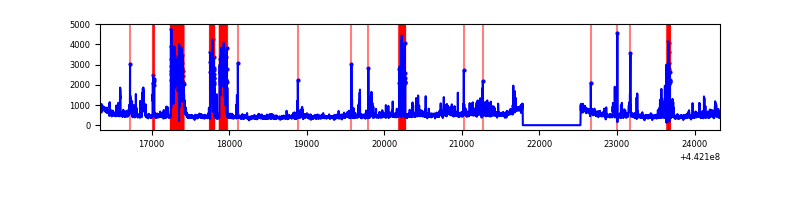 |
| C | 7993 | 7249 | 2 | 2 | 0.03% | 0.03% | 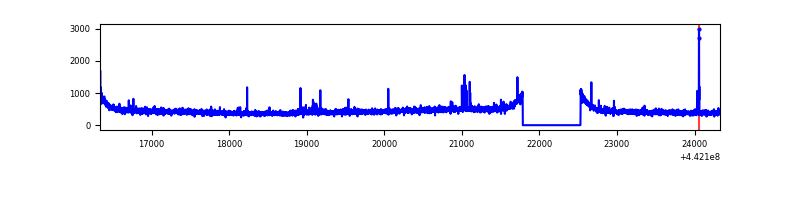 |
| D | 7993 | 7249 | 1207 | 1207 | 15.10% | 16.65% | 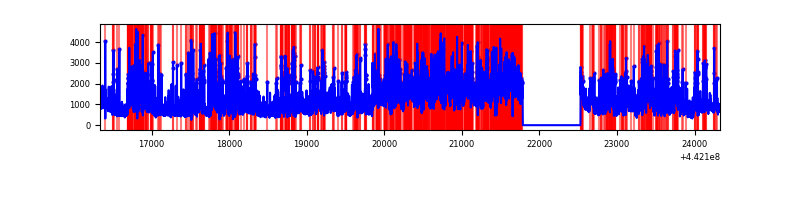 |
Top three noisy pixels from each quadrant. If the there are fewer than three noisy pixels in the level2.evt file, extra rows are filled as -1
| Pixel properties | Quadrant properties | ||||||
|---|---|---|---|---|---|---|---|
| Quadrant | DetID | PixID | Counts | Sigma | Mean | Median | Sigma |
| A | 15 | 223 | 2499512 | 15272.96 | 786 | 769 | 163.6 |
| A | 10 | 83 | 2124102 | 12978.36 | 786 | 769 | 163.6 |
| A | 7 | 3 | 19493 | 114.45 | 786 | 769 | 163.6 |
| B | 0 | 189 | 1011475 | 6287.63 | 804 | 776 | 160.7 |
| B | 4 | 171 | 254093 | 1575.9 | 804 | 776 | 160.7 |
| B | 5 | 255 | 99200 | 612.3 | 804 | 776 | 160.7 |
| C | 1 | 3 | 18196 | 90.12 | 812 | 818 | 192.8 |
| C | 2 | 14 | 16063 | 79.06 | 812 | 818 | 192.8 |
| C | 0 | 207 | 14962 | 73.35 | 812 | 818 | 192.8 |
| D | 13 | 174 | 3025104 | 16081.26 | 742 | 720 | 188.1 |
| D | 13 | 249 | 1474210 | 7834.84 | 742 | 720 | 188.1 |
| D | 1 | 52 | 1269596 | 6746.87 | 742 | 720 | 188.1 |
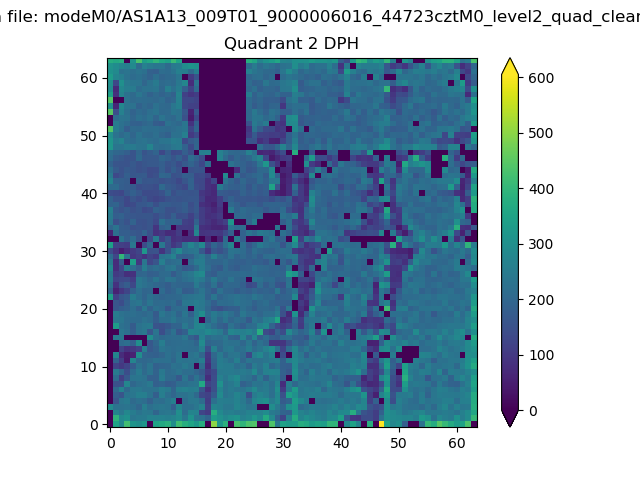
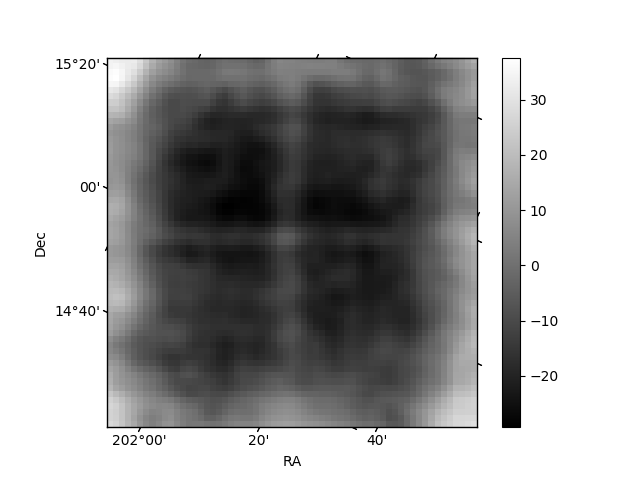
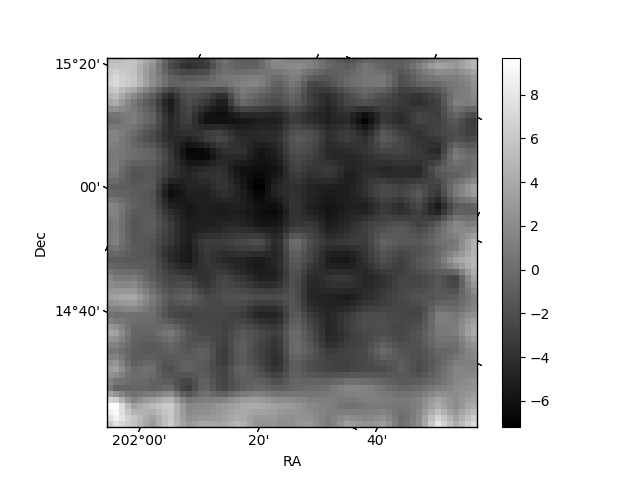
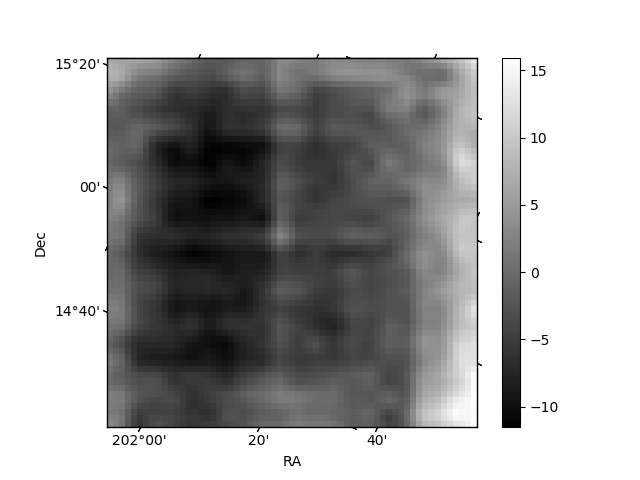
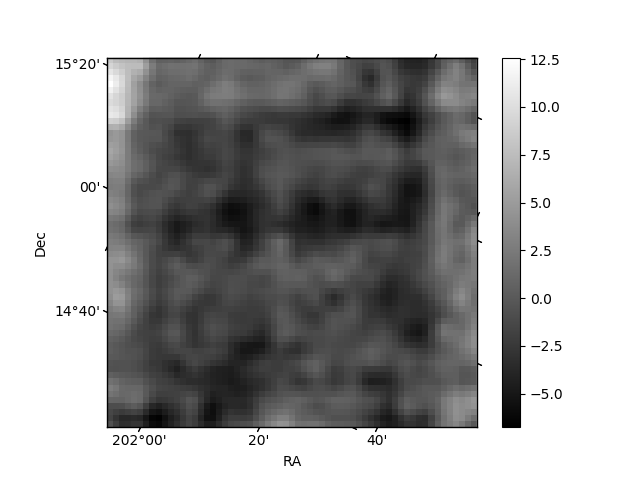
Histogram calculated using DETX and DETY for each event in the final _common_clean file
| Quadrant A | 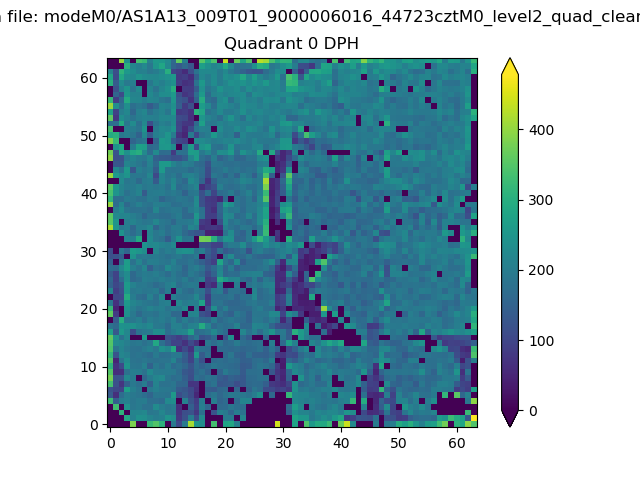 |
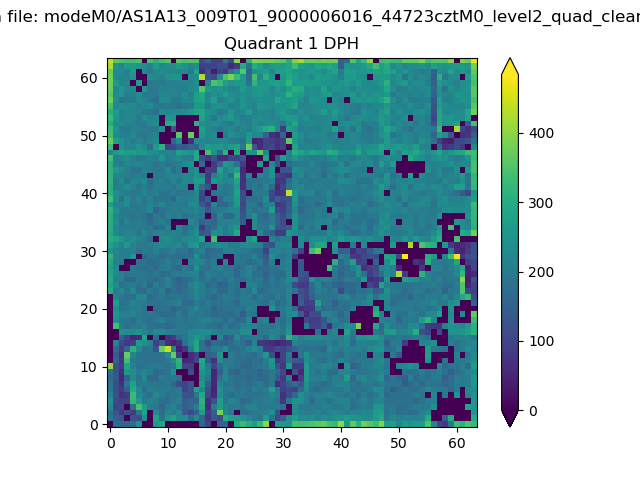 |
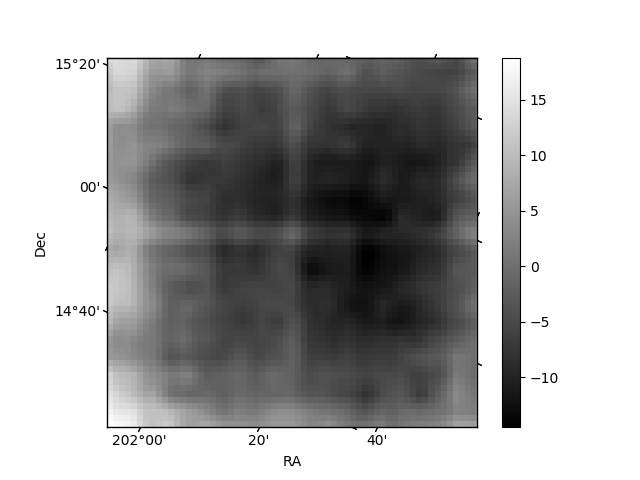
Quadrant B |
|---|---|---|---|
| Quadrant D | 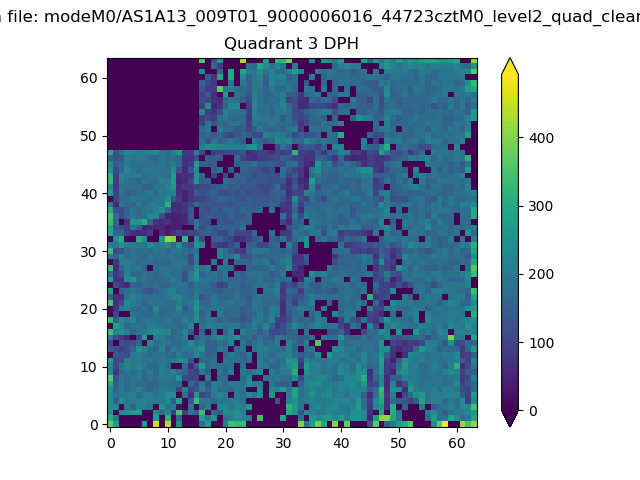 |
 |
Quadrant C |
| Plot type | Count rate plots | Images |
|---|---|---|
| Comparison with Poisson distribution Blue bars denote a histogram of data divided into 1 sec bins. Red curve is a Poisson curve with rate = median count rate of data. |
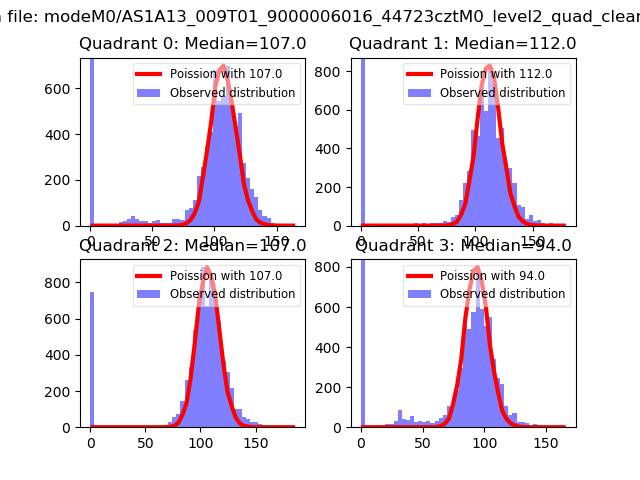 |
 |
| Quadrant-wise count rates Data is divided into 100 sec bins |
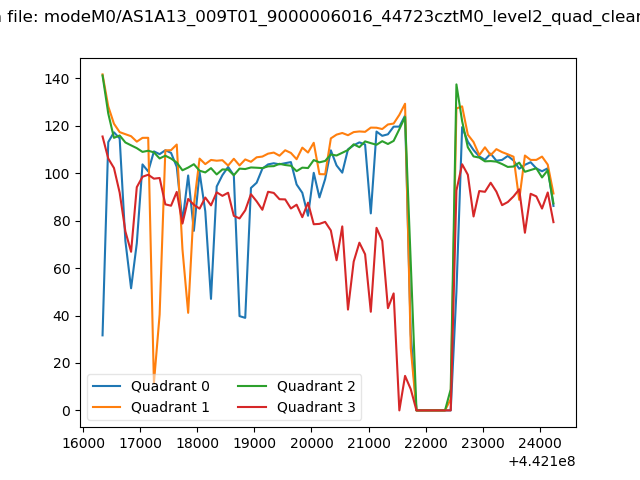 |
|
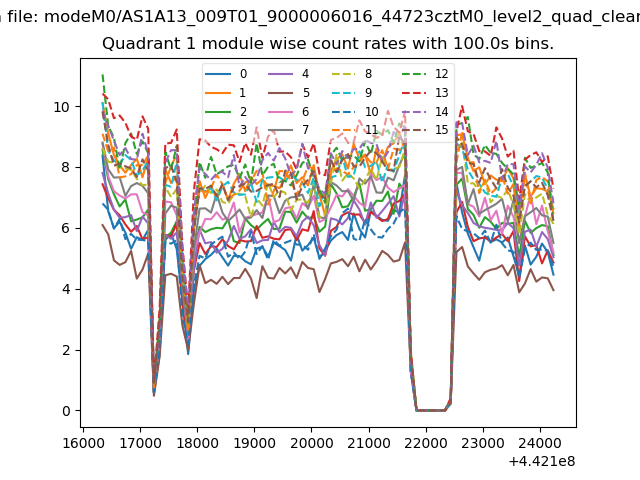
| Module-wise count rates for Quadrant A Data is divided into 100 sec bins |
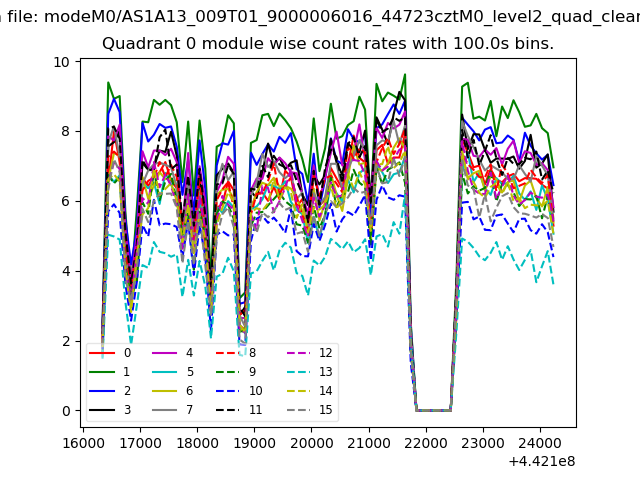 |
 |
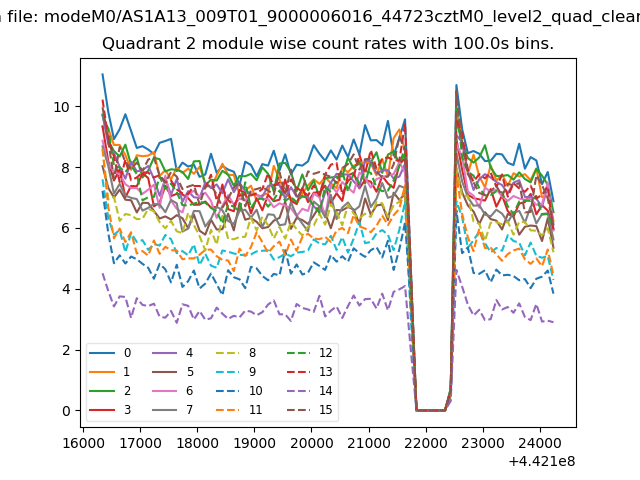
| Module-wise count rates for Quadrant B Data is divided into 100 sec bins |
 |
 |
| Module-wise count rates for Quadrant C Data is divided into 100 sec bins |
 |
 |
| Module-wise count rates for Quadrant D Data is divided into 100 sec bins |
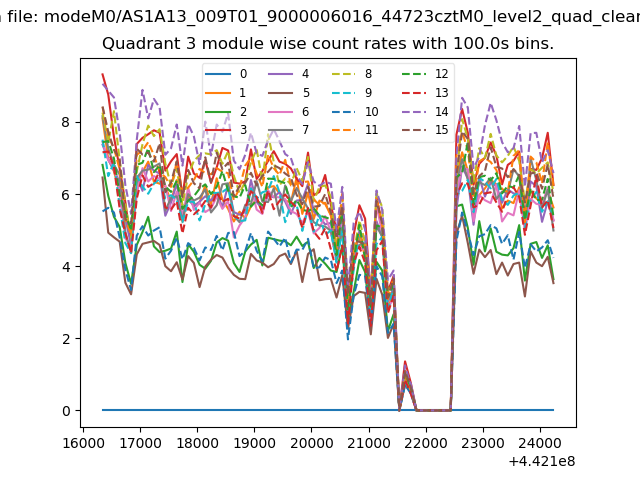 |
 |
| Parameter | Plot |
|---|---|
| CZT HV Monitor | 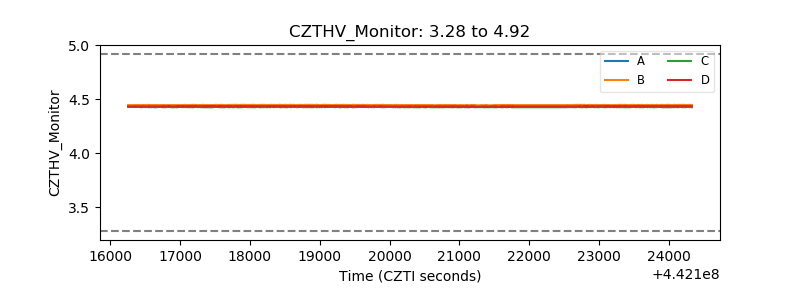 |
| D_VDD | 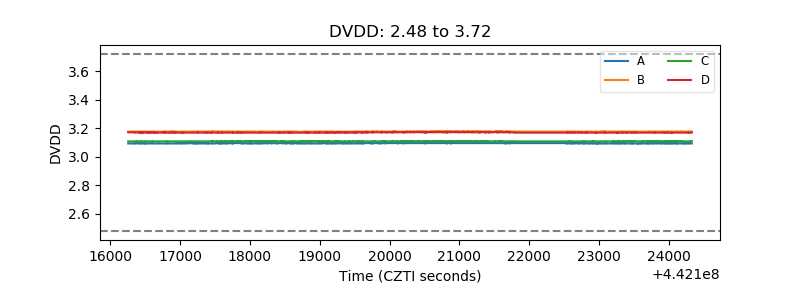 |
| Temperature 1 | 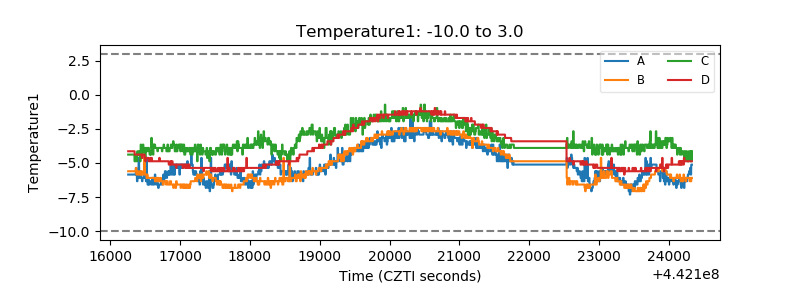 |
| Veto HV Monitor | 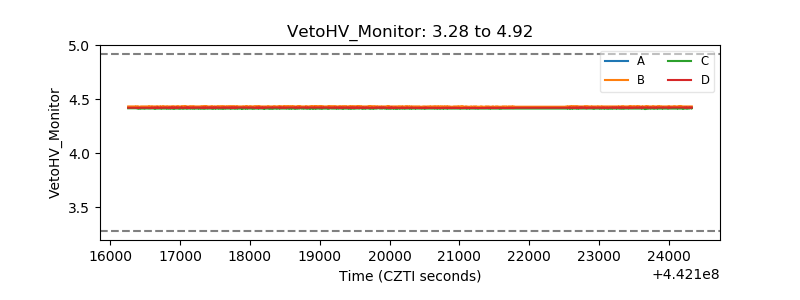 |
| Veto LLD | 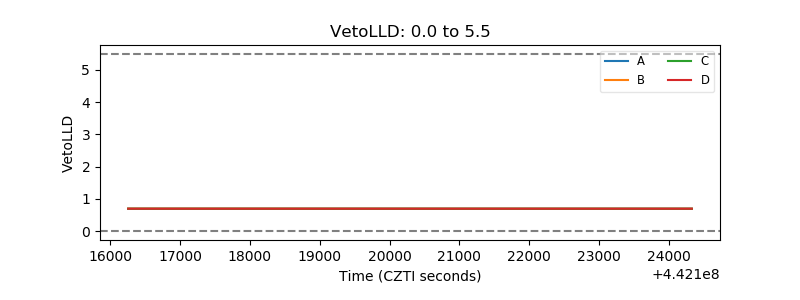 |
| Alpha Counter | 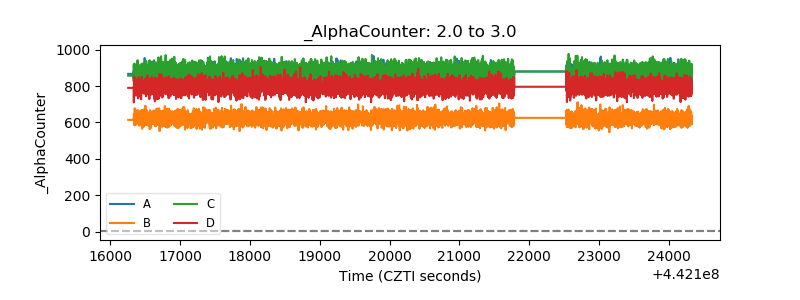 |
| _CPM_Rate | 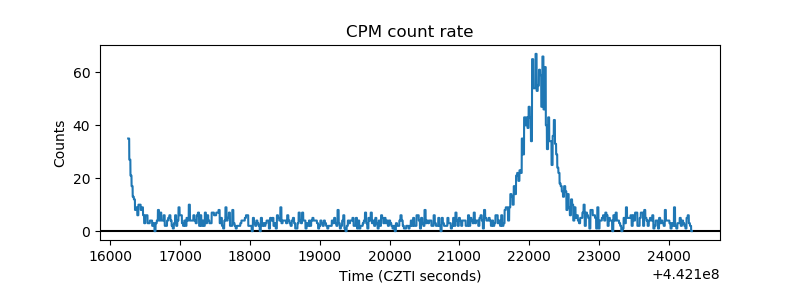 |
| CZT Counter | 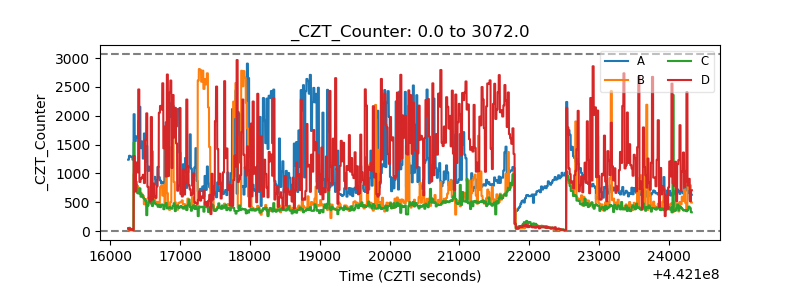 |
| +2.5 Volts monitor | 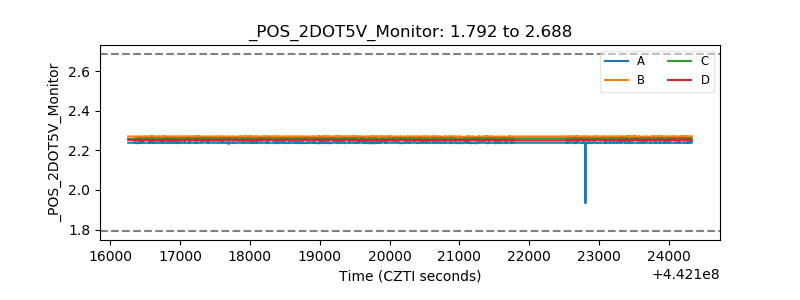 |
| +5 Volts monitor | 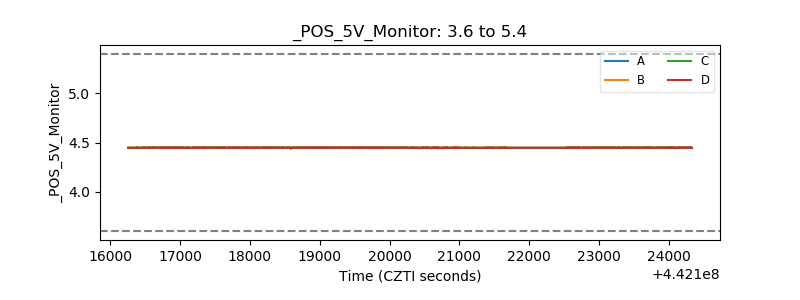 |
| _ROLL_ROT | 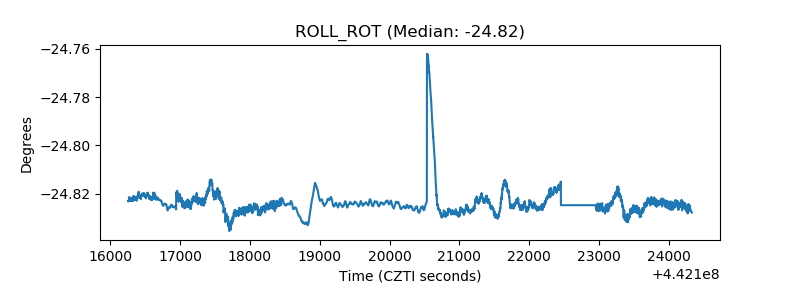 |
| _Roll_DEC | 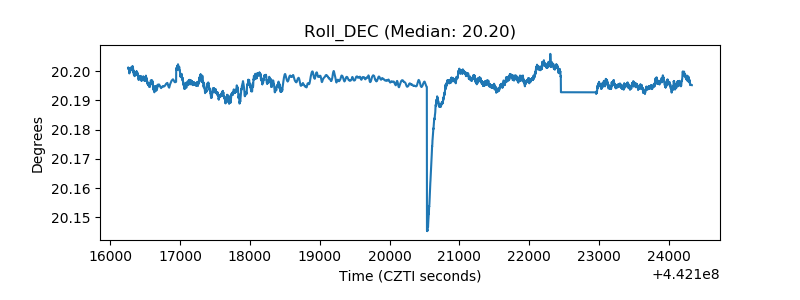 |
| _Roll_RA | 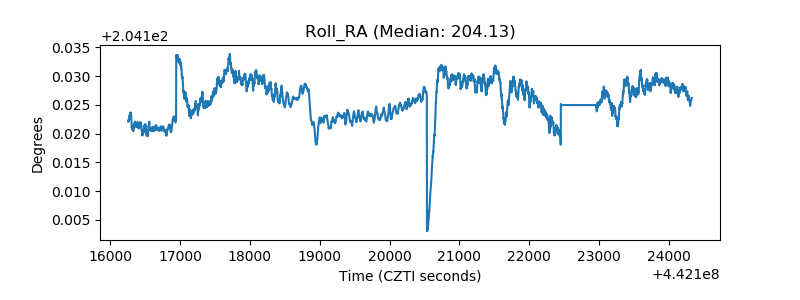 |
| Veto Counter | 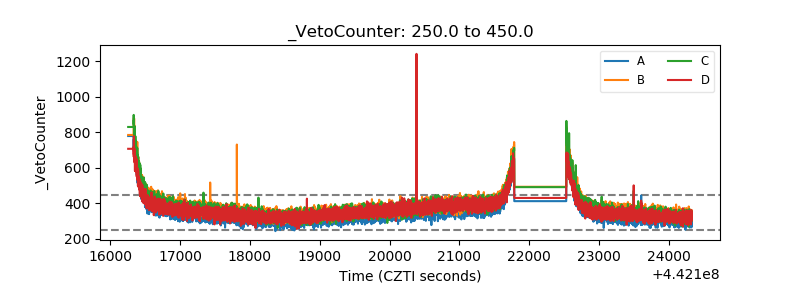 |