| Param | Original file | Final file |
|---|---|---|
| Filename | modeM0/AS1A13_009T01_9000006016_44725cztM0_level2.fits | modeM0/AS1A13_009T01_9000006016_44725cztM0_level2_quad_clean.evt |
| Size (bytes) | 635,601,600 | 110,148,480 |
| Size | 606.2 MB | 105.0 MB |
| Events in quadrant A | 7,918,503 | 696,692 |
| Events in quadrant B | 3,835,370 | 784,376 |
| Events in quadrant C | 3,157,618 | 752,829 |
| Events in quadrant D | 8,054,622 | 596,348 |
| Mode SS | |||
|---|---|---|---|
| Quadrant | BADHDUFLAG | Total packets | Discarded packets |
| A | 0 | 144 | 0 |
| B | 0 | 144 | 0 |
| C | 0 | 144 | 0 |
| D | 0 | 144 | 0 |
| Mode M0 | |||
|---|---|---|---|
| Quadrant | BADHDUFLAG | Total packets | Discarded packets |
| A | 0 | 29025 | 0 |
| B | 0 | 16353 | 0 |
| C | 0 | 14890 | 0 |
| D | 0 | 29096 | 1 |
| Quadrant | Total seconds | Saturated seconds | Saturation percentage |
|---|---|---|---|
| A | 7251 | 926 | 12.770652% |
| B | 7251 | 116 | 1.599779% |
| C | 7252 | 12 | 0.165472% |
| D | 7251 | 1108 | 15.280651% |
Noise dominated data is calculated using 1-second bins in cleaned event files. If a bin has >2000 counts, and if more than 50% of those come from <1% of pixels, then it is considered to be noise-dominated and hence unusable.
| Quadrant | # 1 sec bins | Bins with >0 counts | Bins with >2000 counts | High rate bins dominated by noise | Noise dominated (total time) | Noise dominated (detector-on time) | Marked lightcurve |
|---|---|---|---|---|---|---|---|
| A | 7251 | 7251 | 726 | 726 | 10.01% | 10.01% | 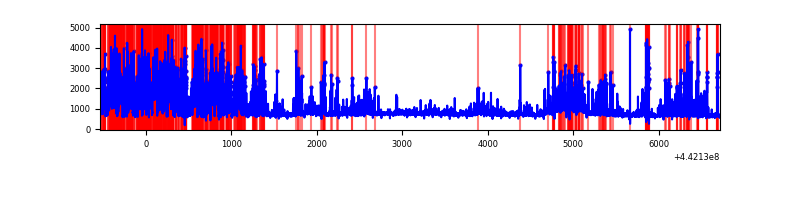 |
| B | 7251 | 7251 | 60 | 60 | 0.83% | 0.83% | 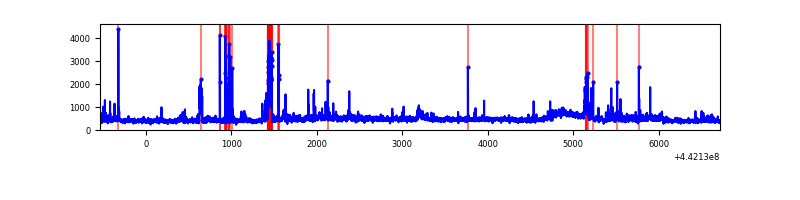 |
| C | 7252 | 7252 | 3 | 3 | 0.04% | 0.04% | 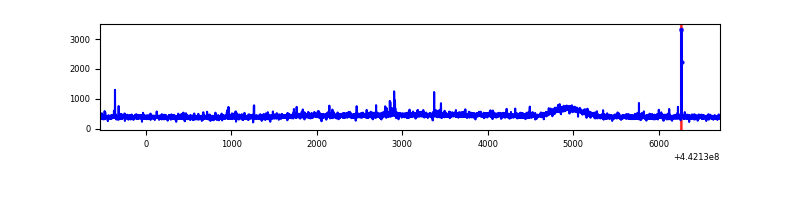 |
| D | 7251 | 7251 | 908 | 908 | 12.52% | 12.52% | 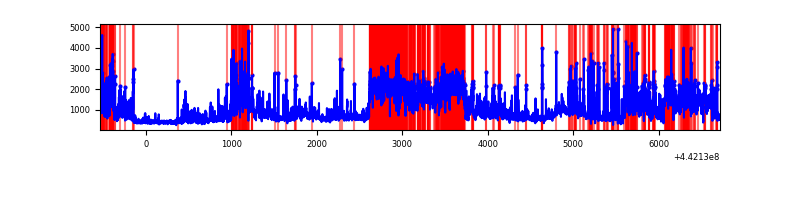 |
Top three noisy pixels from each quadrant. If the there are fewer than three noisy pixels in the level2.evt file, extra rows are filled as -1
| Pixel properties | Quadrant properties | ||||||
|---|---|---|---|---|---|---|---|
| Quadrant | DetID | PixID | Counts | Sigma | Mean | Median | Sigma |
| A | 15 | 223 | 3050741 | 18918.12 | 772 | 755 | 161.2 |
| A | 10 | 83 | 1817579 | 11269.2 | 772 | 755 | 161.2 |
| A | 13 | 248 | 36788 | 223.5 | 772 | 755 | 161.2 |
| B | 0 | 189 | 282543 | 1754.29 | 799 | 773 | 160.6 |
| B | 4 | 171 | 194047 | 1203.32 | 799 | 773 | 160.6 |
| B | 0 | 190 | 116494 | 720.48 | 799 | 773 | 160.6 |
| C | 15 | 208 | 31688 | 164.58 | 789 | 794 | 187.7 |
| C | 0 | 207 | 18022 | 91.77 | 789 | 794 | 187.7 |
| C | 12 | 2 | 12989 | 64.96 | 789 | 794 | 187.7 |
| D | 13 | 174 | 3285208 | 17447.06 | 746 | 724 | 188.3 |
| D | 13 | 249 | 576773 | 3059.95 | 746 | 724 | 188.3 |
| D | 1 | 52 | 452707 | 2400.92 | 746 | 724 | 188.3 |
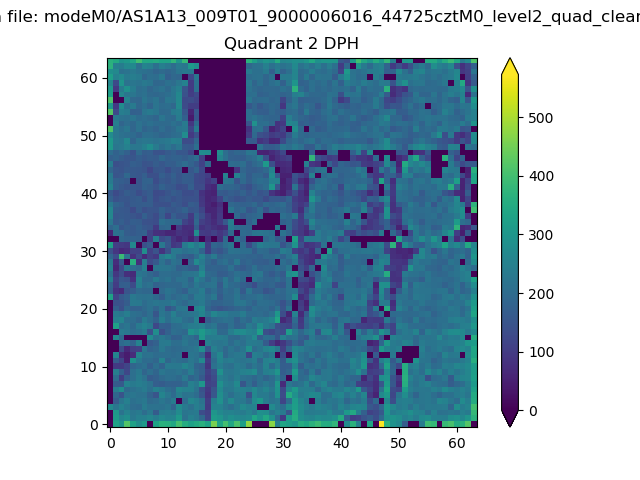
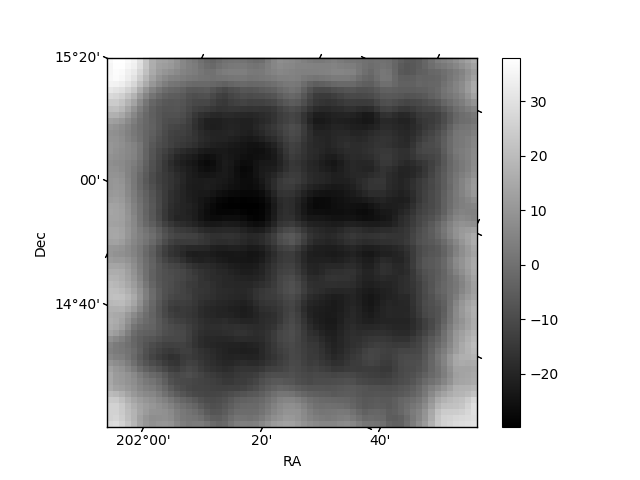
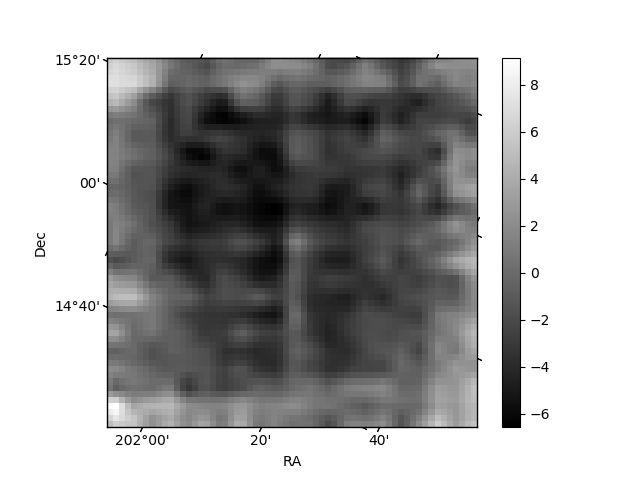
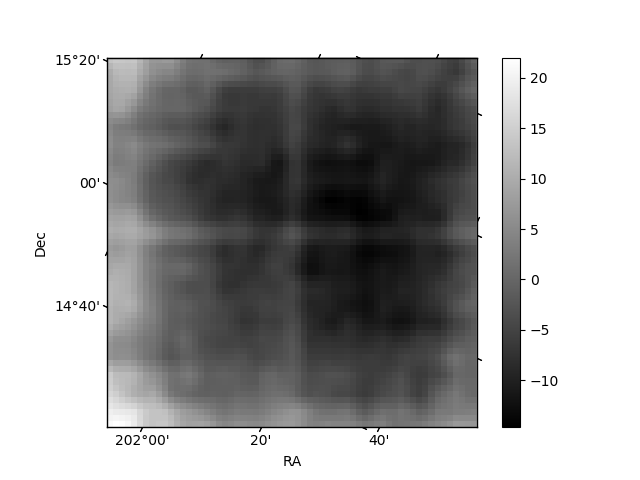
Histogram calculated using DETX and DETY for each event in the final _common_clean file
| Quadrant A | 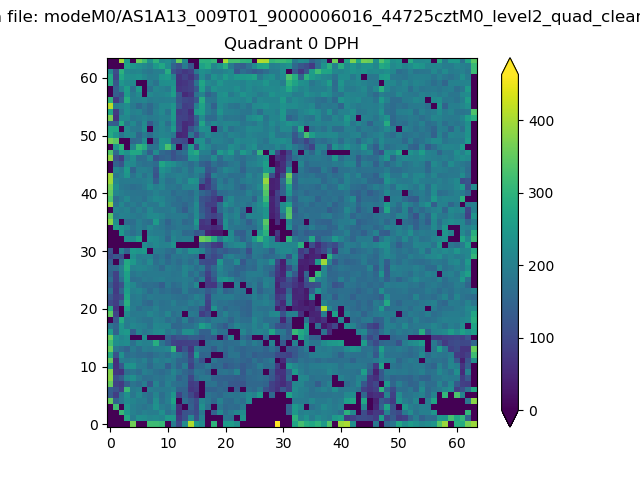 |
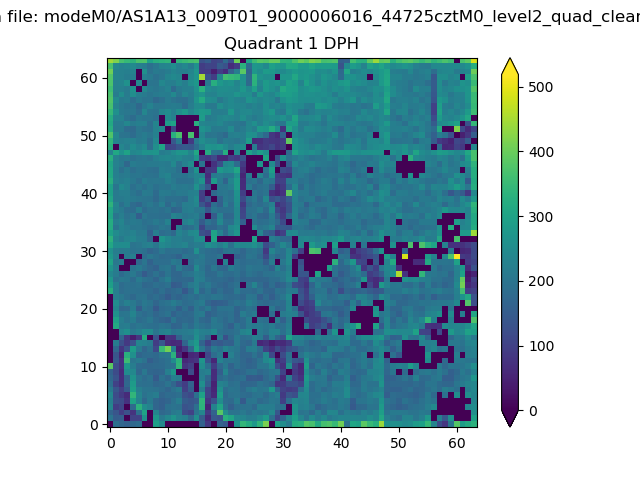 |
Quadrant B |
|---|---|---|---|
| Quadrant D | 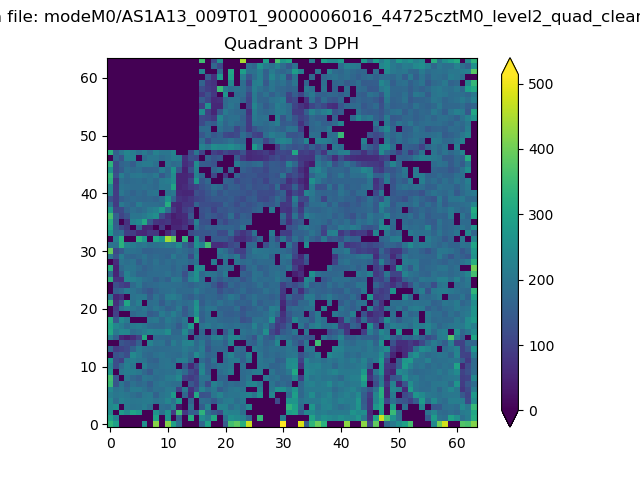 |
 |
Quadrant C |
| Plot type | Count rate plots | Images |
|---|---|---|
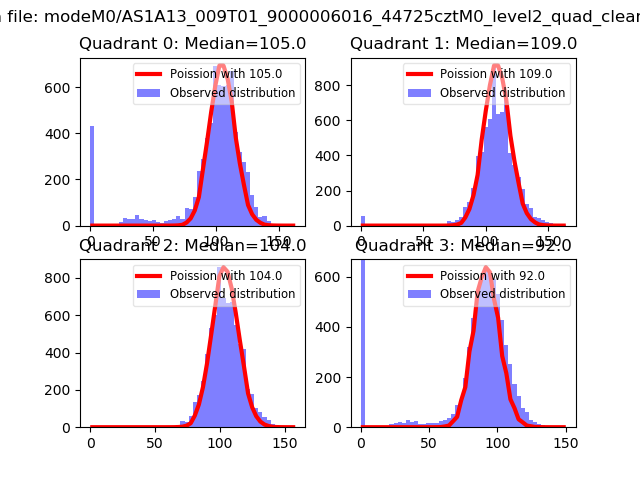
| Comparison with Poisson distribution Blue bars denote a histogram of data divided into 1 sec bins. Red curve is a Poisson curve with rate = median count rate of data. |
 |
 |
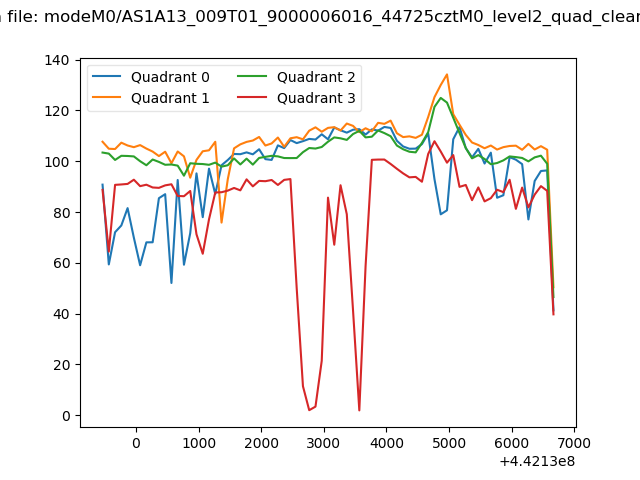
| Quadrant-wise count rates Data is divided into 100 sec bins |
 |
|
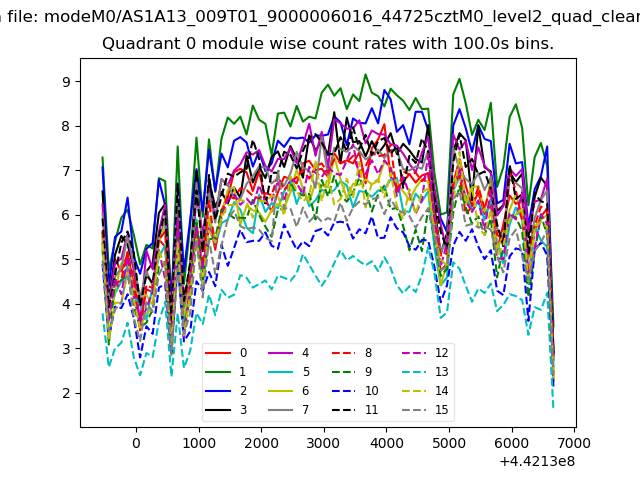
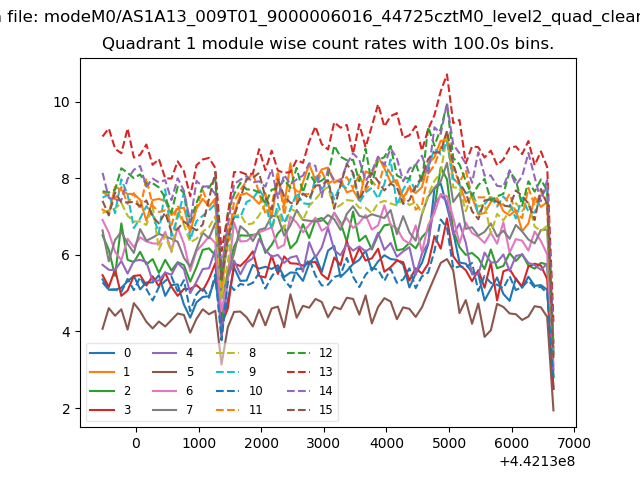
| Module-wise count rates for Quadrant A Data is divided into 100 sec bins |
 |
 |
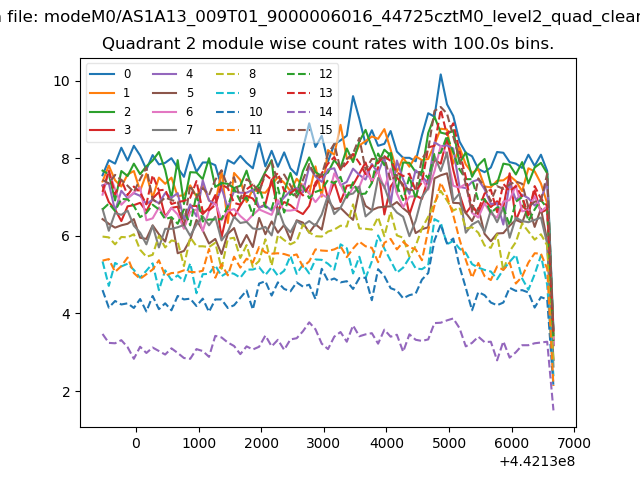
| Module-wise count rates for Quadrant B Data is divided into 100 sec bins |
 |
 |
| Module-wise count rates for Quadrant C Data is divided into 100 sec bins |
 |
 |
| Module-wise count rates for Quadrant D Data is divided into 100 sec bins |
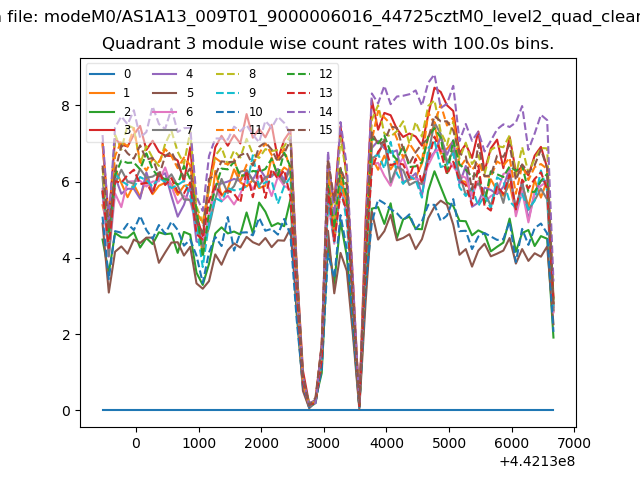 |
 |
| Parameter | Plot |
|---|---|
| CZT HV Monitor | 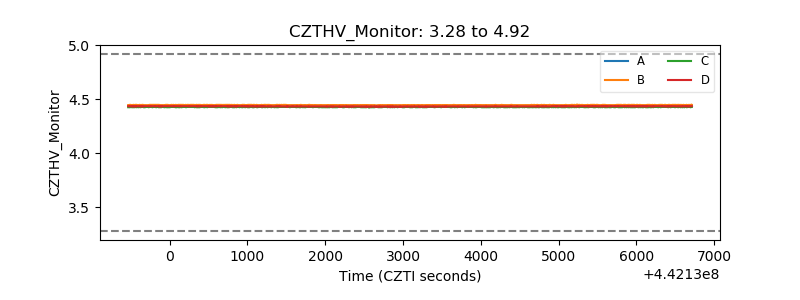 |
| D_VDD | 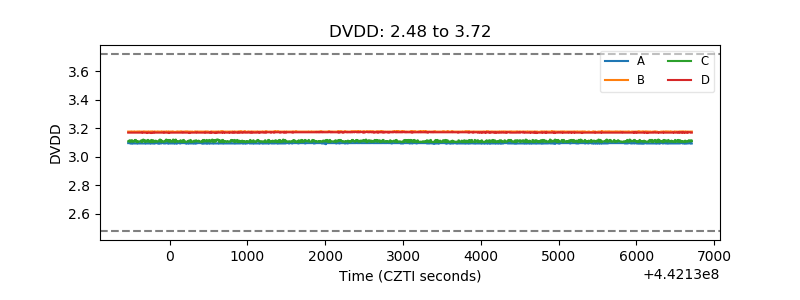 |
| Temperature 1 | 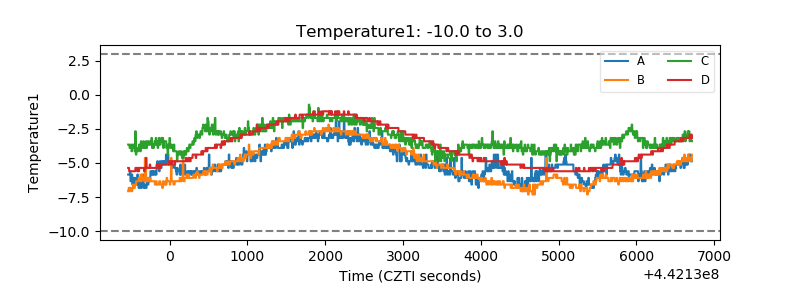 |
| Veto HV Monitor | 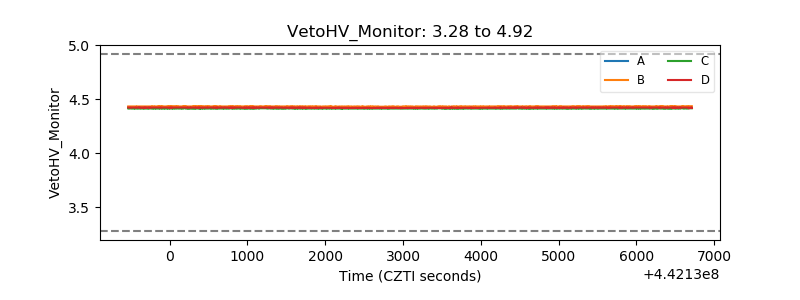 |
| Veto LLD | 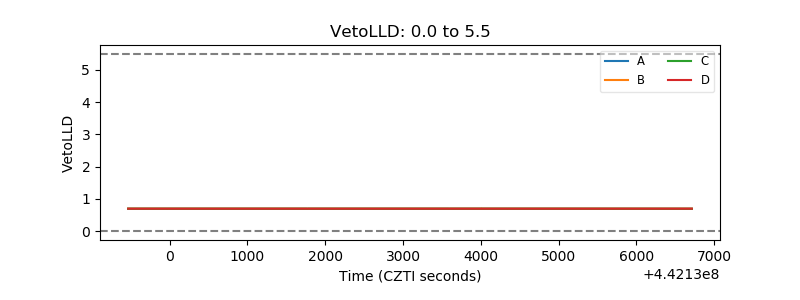 |
| Alpha Counter | 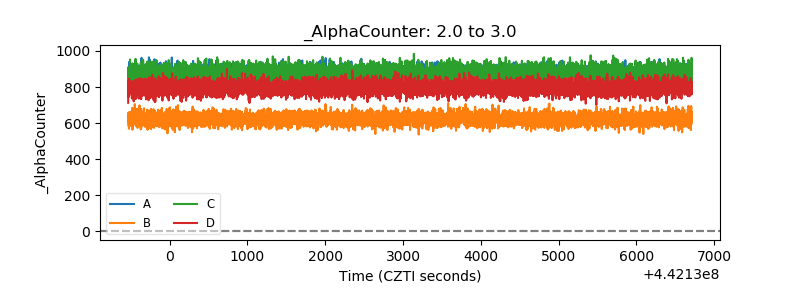 |
| _CPM_Rate | 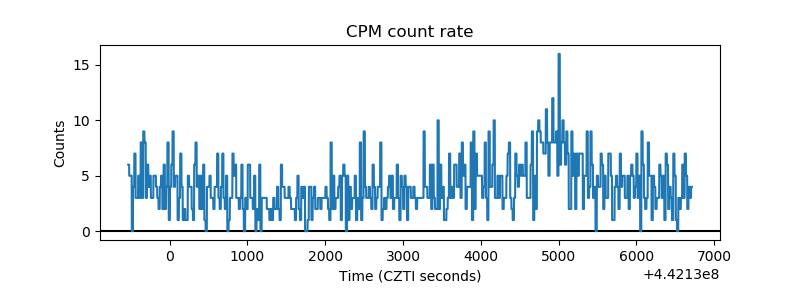 |
| CZT Counter |  |
| +2.5 Volts monitor | 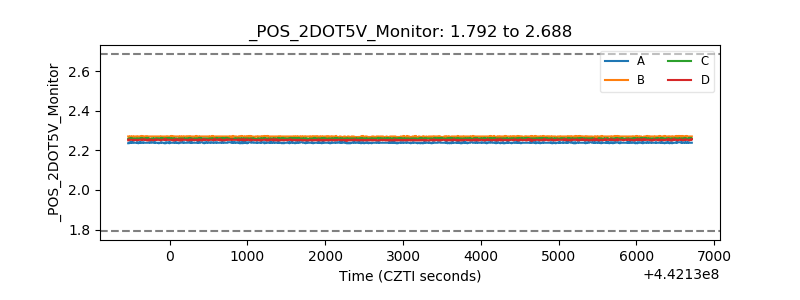 |
| +5 Volts monitor | 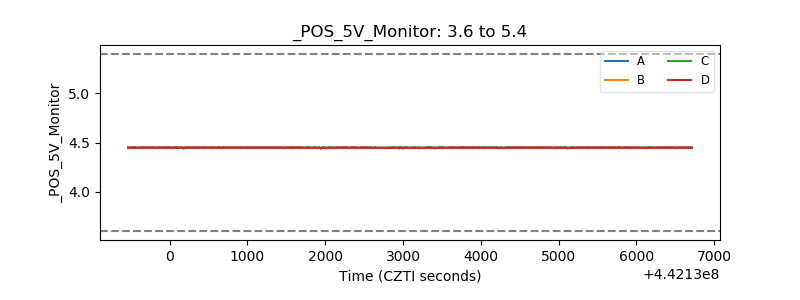 |
| _ROLL_ROT | 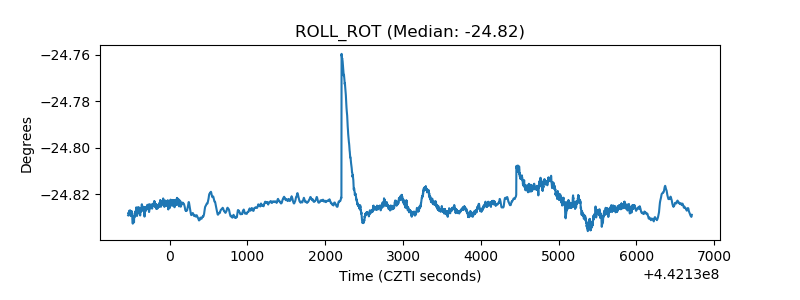 |
| _Roll_DEC | 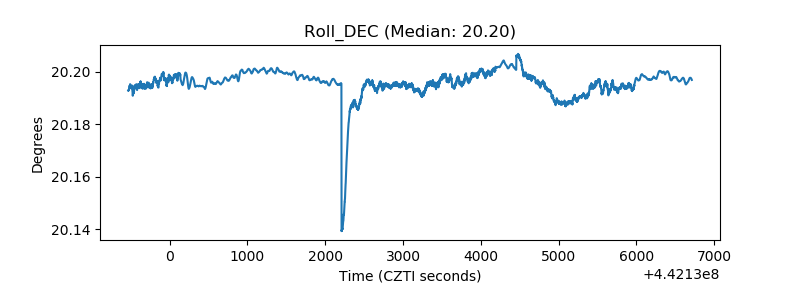 |
| _Roll_RA | 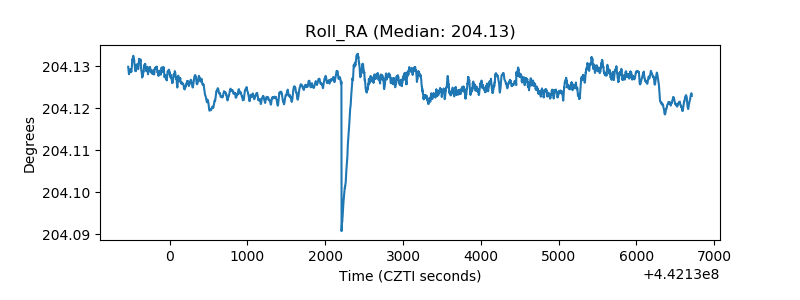 |
| Veto Counter | 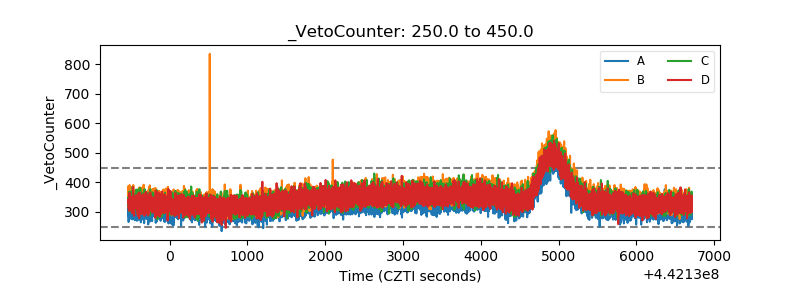 |