| Param | Original file | Final file |
|---|---|---|
| Filename | modeM0/AS1A13_009T01_9000006016_44726cztM0_level2.fits | modeM0/AS1A13_009T01_9000006016_44726cztM0_level2_quad_clean.evt |
| Size (bytes) | 659,482,560 | 105,261,120 |
| Size | 628.9 MB | 100.4 MB |
| Events in quadrant A | 9,565,453 | 582,236 |
| Events in quadrant B | 3,932,306 | 758,986 |
| Events in quadrant C | 3,124,639 | 730,820 |
| Events in quadrant D | 7,242,279 | 622,706 |
| Mode SS | |||
|---|---|---|---|
| Quadrant | BADHDUFLAG | Total packets | Discarded packets |
| A | 0 | 142 | 0 |
| B | 0 | 142 | 0 |
| C | 0 | 142 | 0 |
| D | 0 | 142 | 0 |
| Mode M0 | |||
|---|---|---|---|
| Quadrant | BADHDUFLAG | Total packets | Discarded packets |
| A | 0 | 33830 | 0 |
| B | 0 | 16527 | 0 |
| C | 0 | 14650 | 0 |
| D | 0 | 26426 | 0 |
| Quadrant | Total seconds | Saturated seconds | Saturation percentage |
|---|---|---|---|
| A | 7060 | 1949 | 27.606232% |
| B | 7060 | 180 | 2.549575% |
| C | 7061 | 33 | 0.467356% |
| D | 7061 | 675 | 9.559552% |
Noise dominated data is calculated using 1-second bins in cleaned event files. If a bin has >2000 counts, and if more than 50% of those come from <1% of pixels, then it is considered to be noise-dominated and hence unusable.
| Quadrant | # 1 sec bins | Bins with >0 counts | Bins with >2000 counts | High rate bins dominated by noise | Noise dominated (total time) | Noise dominated (detector-on time) | Marked lightcurve |
|---|---|---|---|---|---|---|---|
| A | 7060 | 7060 | 1411 | 1411 | 19.99% | 19.99% | 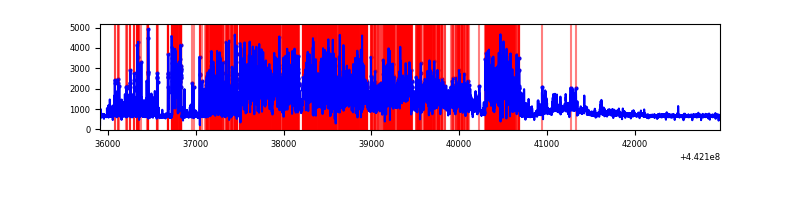 |
| B | 7060 | 7060 | 83 | 83 | 1.18% | 1.18% | 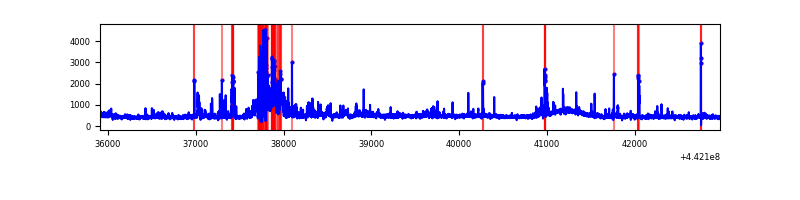 |
| C | 7061 | 7061 | 8 | 8 | 0.11% | 0.11% | 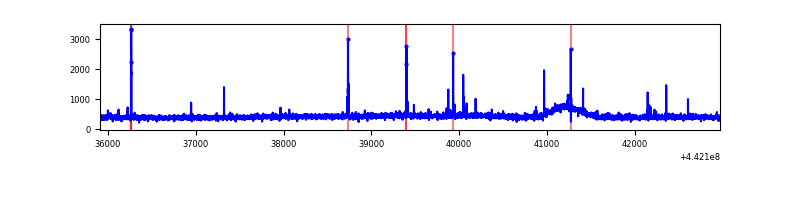 |
| D | 7061 | 7061 | 559 | 559 | 7.92% | 7.92% | 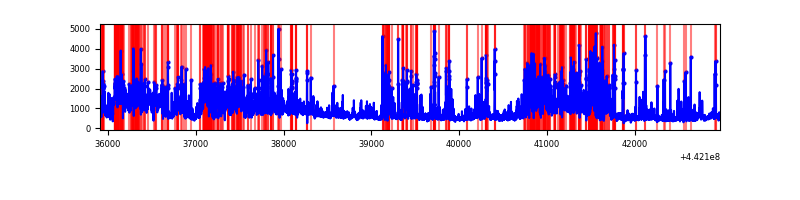 |
Top three noisy pixels from each quadrant. If the there are fewer than three noisy pixels in the level2.evt file, extra rows are filled as -1
| Pixel properties | Quadrant properties | ||||||
|---|---|---|---|---|---|---|---|
| Quadrant | DetID | PixID | Counts | Sigma | Mean | Median | Sigma |
| A | 15 | 223 | 5055043 | 33514.93 | 720 | 704 | 150.8 |
| A | 10 | 83 | 1677037 | 11115.63 | 720 | 704 | 150.8 |
| A | 13 | 248 | 34516 | 224.2 | 720 | 704 | 150.8 |
| B | 4 | 171 | 247881 | 1580.36 | 782 | 757 | 156.4 |
| B | 0 | 189 | 235815 | 1503.19 | 782 | 757 | 156.4 |
| B | 5 | 255 | 197411 | 1257.6 | 782 | 757 | 156.4 |
| C | 14 | 254 | 30661 | 162.42 | 776 | 781 | 184.0 |
| C | 0 | 207 | 16170 | 83.65 | 776 | 781 | 184.0 |
| C | 15 | 208 | 15182 | 78.28 | 776 | 781 | 184.0 |
| D | 13 | 174 | 1765415 | 9349.38 | 748 | 725 | 188.7 |
| D | 13 | 249 | 699712 | 3703.25 | 748 | 725 | 188.7 |
| D | 1 | 52 | 457684 | 2420.98 | 748 | 725 | 188.7 |
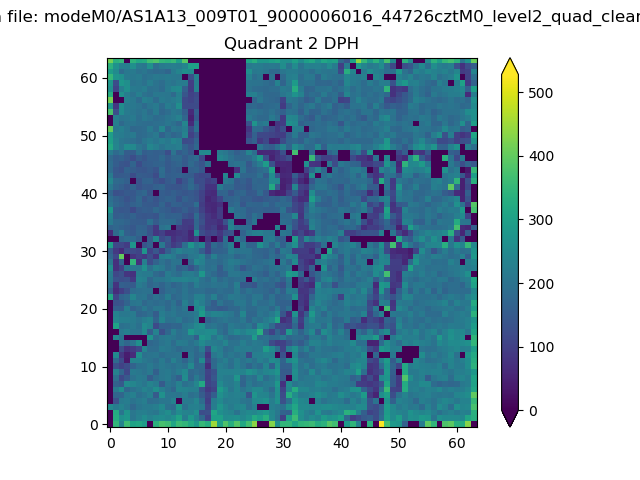
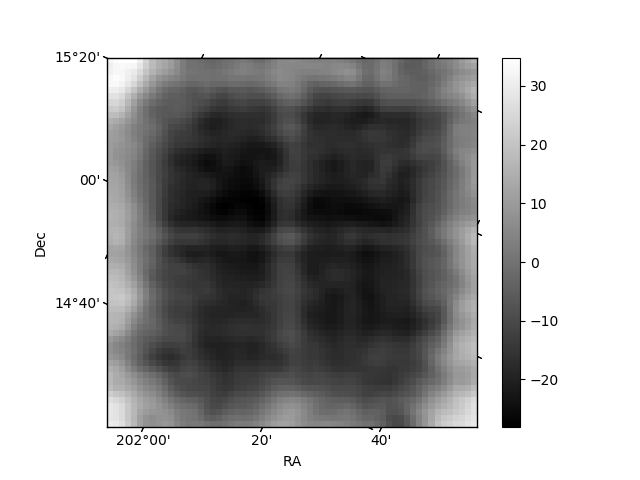
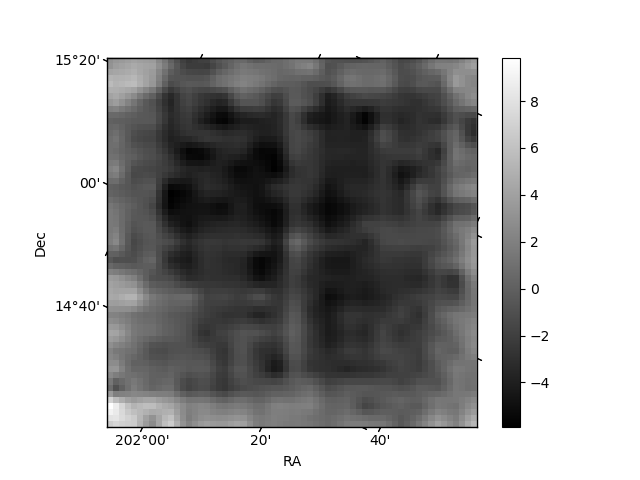
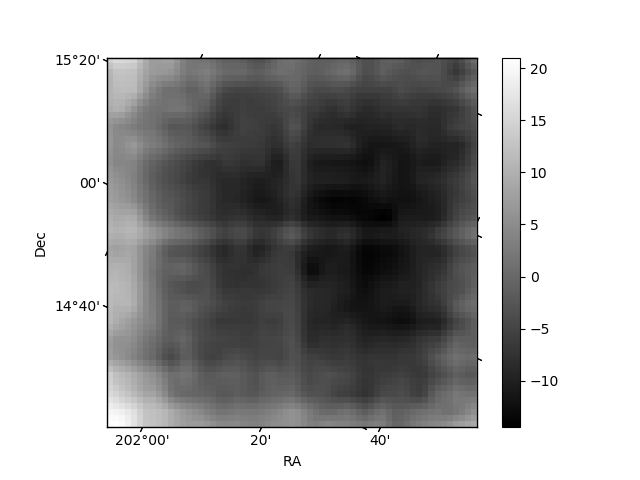
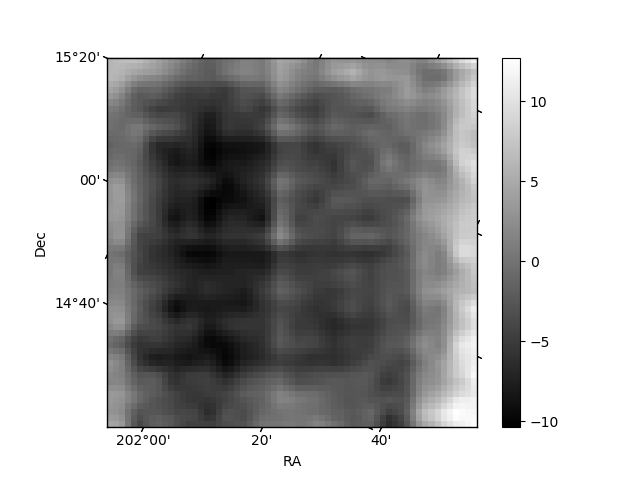
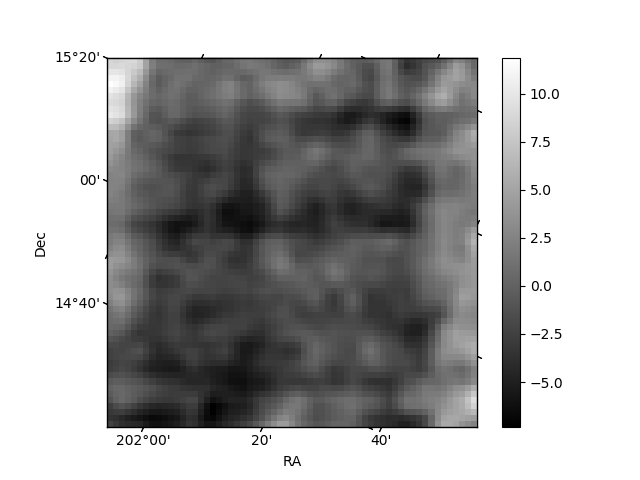
Histogram calculated using DETX and DETY for each event in the final _common_clean file
| Quadrant A | 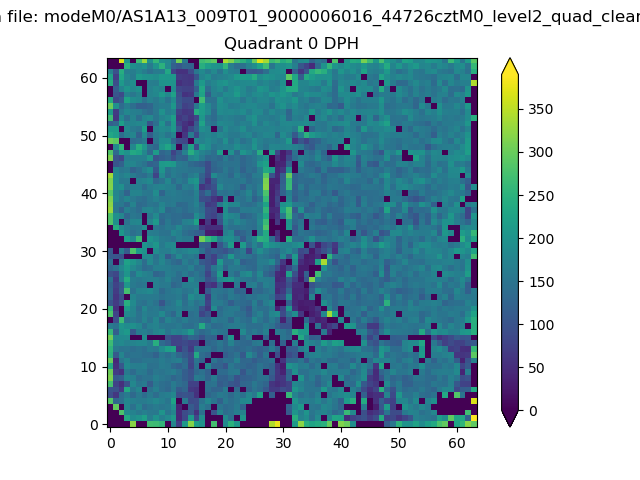 |
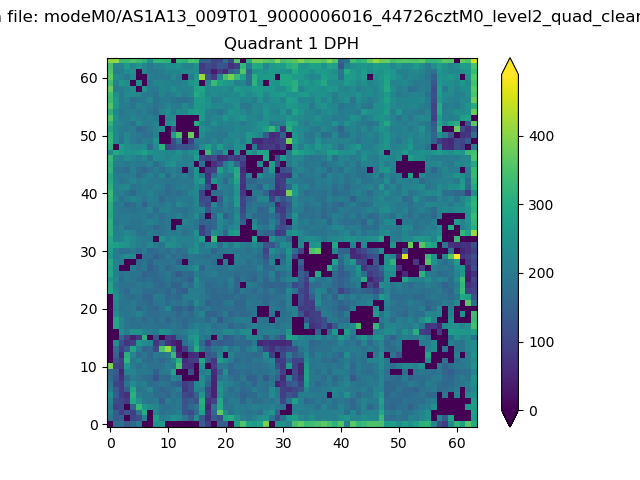 |
Quadrant B |
|---|---|---|---|
| Quadrant D | 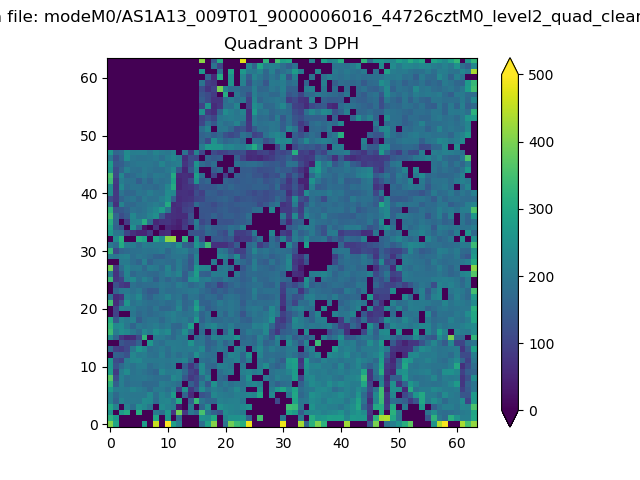 |
 |
Quadrant C |
| Plot type | Count rate plots | Images |
|---|---|---|
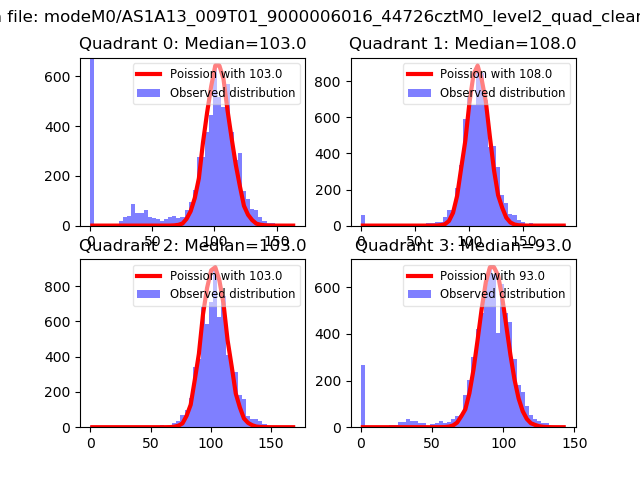
| Comparison with Poisson distribution Blue bars denote a histogram of data divided into 1 sec bins. Red curve is a Poisson curve with rate = median count rate of data. |
 |
 |
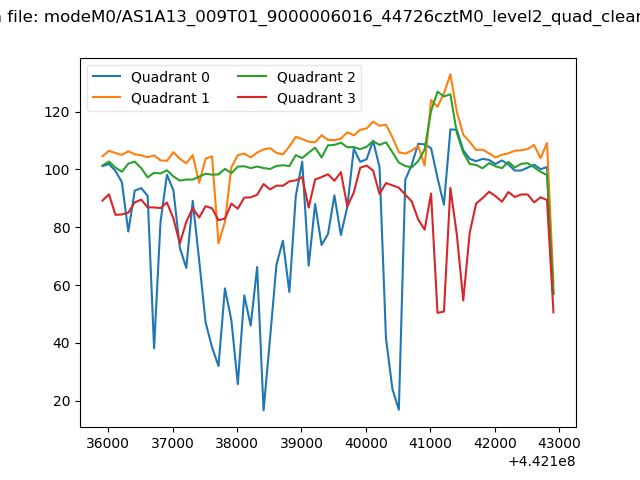
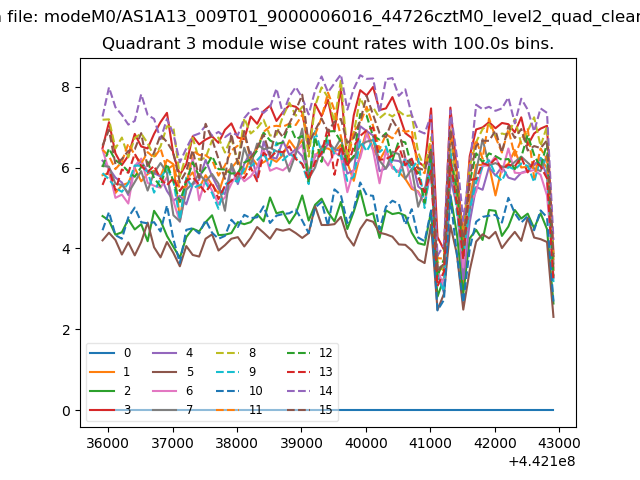
| Quadrant-wise count rates Data is divided into 100 sec bins |
 |
|
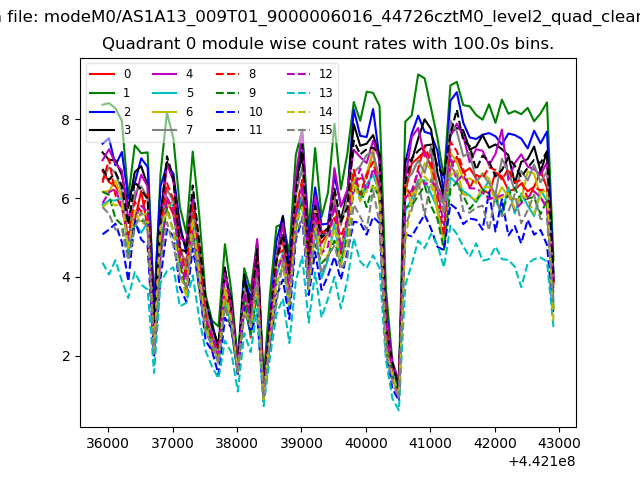
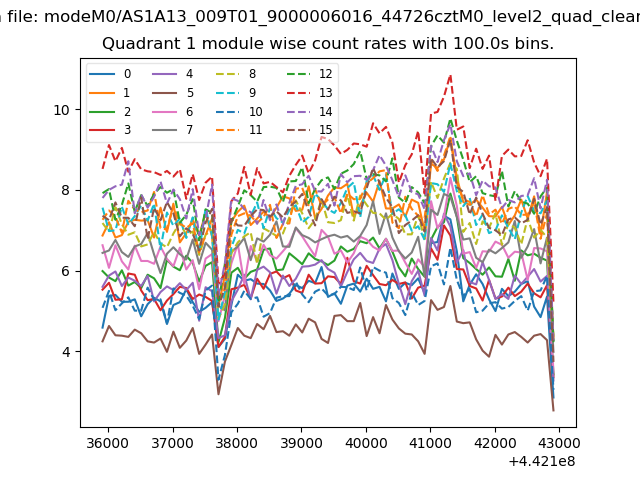
| Module-wise count rates for Quadrant A Data is divided into 100 sec bins |
 |
 |
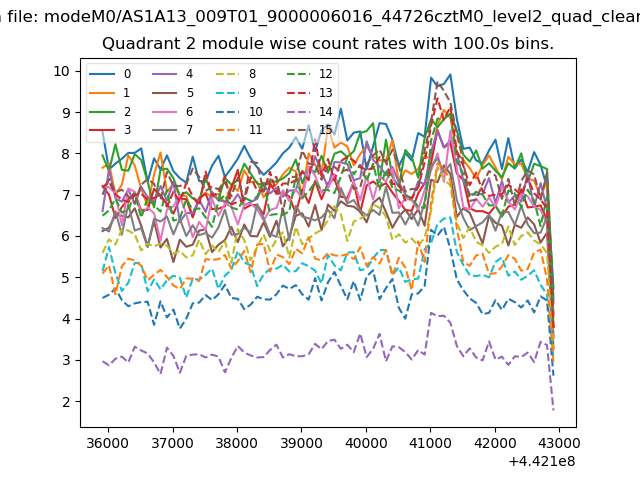
| Module-wise count rates for Quadrant B Data is divided into 100 sec bins |
 |
 |
| Module-wise count rates for Quadrant C Data is divided into 100 sec bins |
 |
 |
| Module-wise count rates for Quadrant D Data is divided into 100 sec bins |
 |
 |
| Parameter | Plot |
|---|---|
| CZT HV Monitor | 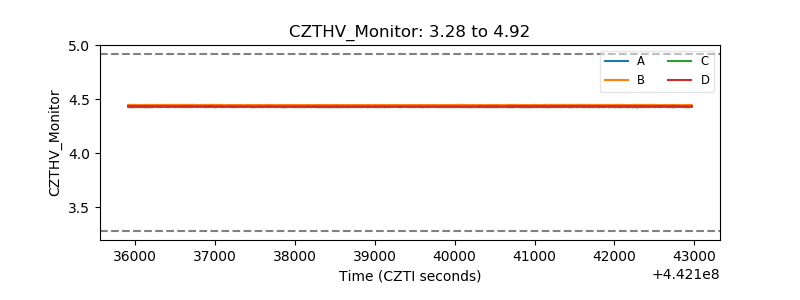 |
| D_VDD | 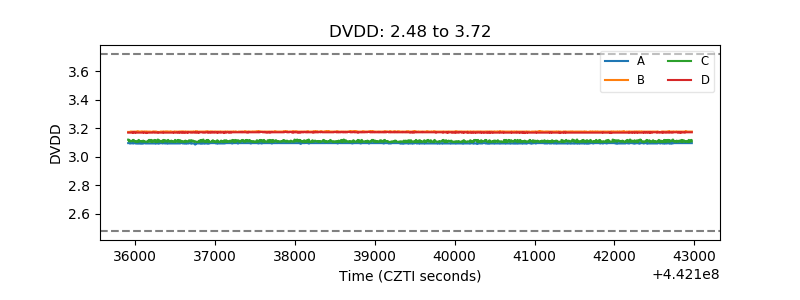 |
| Temperature 1 | 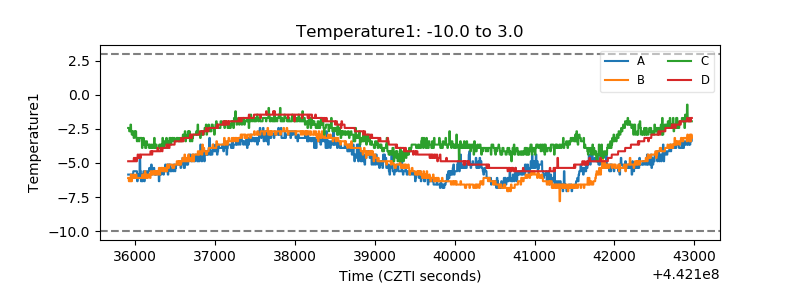 |
| Veto HV Monitor | 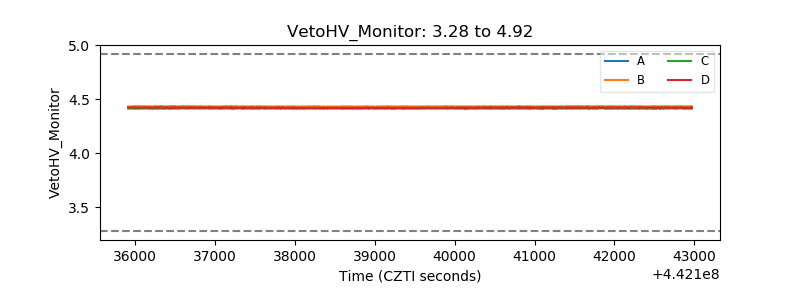 |
| Veto LLD | 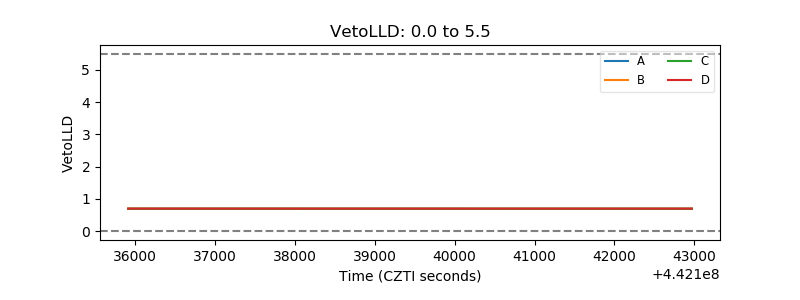 |
| Alpha Counter | 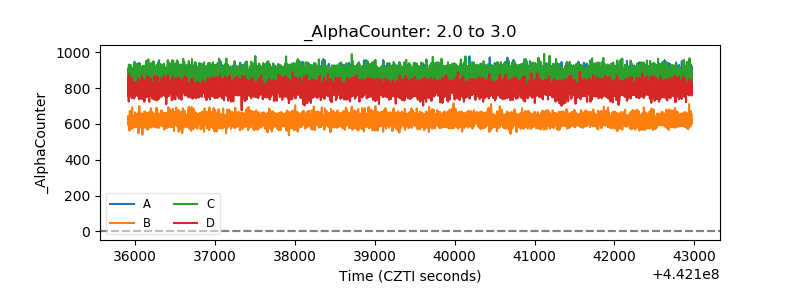 |
| _CPM_Rate | 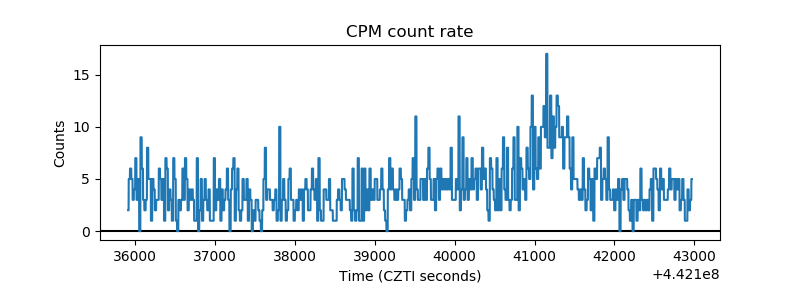 |
| CZT Counter | 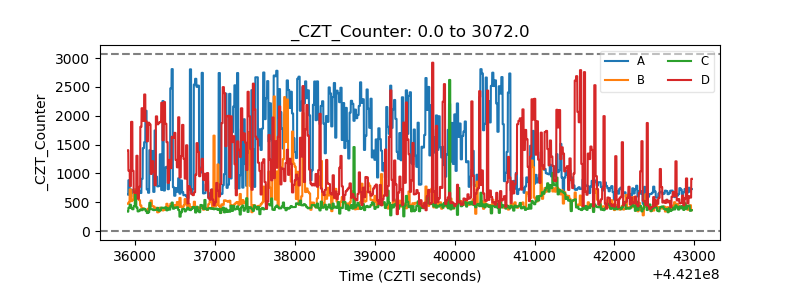 |
| +2.5 Volts monitor |  |
| +5 Volts monitor | 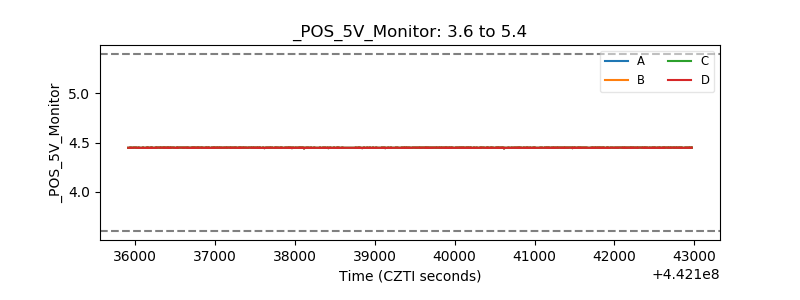 |
| _ROLL_ROT | 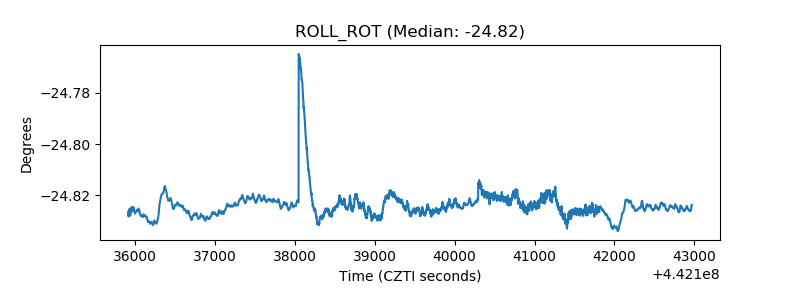 |
| _Roll_DEC | 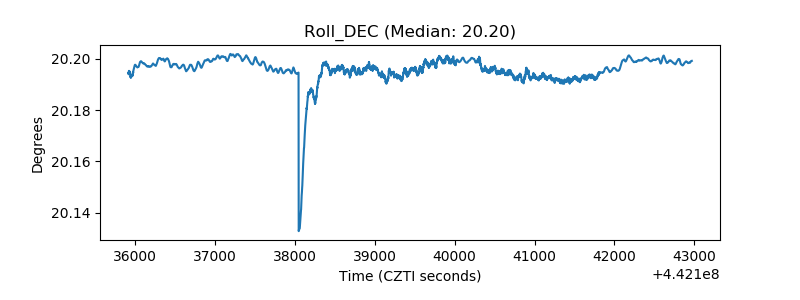 |
| _Roll_RA | 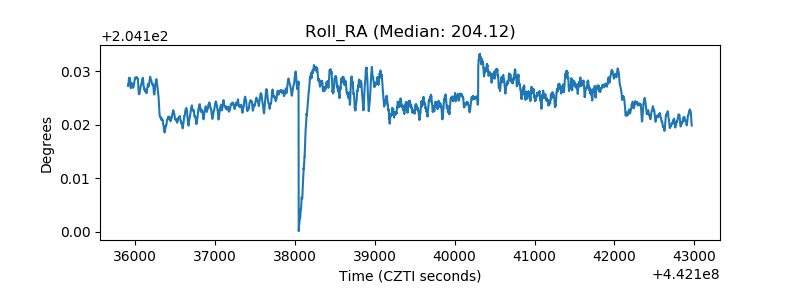 |
| Veto Counter | 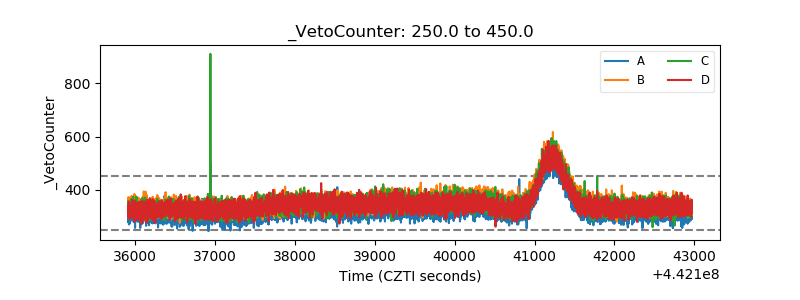 |