| Param | Original file | Final file |
|---|---|---|
| Filename | modeM0/AS1A13_004T11_9000006018_44730cztM0_level2.fits | modeM0/AS1A13_004T11_9000006018_44730cztM0_level2_quad_clean.evt |
| Size (bytes) | 704,877,120 | 138,600,000 |
| Size | 672.2 MB | 132.2 MB |
| Events in quadrant A | 9,488,882 | 861,913 |
| Events in quadrant B | 4,782,453 | 957,912 |
| Events in quadrant C | 3,863,656 | 934,881 |
| Events in quadrant D | 7,269,487 | 824,880 |
| Mode SS | |||
|---|---|---|---|
| Quadrant | BADHDUFLAG | Total packets | Discarded packets |
| A | 0 | 182 | 0 |
| B | 0 | 182 | 0 |
| C | 0 | 182 | 0 |
| D | 0 | 182 | 0 |
| Mode M0 | |||
|---|---|---|---|
| Quadrant | BADHDUFLAG | Total packets | Discarded packets |
| A | 0 | 34819 | 2 |
| B | 0 | 20190 | 2 |
| C | 0 | 18152 | 2 |
| D | 0 | 27733 | 2 |
| Mode M9 | |||
|---|---|---|---|
| Quadrant | BADHDUFLAG | Total packets | Discarded packets |
| A | 0 | 16 | 0 |
| B | 0 | 16 | 0 |
| C | 0 | 16 | 0 |
| D | 0 | 16 | 0 |
| Quadrant | Total seconds | Saturated seconds | Saturation percentage |
|---|---|---|---|
| A | 8882 | 1135 | 12.778653% |
| B | 8882 | 212 | 2.386850% |
| C | 8882 | 62 | 0.698041% |
| D | 8883 | 567 | 6.382979% |
Noise dominated data is calculated using 1-second bins in cleaned event files. If a bin has >2000 counts, and if more than 50% of those come from <1% of pixels, then it is considered to be noise-dominated and hence unusable.
| Quadrant | # 1 sec bins | Bins with >0 counts | Bins with >2000 counts | High rate bins dominated by noise | Noise dominated (total time) | Noise dominated (detector-on time) | Marked lightcurve |
|---|---|---|---|---|---|---|---|
| A | 10502 | 8884 | 576 | 576 | 5.48% | 6.48% | 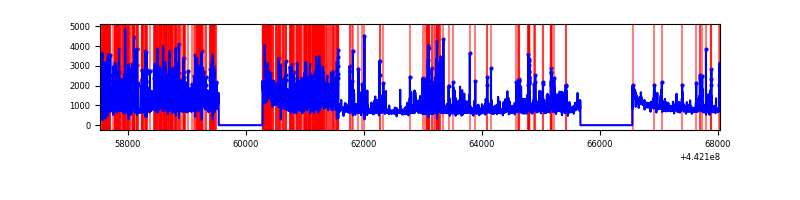 |
| B | 10502 | 8884 | 56 | 56 | 0.53% | 0.63% | 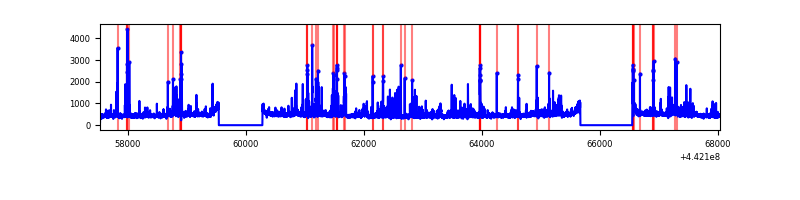 |
| C | 10502 | 8884 | 0 | 0 | 0.00% | 0.00% | 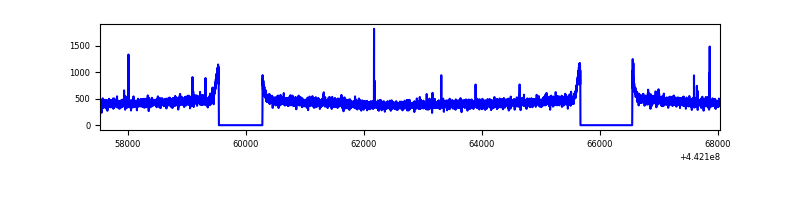 |
| D | 10503 | 8885 | 436 | 436 | 4.15% | 4.91% | 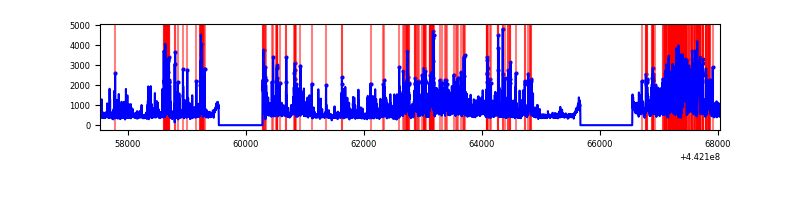 |
Top three noisy pixels from each quadrant. If the there are fewer than three noisy pixels in the level2.evt file, extra rows are filled as -1
| Pixel properties | Quadrant properties | ||||||
|---|---|---|---|---|---|---|---|
| Quadrant | DetID | PixID | Counts | Sigma | Mean | Median | Sigma |
| A | 15 | 223 | 2863812 | 14525.08 | 953 | 931 | 197.1 |
| A | 10 | 83 | 2578300 | 13076.51 | 953 | 931 | 197.1 |
| A | 12 | 227 | 260887 | 1318.91 | 953 | 931 | 197.1 |
| B | 0 | 189 | 374319 | 1927.79 | 984 | 951 | 193.7 |
| B | 5 | 172 | 123849 | 634.55 | 984 | 951 | 193.7 |
| B | 0 | 219 | 88068 | 449.81 | 984 | 951 | 193.7 |
| C | 3 | 233 | 17391 | 71.6 | 978 | 985 | 229.1 |
| C | 0 | 207 | 14513 | 59.04 | 978 | 985 | 229.1 |
| C | 12 | 2 | 13639 | 55.23 | 978 | 985 | 229.1 |
| D | 1 | 52 | 1609728 | 6720.27 | 956 | 927 | 239.4 |
| D | 13 | 249 | 795710 | 3319.96 | 956 | 927 | 239.4 |
| D | 2 | 249 | 394576 | 1644.35 | 956 | 927 | 239.4 |
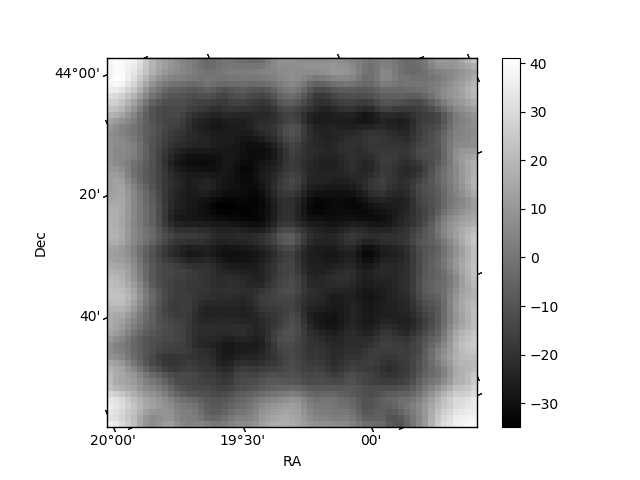
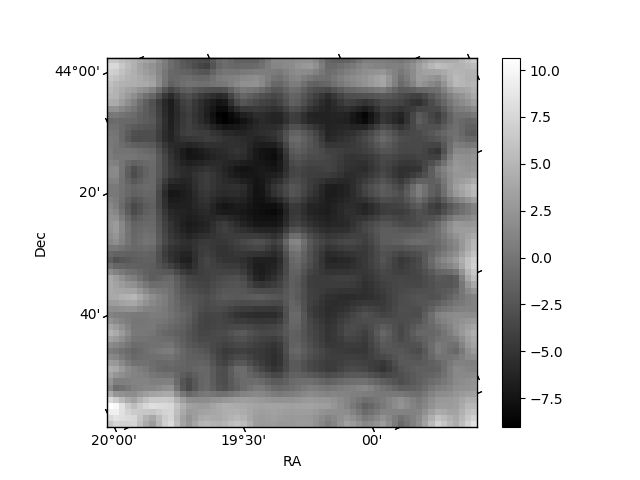
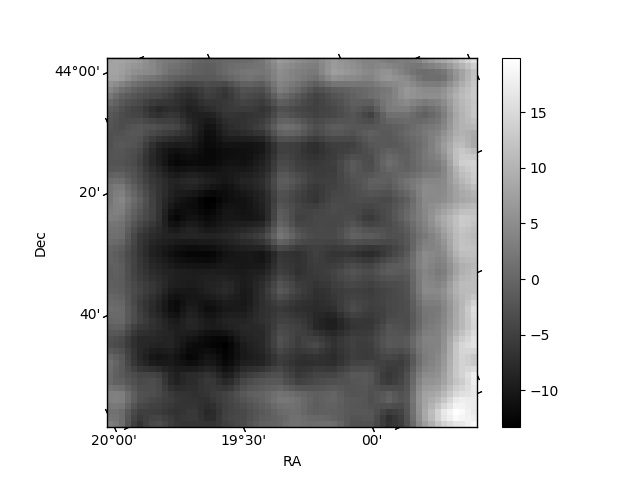
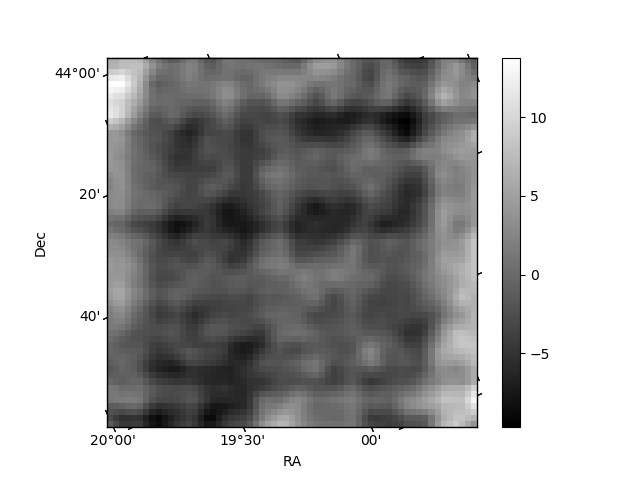
Histogram calculated using DETX and DETY for each event in the final _common_clean file
| Quadrant A | 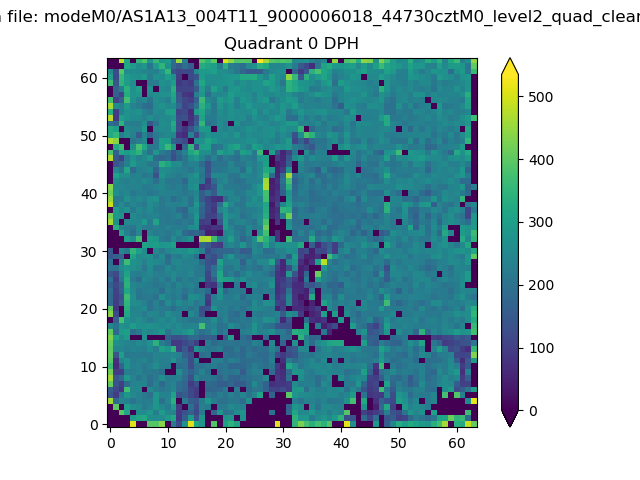 |
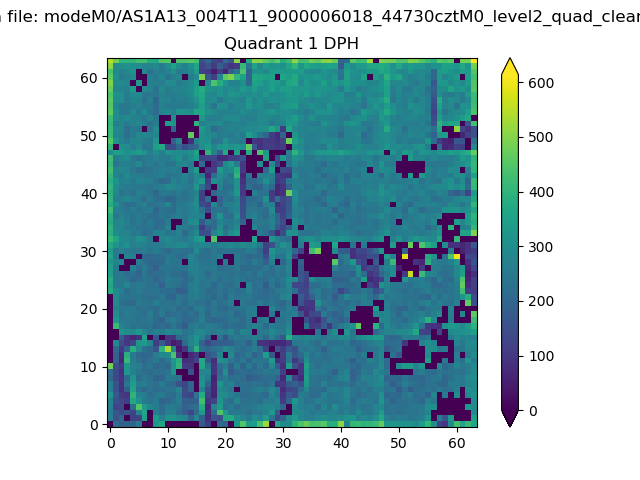 |
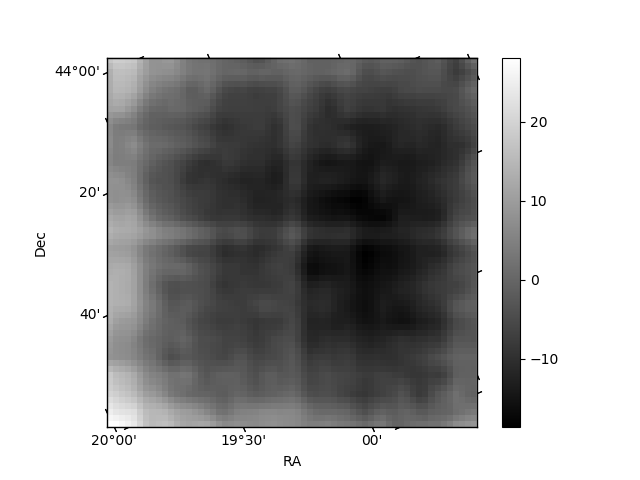
Quadrant B |
|---|---|---|---|
| Quadrant D | 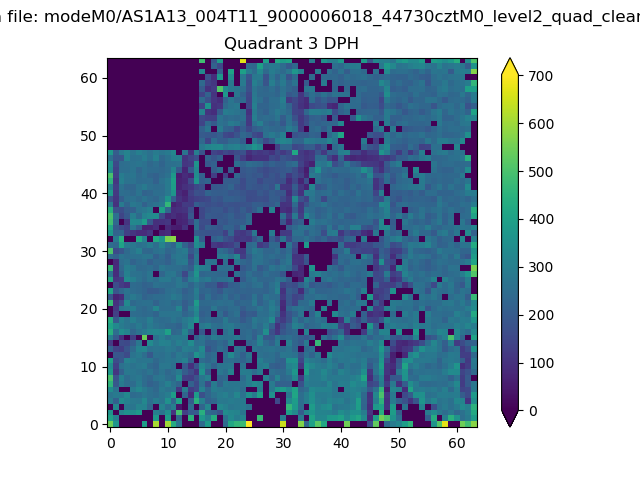 |
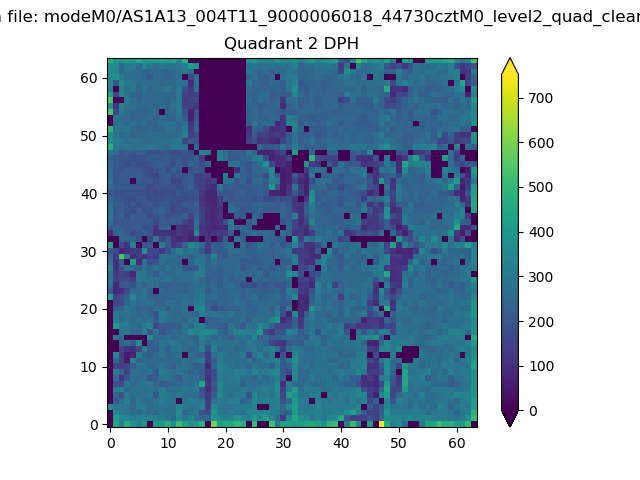 |
Quadrant C |
| Plot type | Count rate plots | Images |
|---|---|---|
| Comparison with Poisson distribution Blue bars denote a histogram of data divided into 1 sec bins. Red curve is a Poisson curve with rate = median count rate of data. |
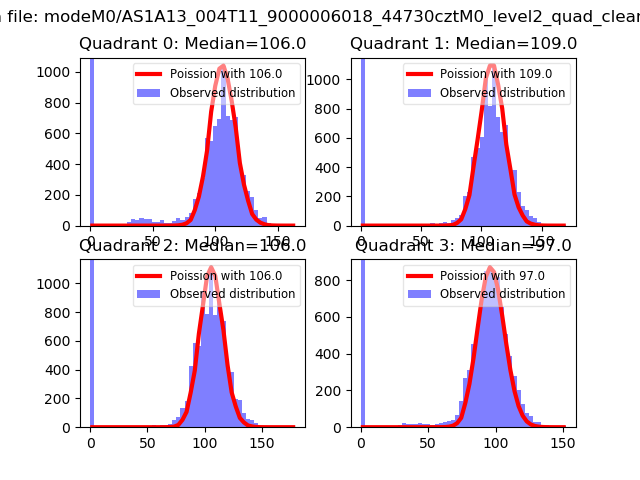 |
 |
| Quadrant-wise count rates Data is divided into 100 sec bins |
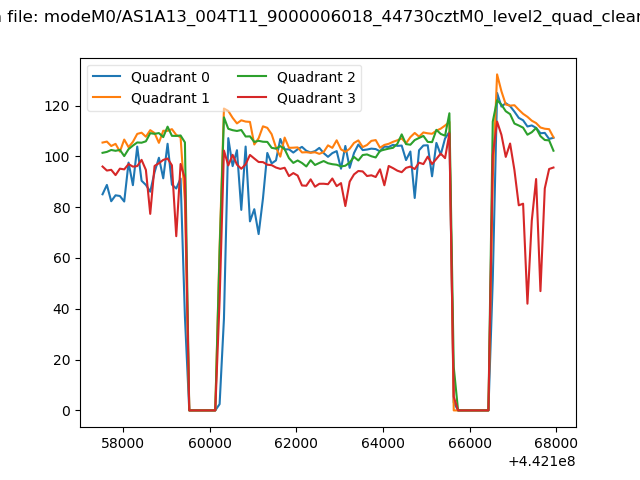 |
|
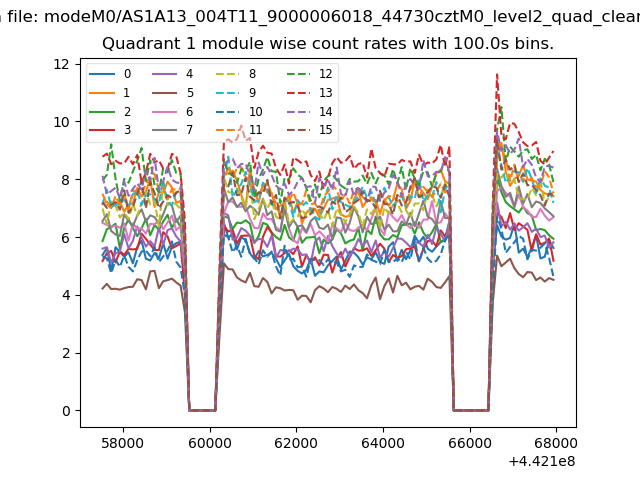
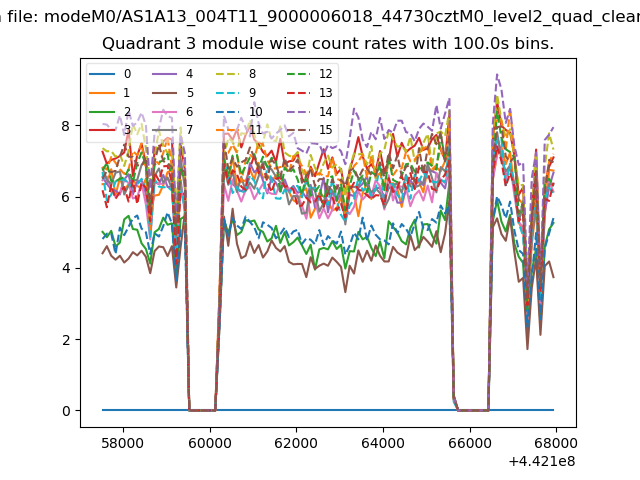
| Module-wise count rates for Quadrant A Data is divided into 100 sec bins |
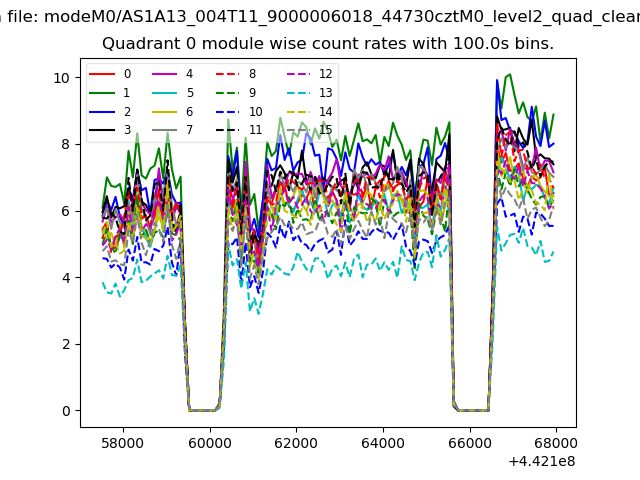 |
 |
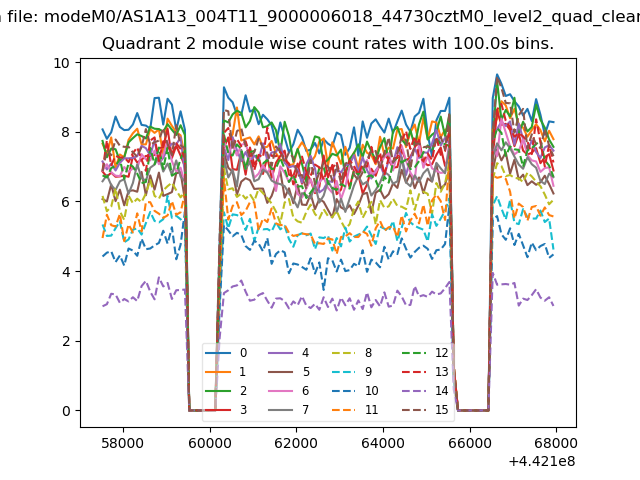
| Module-wise count rates for Quadrant B Data is divided into 100 sec bins |
 |
 |
| Module-wise count rates for Quadrant C Data is divided into 100 sec bins |
 |
 |
| Module-wise count rates for Quadrant D Data is divided into 100 sec bins |
 |
 |
| Parameter | Plot |
|---|---|
| CZT HV Monitor | 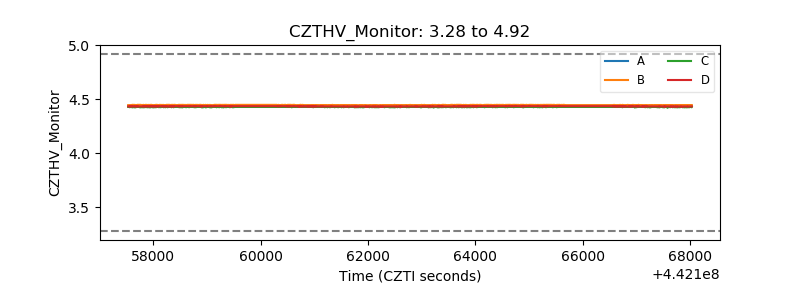 |
| D_VDD | 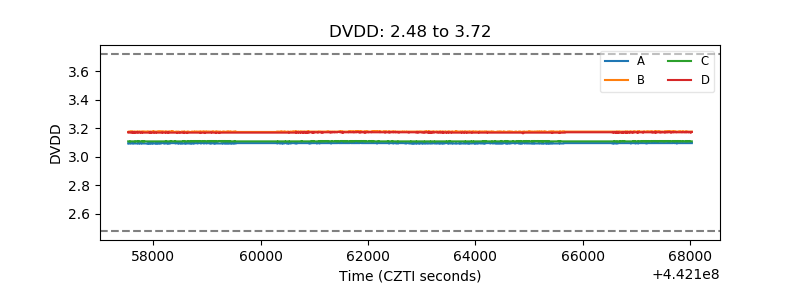 |
| Temperature 1 | 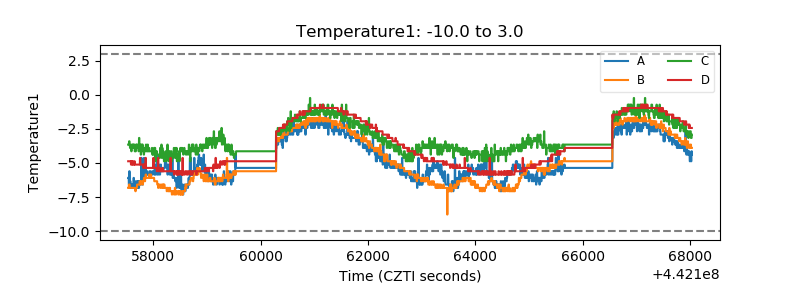 |
| Veto HV Monitor | 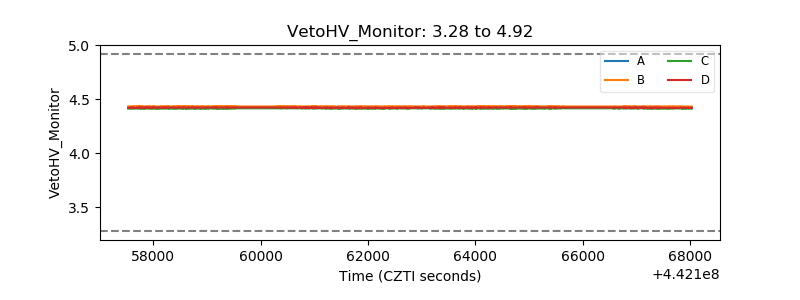 |
| Veto LLD | 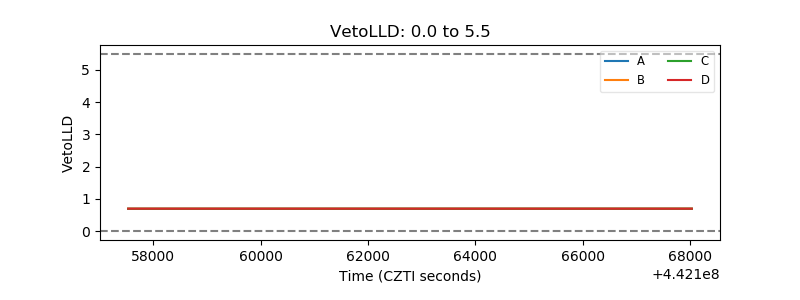 |
| Alpha Counter | 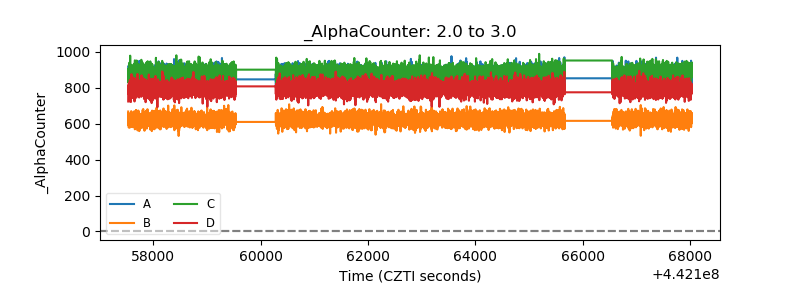 |
| _CPM_Rate | 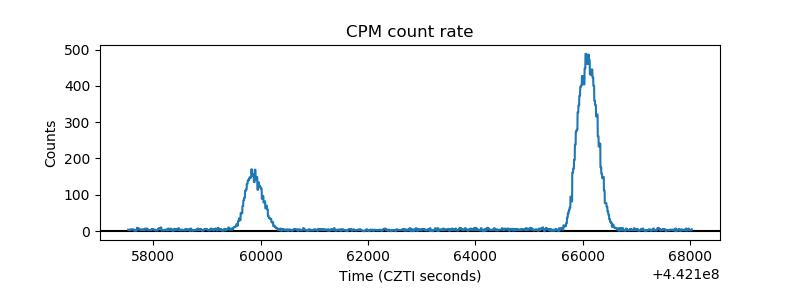 |
| CZT Counter | 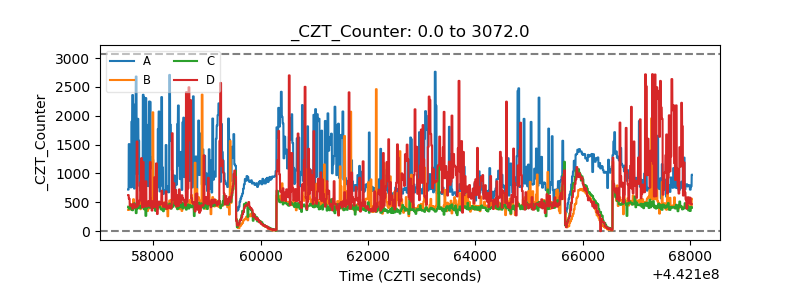 |
| +2.5 Volts monitor | 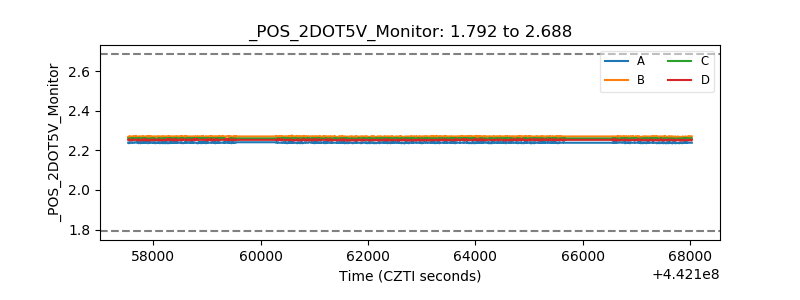 |
| +5 Volts monitor | 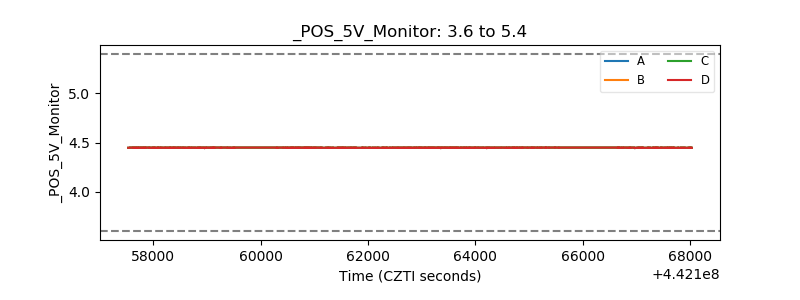 |
| _ROLL_ROT | 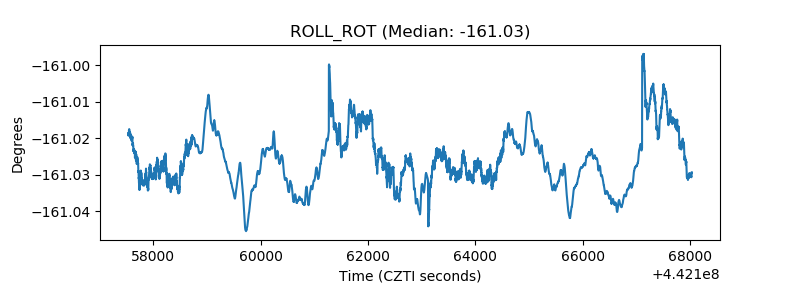 |
| _Roll_DEC | 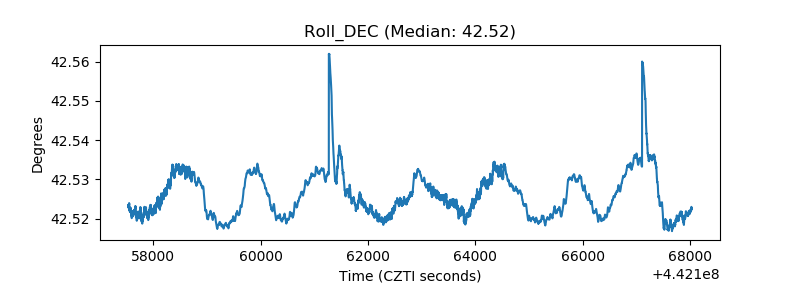 |
| _Roll_RA |  |
| Veto Counter | 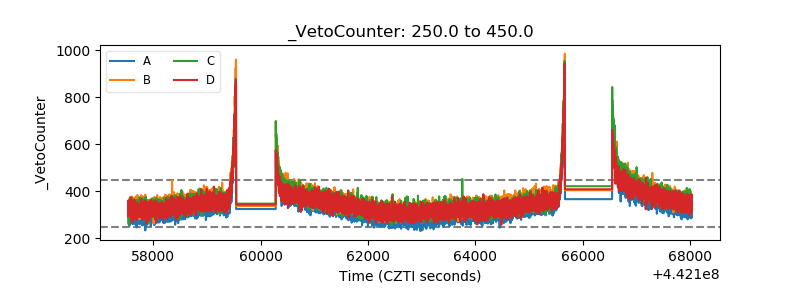 |