| Param | Original file | Final file |
|---|---|---|
| Filename | modeM0/AS1A13_004T11_9000006018_44732cztM0_level2.fits | modeM0/AS1A13_004T11_9000006018_44732cztM0_level2_quad_clean.evt |
| Size (bytes) | 566,478,720 | 97,243,200 |
| Size | 540.2 MB | 92.7 MB |
| Events in quadrant A | 6,107,131 | 656,053 |
| Events in quadrant B | 3,574,520 | 685,044 |
| Events in quadrant C | 2,693,092 | 669,349 |
| Events in quadrant D | 8,110,755 | 498,379 |
| Mode SS | |||
|---|---|---|---|
| Quadrant | BADHDUFLAG | Total packets | Discarded packets |
| A | 0 | 126 | 0 |
| B | 0 | 126 | 0 |
| C | 0 | 126 | 0 |
| D | 0 | 126 | 0 |
| Mode M0 | |||
|---|---|---|---|
| Quadrant | BADHDUFLAG | Total packets | Discarded packets |
| A | 0 | 22818 | 1 |
| B | 0 | 14913 | 1 |
| C | 0 | 12715 | 1 |
| D | 0 | 28445 | 1 |
| Mode M9 | |||
|---|---|---|---|
| Quadrant | BADHDUFLAG | Total packets | Discarded packets |
| A | 0 | 10 | 0 |
| B | 0 | 10 | 0 |
| C | 0 | 10 | 0 |
| D | 0 | 10 | 0 |
| Quadrant | Total seconds | Saturated seconds | Saturation percentage |
|---|---|---|---|
| A | 6238 | 440 | 7.053543% |
| B | 6239 | 175 | 2.804937% |
| C | 6239 | 29 | 0.464818% |
| D | 6239 | 1449 | 23.224876% |
Noise dominated data is calculated using 1-second bins in cleaned event files. If a bin has >2000 counts, and if more than 50% of those come from <1% of pixels, then it is considered to be noise-dominated and hence unusable.
| Quadrant | # 1 sec bins | Bins with >0 counts | Bins with >2000 counts | High rate bins dominated by noise | Noise dominated (total time) | Noise dominated (detector-on time) | Marked lightcurve |
|---|---|---|---|---|---|---|---|
| A | 7263 | 6239 | 275 | 275 | 3.79% | 4.41% | 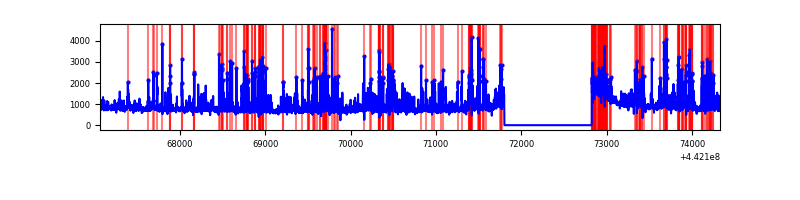 |
| B | 7264 | 6240 | 85 | 85 | 1.17% | 1.36% | 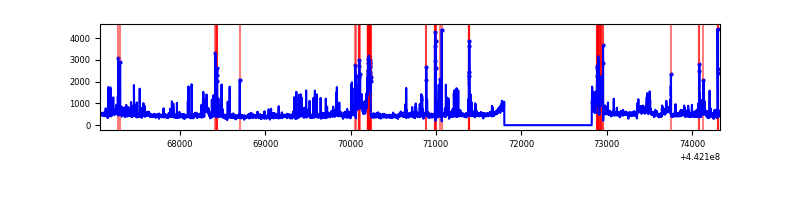 |
| C | 7264 | 6240 | 0 | 0 | 0.00% | 0.00% | 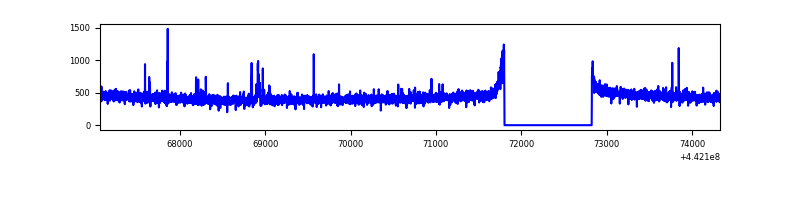 |
| D | 7264 | 6240 | 1291 | 1291 | 17.77% | 20.69% | 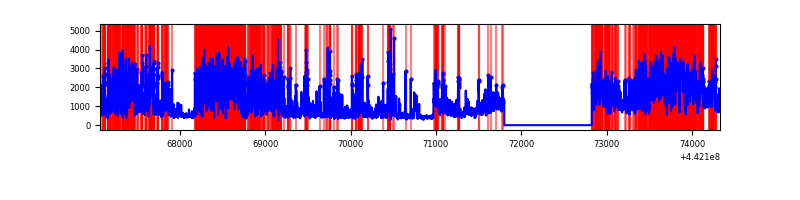 |
Top three noisy pixels from each quadrant. If the there are fewer than three noisy pixels in the level2.evt file, extra rows are filled as -1
| Pixel properties | Quadrant properties | ||||||
|---|---|---|---|---|---|---|---|
| Quadrant | DetID | PixID | Counts | Sigma | Mean | Median | Sigma |
| A | 10 | 83 | 1867731 | 13290.02 | 672 | 657 | 140.5 |
| A | 15 | 223 | 1568293 | 11158.59 | 672 | 657 | 140.5 |
| A | 13 | 248 | 38440 | 268.94 | 672 | 657 | 140.5 |
| B | 0 | 189 | 520772 | 3867.12 | 677 | 656 | 134.5 |
| B | 15 | 36 | 111907 | 827.16 | 677 | 656 | 134.5 |
| B | 15 | 201 | 76156 | 561.35 | 677 | 656 | 134.5 |
| C | 12 | 2 | 25217 | 154.26 | 678 | 682 | 159.0 |
| C | 3 | 233 | 7926 | 45.55 | 678 | 682 | 159.0 |
| C | 1 | 3 | 6180 | 34.57 | 678 | 682 | 159.0 |
| D | 1 | 52 | 3515138 | 22035.47 | 626 | 606 | 159.5 |
| D | 13 | 249 | 1014052 | 6354.12 | 626 | 606 | 159.5 |
| D | 13 | 174 | 436387 | 2732.27 | 626 | 606 | 159.5 |
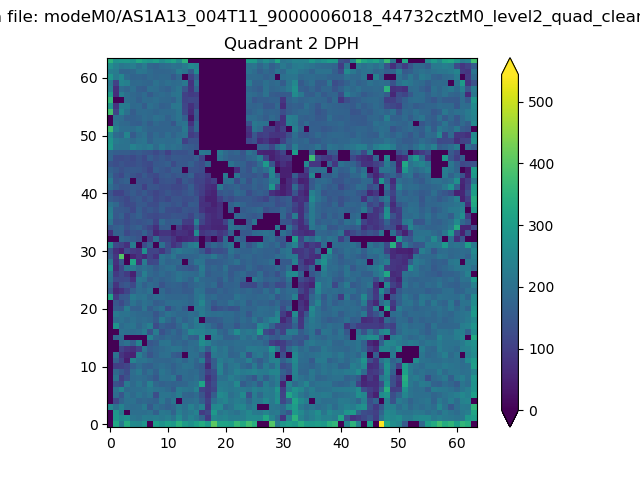
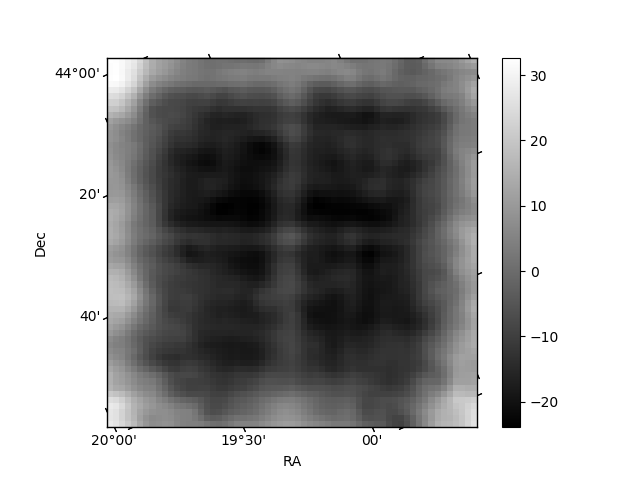
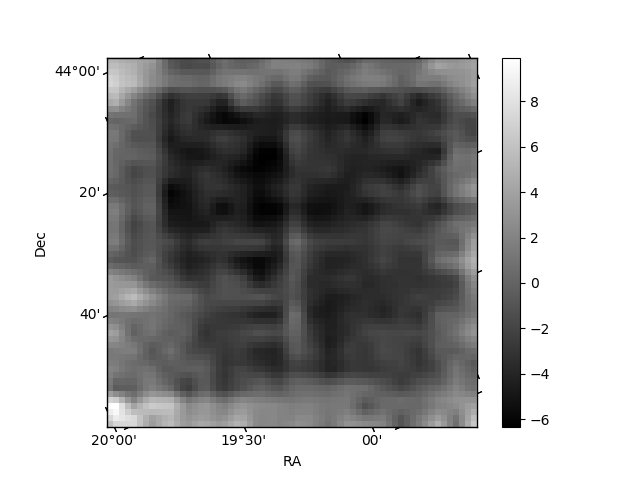
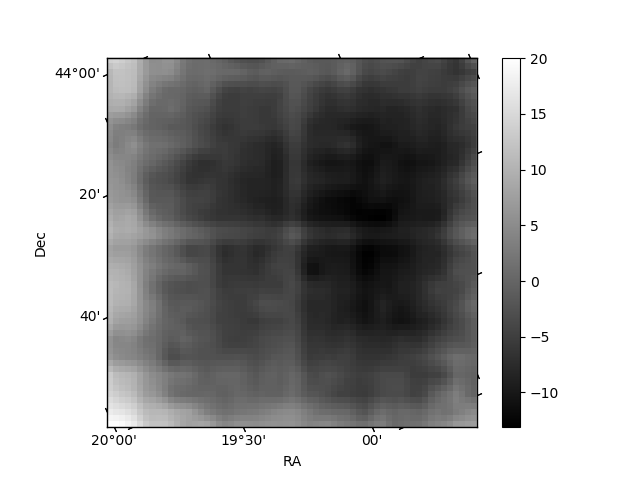
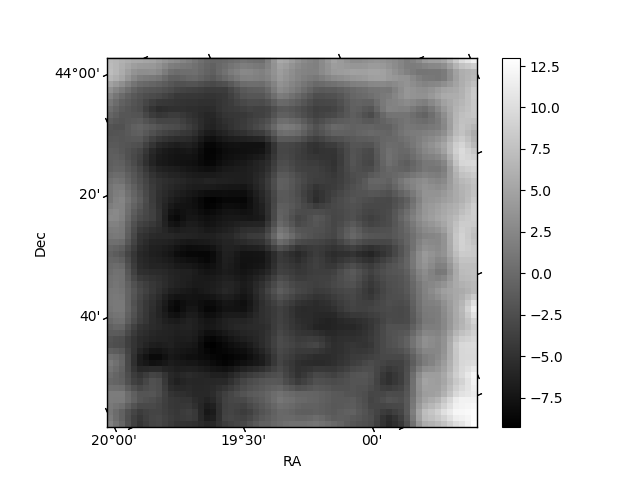
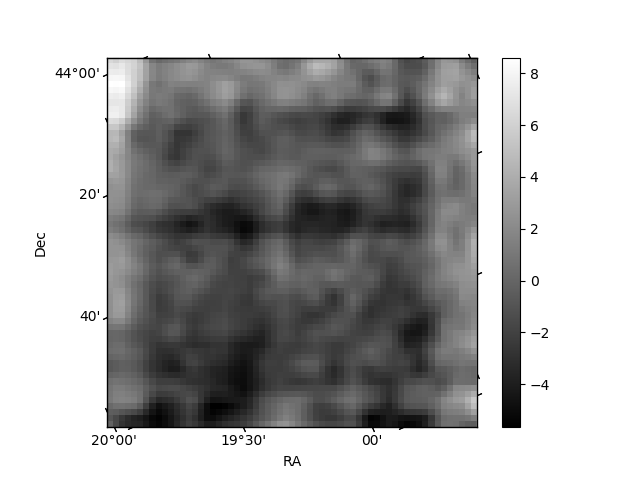
Histogram calculated using DETX and DETY for each event in the final _common_clean file
| Quadrant A | 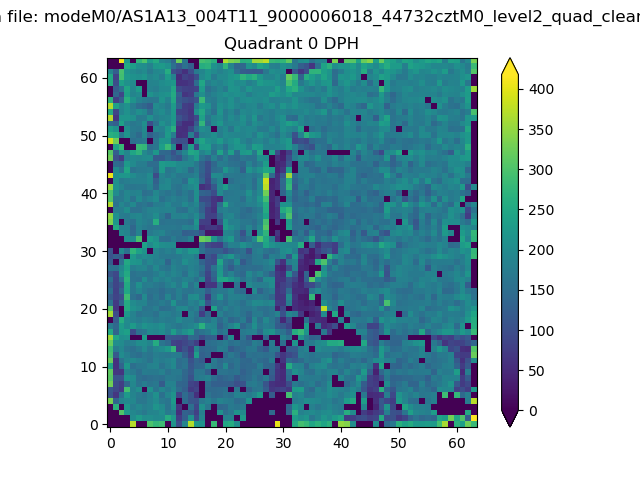 |
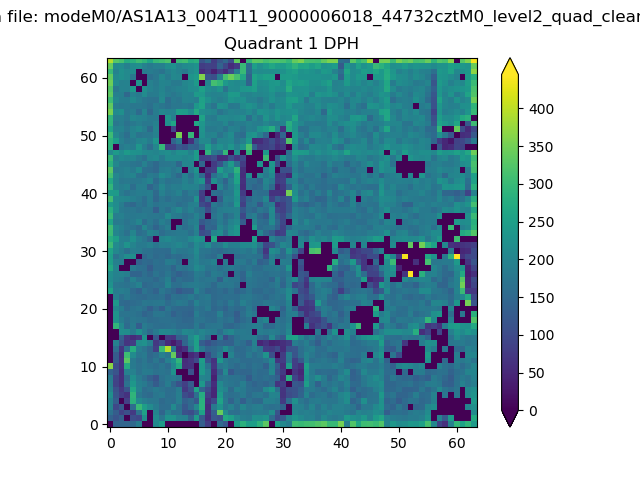 |
Quadrant B |
|---|---|---|---|
| Quadrant D | 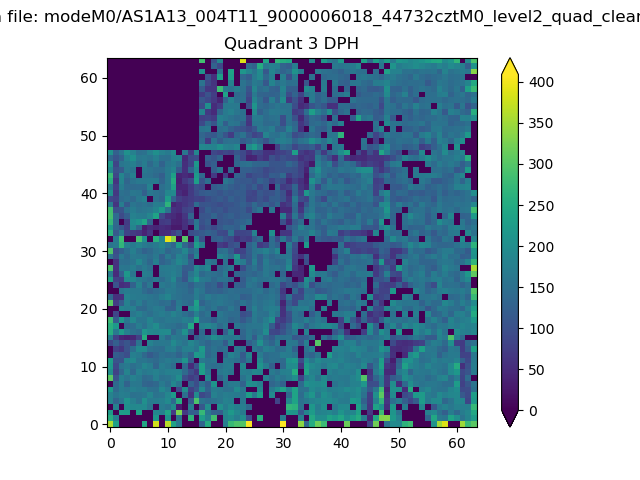 |
 |
Quadrant C |
| Plot type | Count rate plots | Images |
|---|---|---|
| Comparison with Poisson distribution Blue bars denote a histogram of data divided into 1 sec bins. Red curve is a Poisson curve with rate = median count rate of data. |
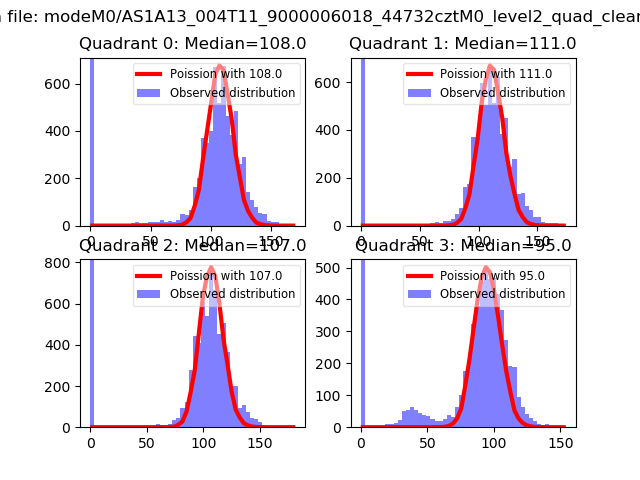 |
 |
| Quadrant-wise count rates Data is divided into 100 sec bins |
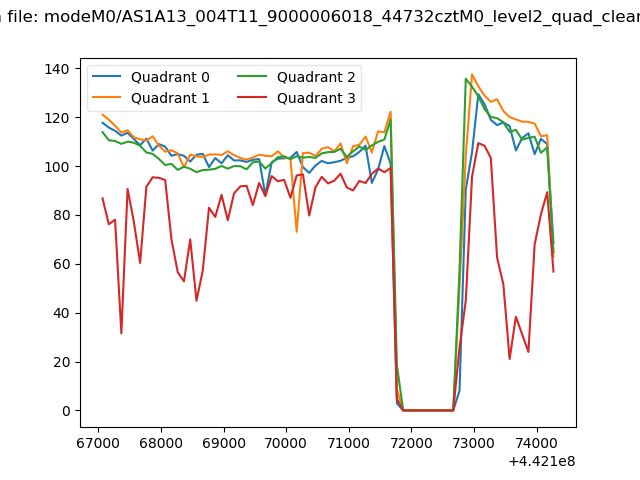 |
|
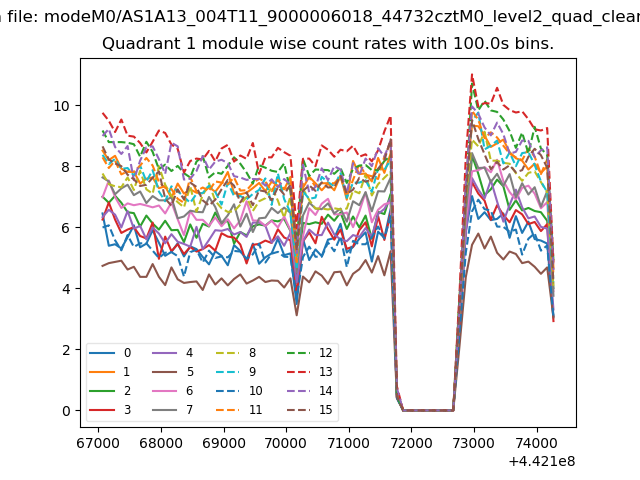
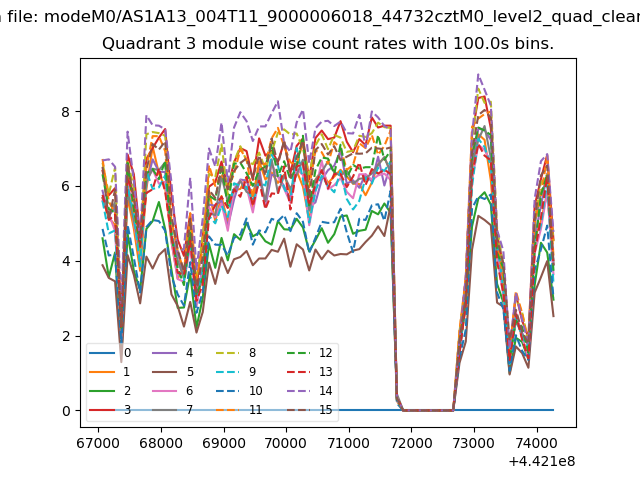
| Module-wise count rates for Quadrant A Data is divided into 100 sec bins |
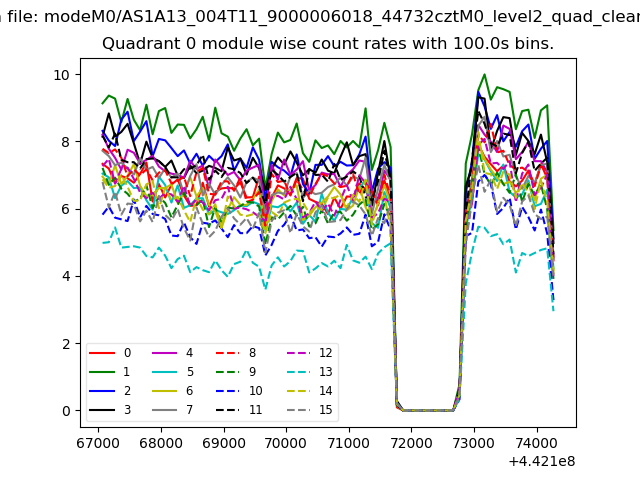 |
 |
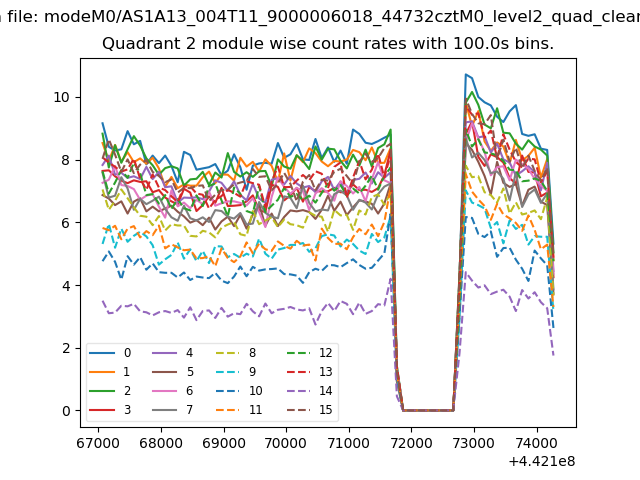
| Module-wise count rates for Quadrant B Data is divided into 100 sec bins |
 |
 |
| Module-wise count rates for Quadrant C Data is divided into 100 sec bins |
 |
 |
| Module-wise count rates for Quadrant D Data is divided into 100 sec bins |
 |
 |
| Parameter | Plot |
|---|---|
| CZT HV Monitor | 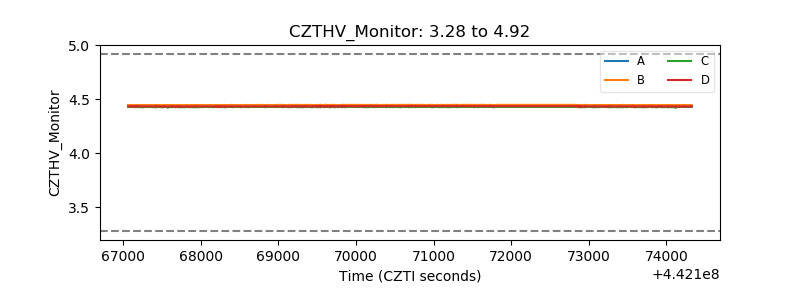 |
| D_VDD | 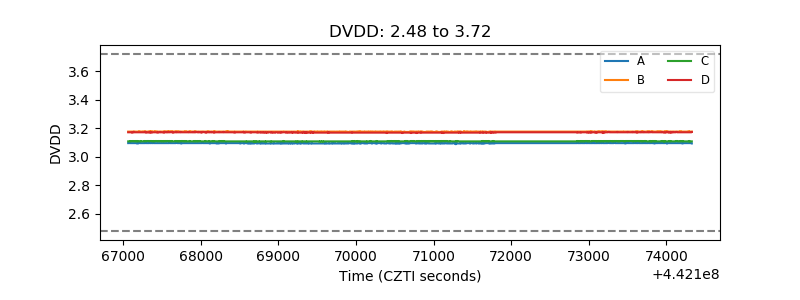 |
| Temperature 1 | 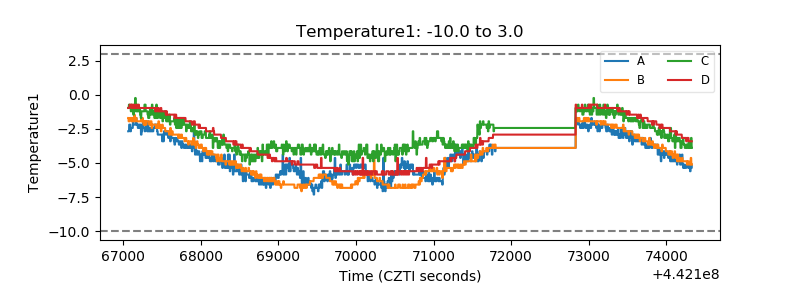 |
| Veto HV Monitor |  |
| Veto LLD | 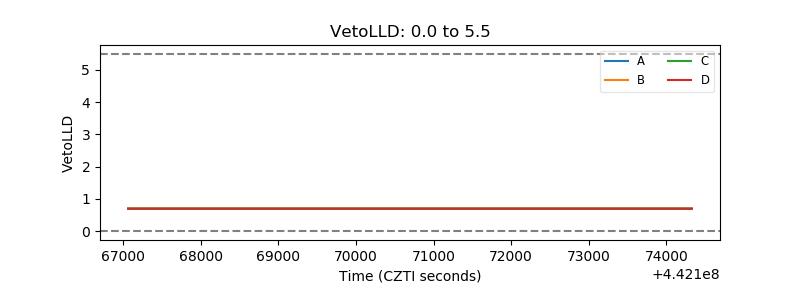 |
| Alpha Counter | 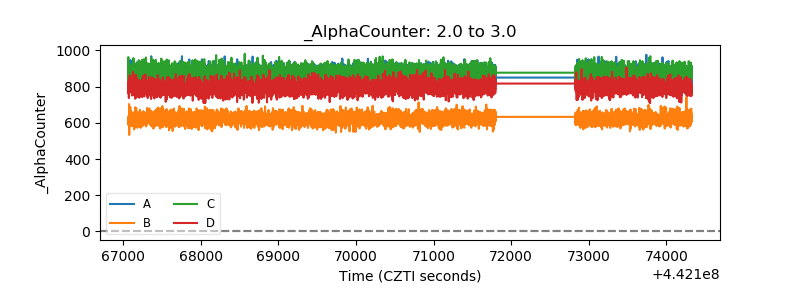 |
| _CPM_Rate | 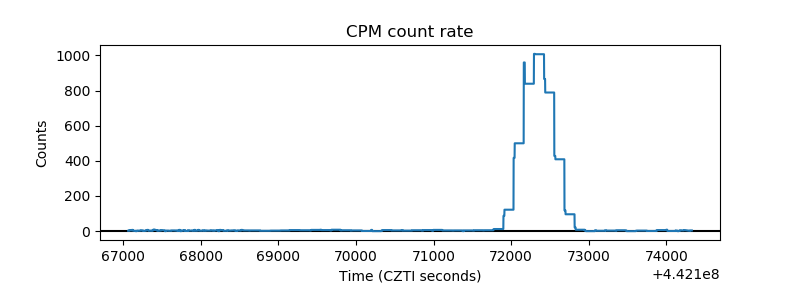 |
| CZT Counter | 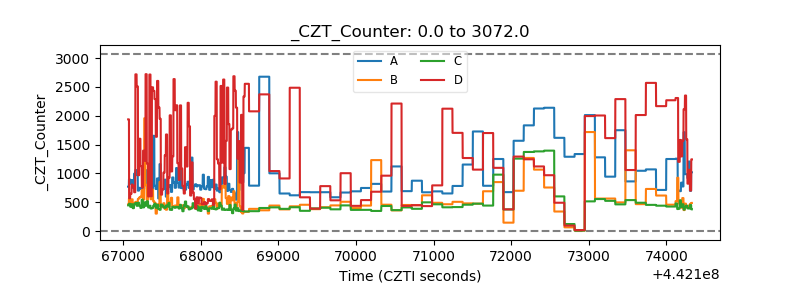 |
| +2.5 Volts monitor | 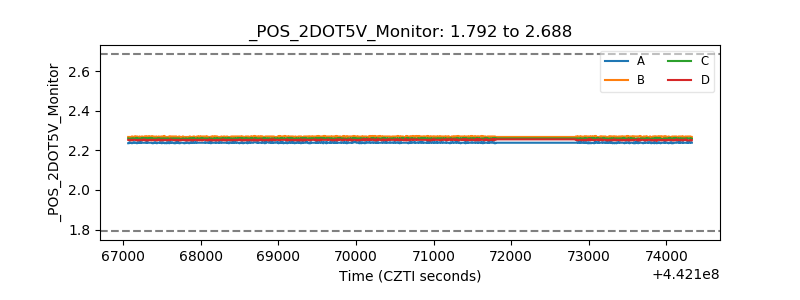 |
| +5 Volts monitor | 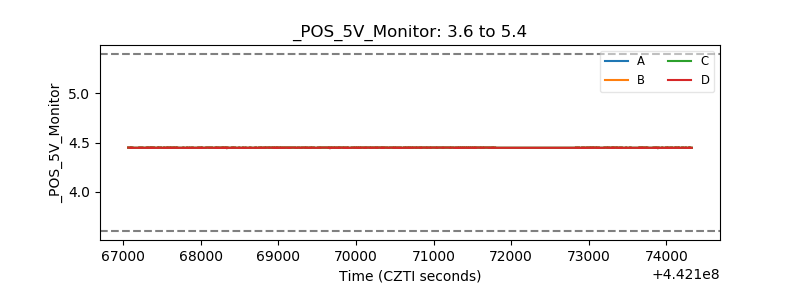 |
| _ROLL_ROT | 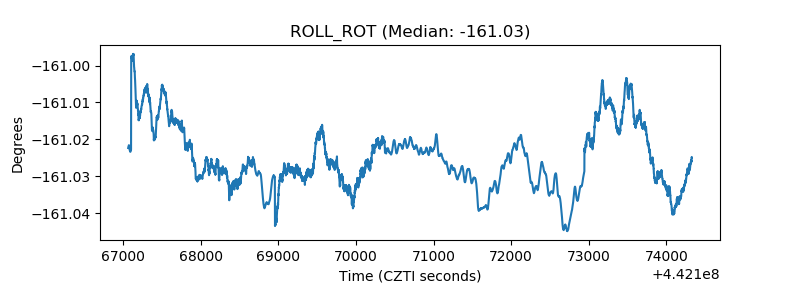 |
| _Roll_DEC | 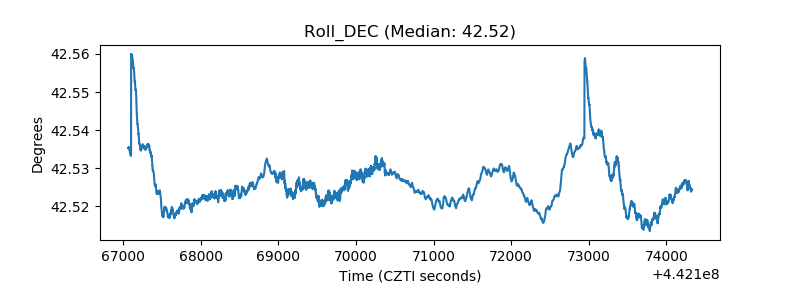 |
| _Roll_RA | 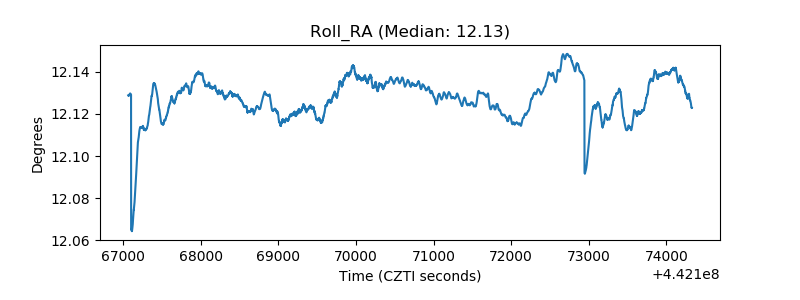 |
| Veto Counter | 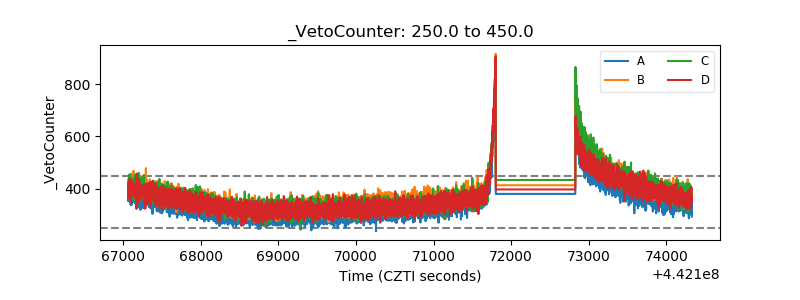 |