| Param | Original file | Final file |
|---|---|---|
| Filename | modeM0/AS1A13_004T11_9000006018_44733cztM0_level2.fits | modeM0/AS1A13_004T11_9000006018_44733cztM0_level2_quad_clean.evt |
| Size (bytes) | 602,233,920 | 103,296,960 |
| Size | 574.3 MB | 98.5 MB |
| Events in quadrant A | 6,240,731 | 702,488 |
| Events in quadrant B | 3,625,499 | 741,030 |
| Events in quadrant C | 2,877,637 | 723,079 |
| Events in quadrant D | 9,050,323 | 512,049 |
| Mode SS | |||
|---|---|---|---|
| Quadrant | BADHDUFLAG | Total packets | Discarded packets |
| A | 0 | 130 | 0 |
| B | 0 | 130 | 0 |
| C | 0 | 130 | 0 |
| D | 0 | 130 | 0 |
| Mode M0 | |||
|---|---|---|---|
| Quadrant | BADHDUFLAG | Total packets | Discarded packets |
| A | 0 | 23513 | 2 |
| B | 0 | 15120 | 2 |
| C | 0 | 13236 | 2 |
| D | 0 | 31395 | 3 |
| Mode M9 | |||
|---|---|---|---|
| Quadrant | BADHDUFLAG | Total packets | Discarded packets |
| A | 0 | 14 | 0 |
| B | 0 | 14 | 0 |
| C | 0 | 15 | 0 |
| D | 0 | 15 | 0 |
| Quadrant | Total seconds | Saturated seconds | Saturation percentage |
|---|---|---|---|
| A | 6436 | 461 | 7.162834% |
| B | 6436 | 163 | 2.532629% |
| C | 6436 | 34 | 0.528278% |
| D | 6435 | 1685 | 26.184926% |
Noise dominated data is calculated using 1-second bins in cleaned event files. If a bin has >2000 counts, and if more than 50% of those come from <1% of pixels, then it is considered to be noise-dominated and hence unusable.
| Quadrant | # 1 sec bins | Bins with >0 counts | Bins with >2000 counts | High rate bins dominated by noise | Noise dominated (total time) | Noise dominated (detector-on time) | Marked lightcurve |
|---|---|---|---|---|---|---|---|
| A | 7581 | 6437 | 279 | 279 | 3.68% | 4.33% | 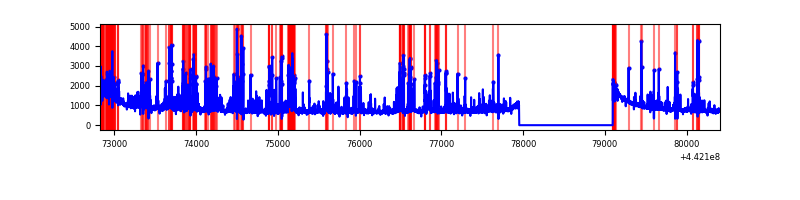 |
| B | 7581 | 6437 | 73 | 73 | 0.96% | 1.13% | 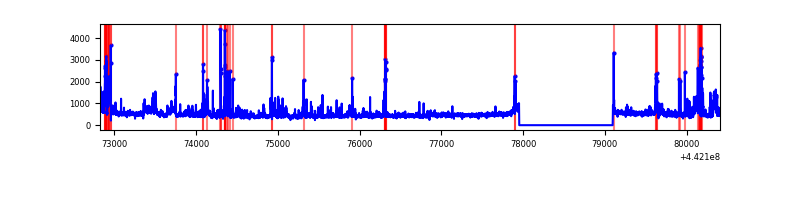 |
| C | 7581 | 6437 | 1 | 1 | 0.01% | 0.02% | 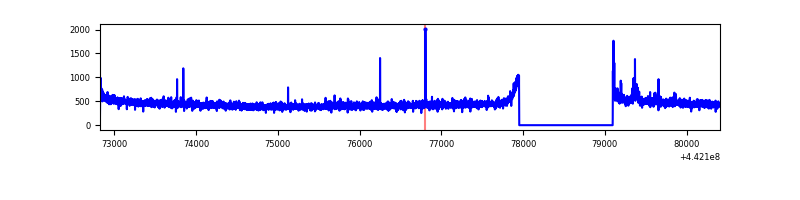 |
| D | 7580 | 6436 | 1474 | 1474 | 19.45% | 22.90% | 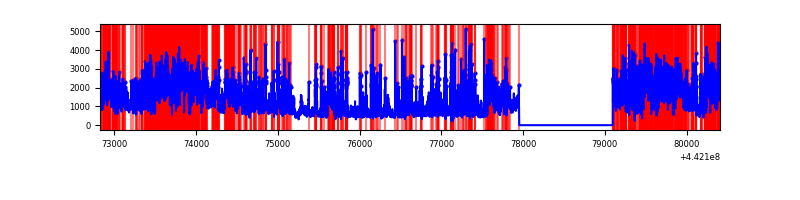 |
Top three noisy pixels from each quadrant. If the there are fewer than three noisy pixels in the level2.evt file, extra rows are filled as -1
| Pixel properties | Quadrant properties | ||||||
|---|---|---|---|---|---|---|---|
| Quadrant | DetID | PixID | Counts | Sigma | Mean | Median | Sigma |
| A | 10 | 83 | 2083813 | 14046.49 | 713 | 697 | 148.3 |
| A | 15 | 223 | 1314301 | 8857.66 | 713 | 697 | 148.3 |
| A | 13 | 248 | 51383 | 341.78 | 713 | 697 | 148.3 |
| B | 0 | 189 | 322693 | 2282.17 | 722 | 700 | 141.1 |
| B | 0 | 219 | 160887 | 1135.35 | 722 | 700 | 141.1 |
| B | 15 | 36 | 102402 | 720.83 | 722 | 700 | 141.1 |
| C | 12 | 2 | 30607 | 178.09 | 722 | 727 | 167.8 |
| C | 1 | 3 | 11634 | 65.01 | 722 | 727 | 167.8 |
| C | 3 | 233 | 9462 | 52.06 | 722 | 727 | 167.8 |
| D | 1 | 52 | 4139116 | 24868.68 | 654 | 633 | 166.4 |
| D | 13 | 249 | 980735 | 5889.56 | 654 | 633 | 166.4 |
| D | 5 | 222 | 522824 | 3137.91 | 654 | 633 | 166.4 |
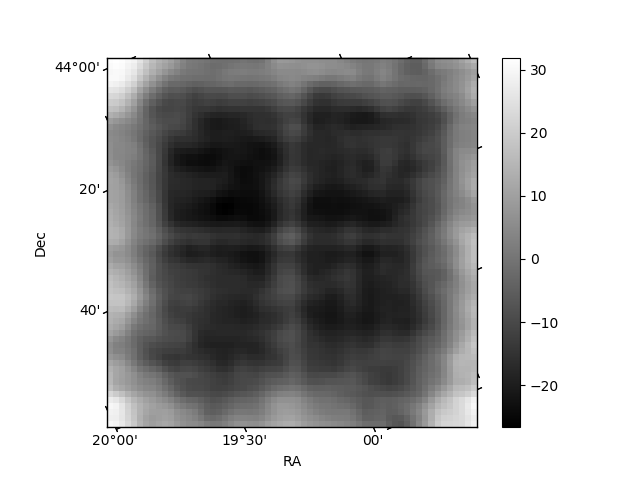
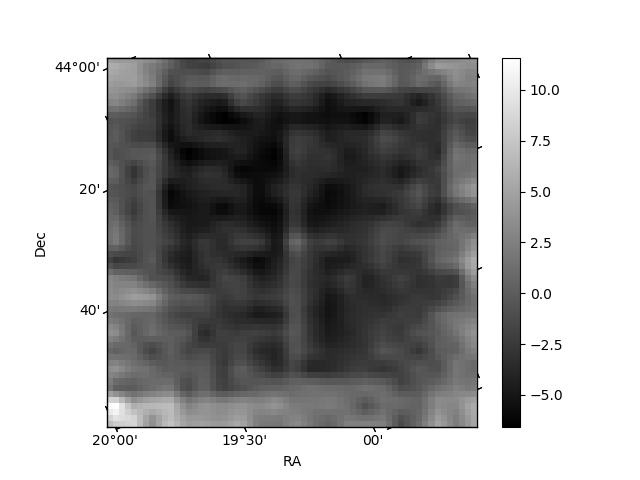
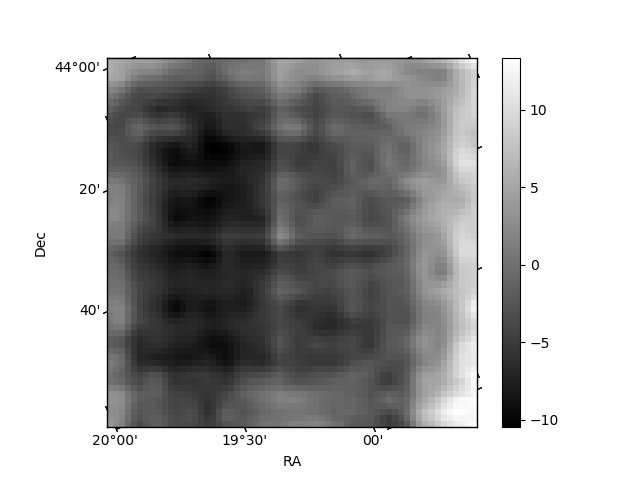
Histogram calculated using DETX and DETY for each event in the final _common_clean file
| Quadrant A | 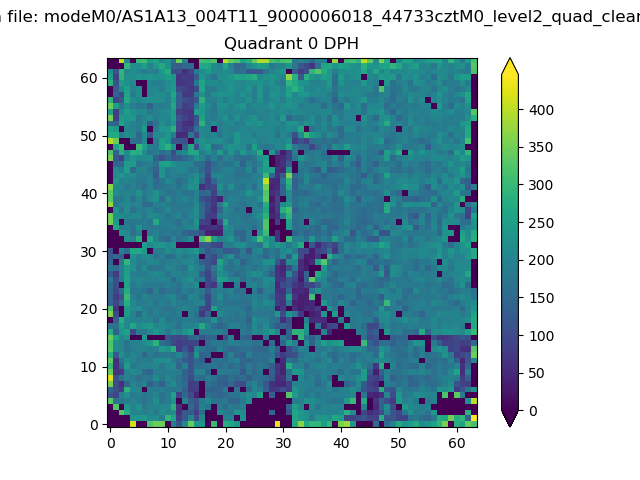 |
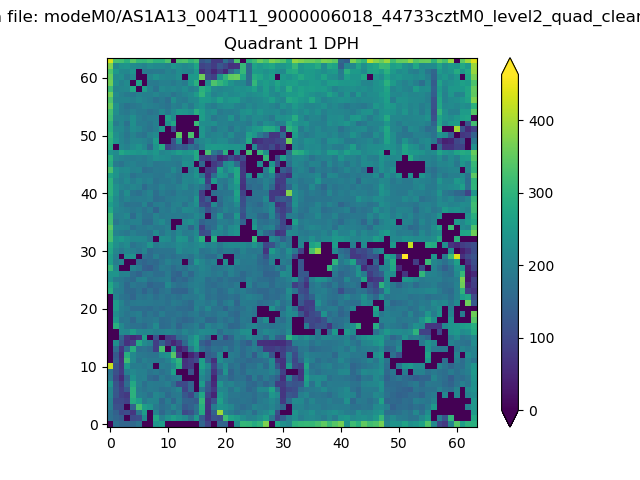 |
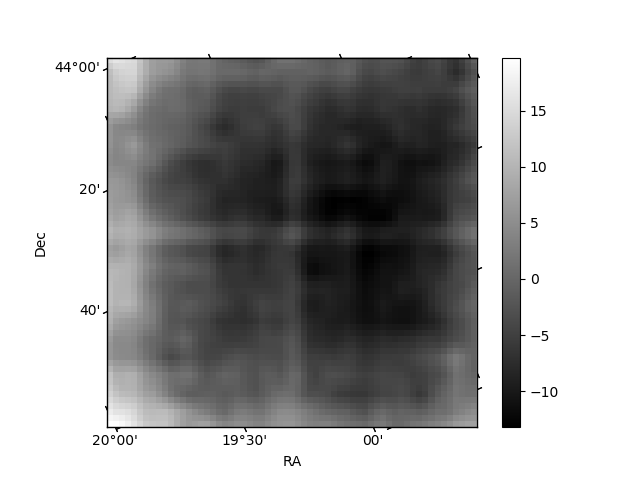
Quadrant B |
|---|---|---|---|
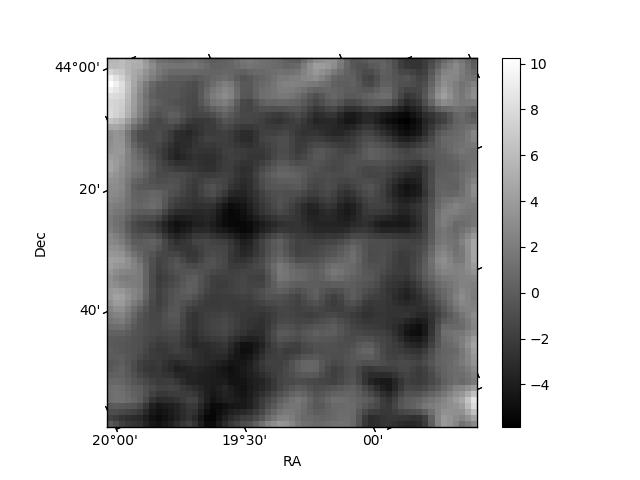
| Quadrant D | 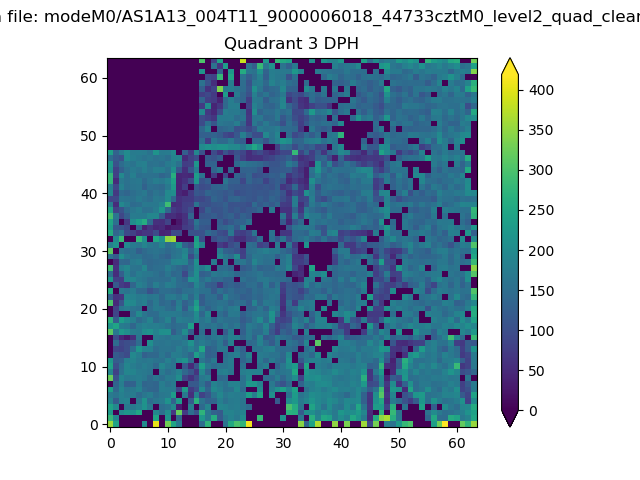 |
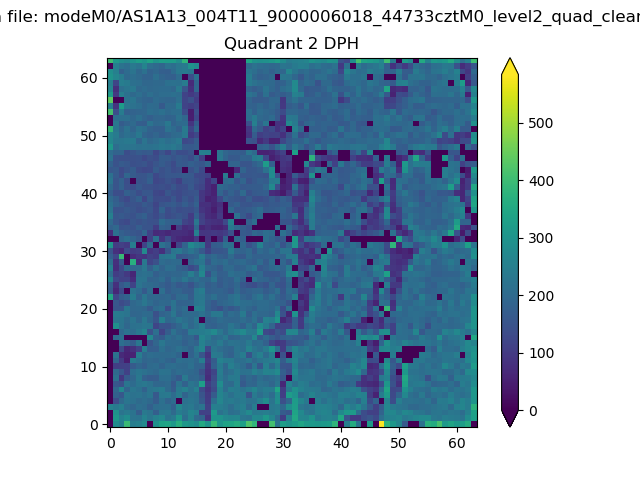 |
Quadrant C |
| Plot type | Count rate plots | Images |
|---|---|---|
| Comparison with Poisson distribution Blue bars denote a histogram of data divided into 1 sec bins. Red curve is a Poisson curve with rate = median count rate of data. |
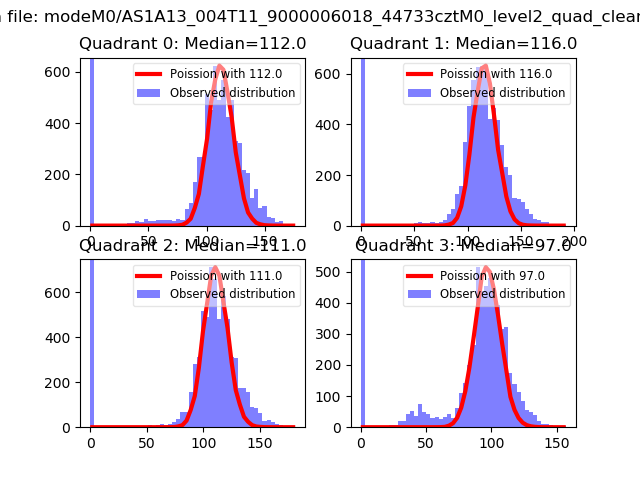 |
 |
| Quadrant-wise count rates Data is divided into 100 sec bins |
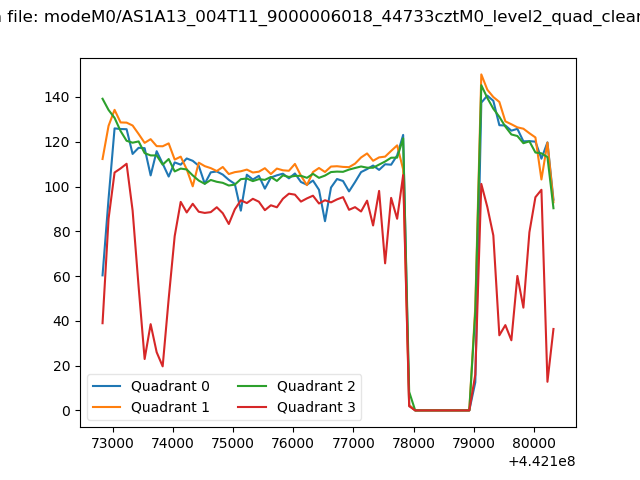 |
|
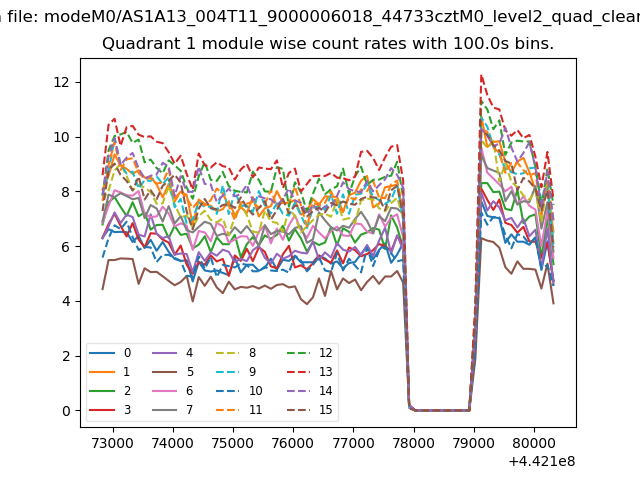
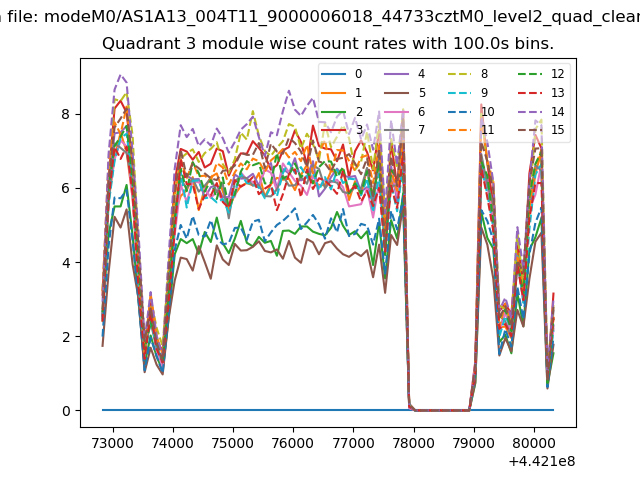
| Module-wise count rates for Quadrant A Data is divided into 100 sec bins |
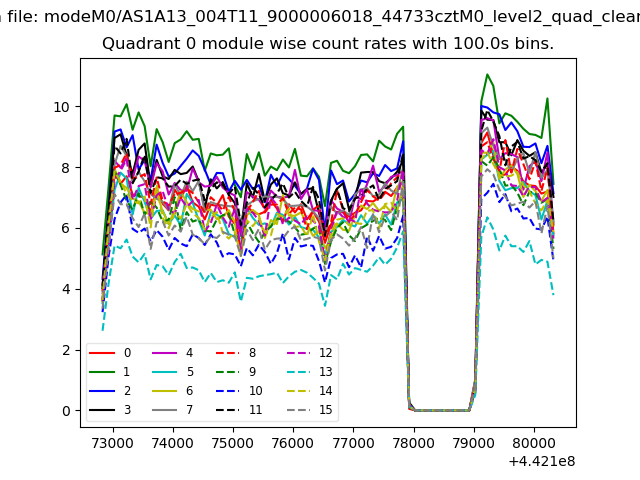 |
 |
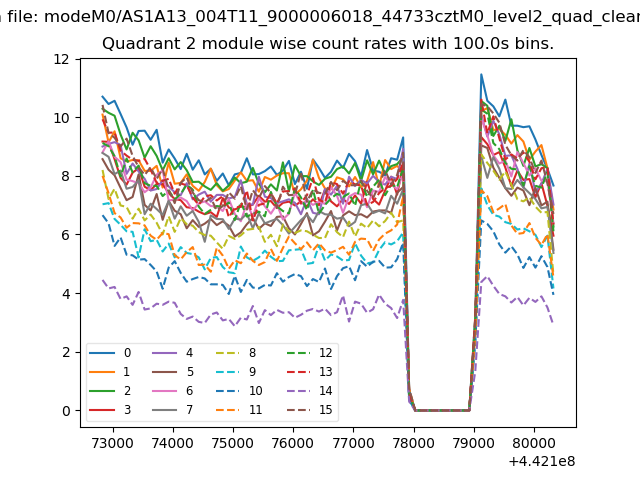
| Module-wise count rates for Quadrant B Data is divided into 100 sec bins |
 |
 |
| Module-wise count rates for Quadrant C Data is divided into 100 sec bins |
 |
 |
| Module-wise count rates for Quadrant D Data is divided into 100 sec bins |
 |
 |
| Parameter | Plot |
|---|---|
| CZT HV Monitor | 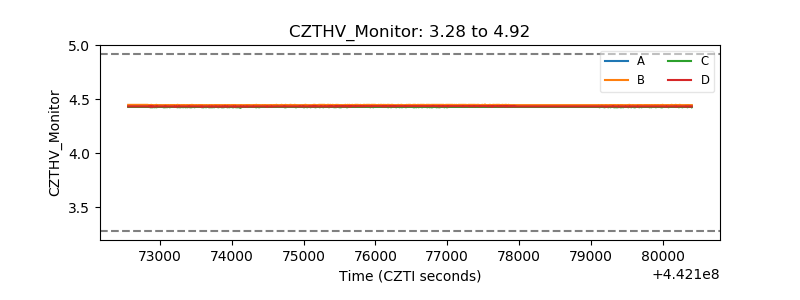 |
| D_VDD | 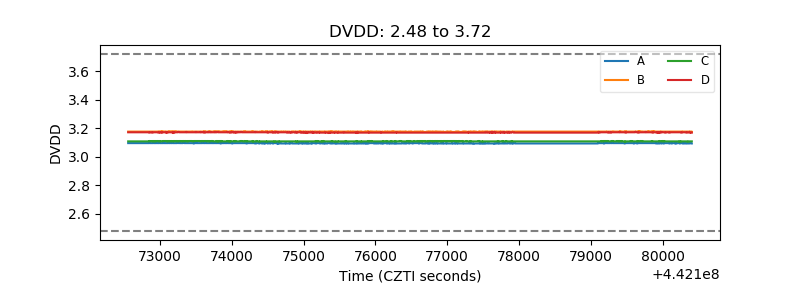 |
| Temperature 1 | 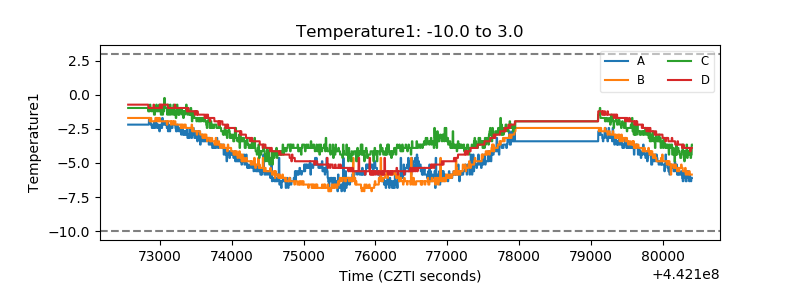 |
| Veto HV Monitor | 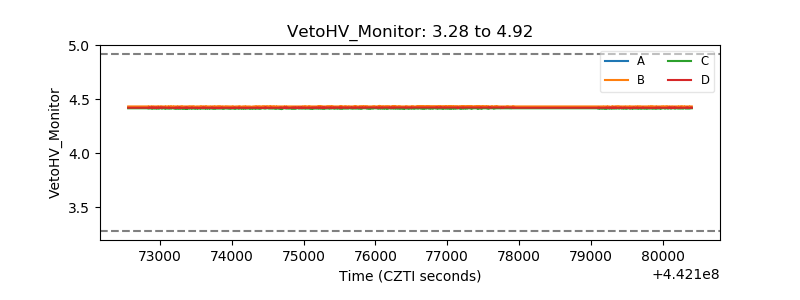 |
| Veto LLD | 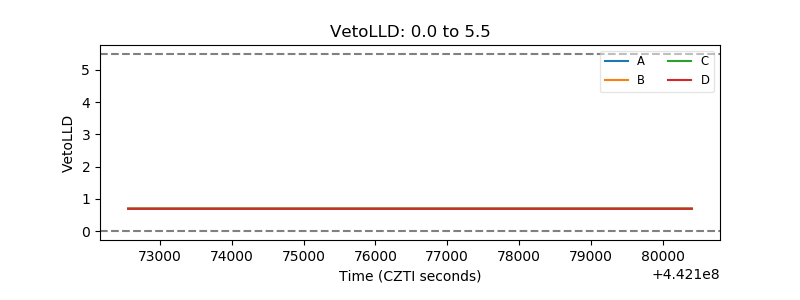 |
| Alpha Counter | 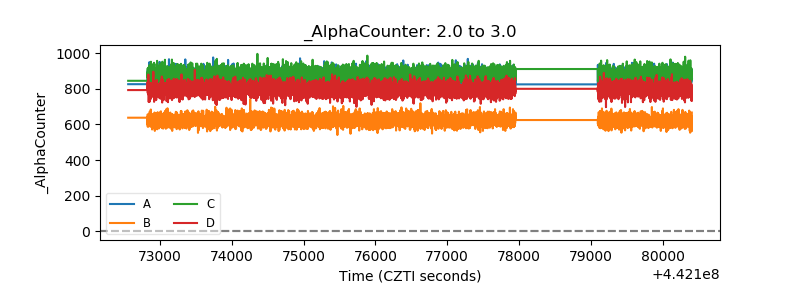 |
| _CPM_Rate | 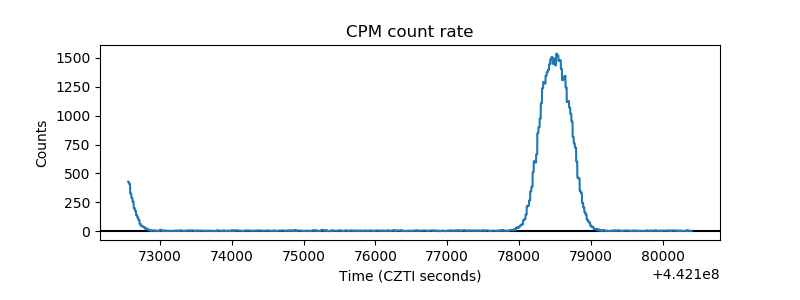 |
| CZT Counter | 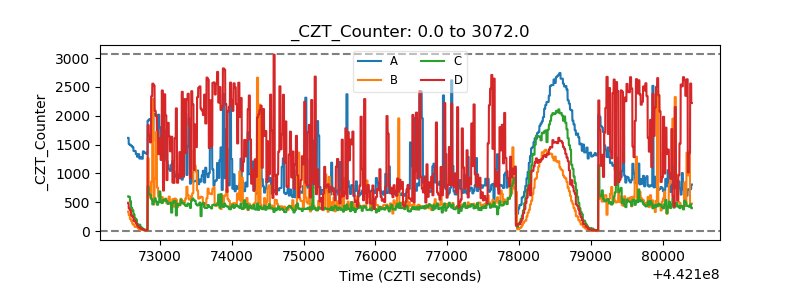 |
| +2.5 Volts monitor | 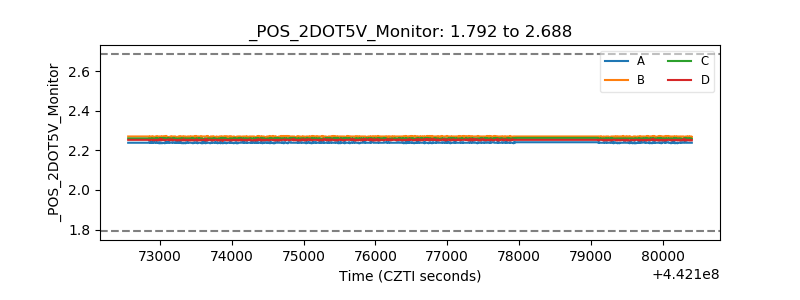 |
| +5 Volts monitor | 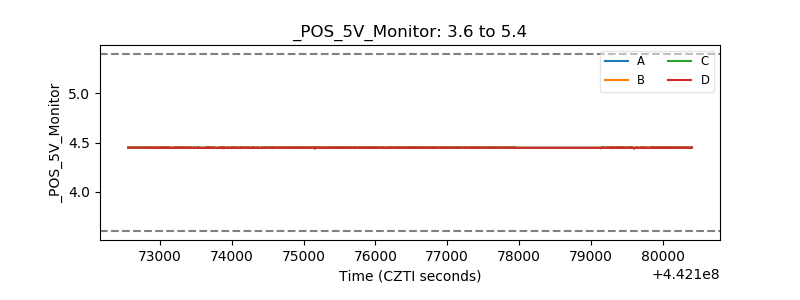 |
| _ROLL_ROT | 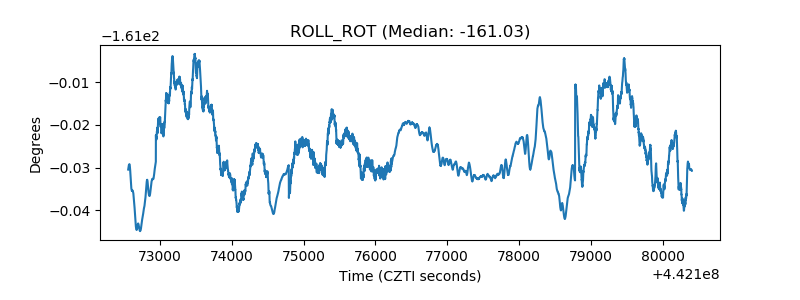 |
| _Roll_DEC | 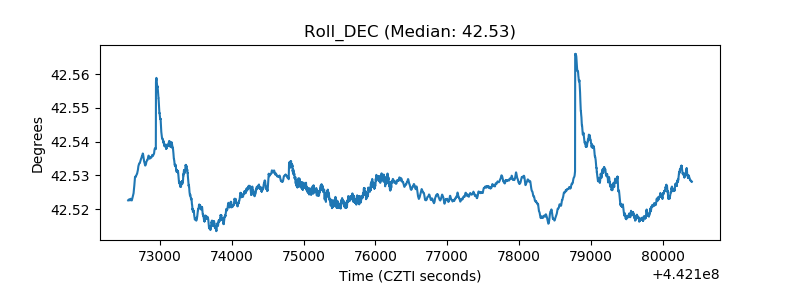 |
| _Roll_RA | 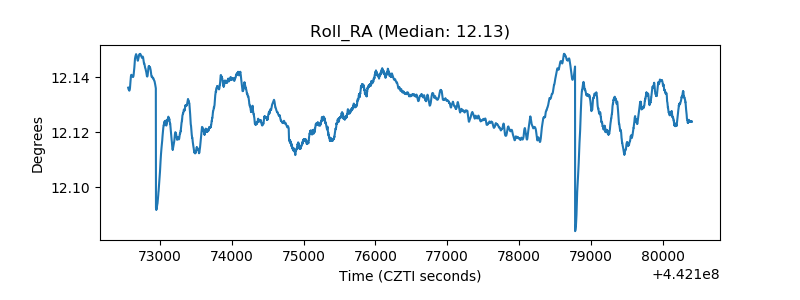 |
| Veto Counter | 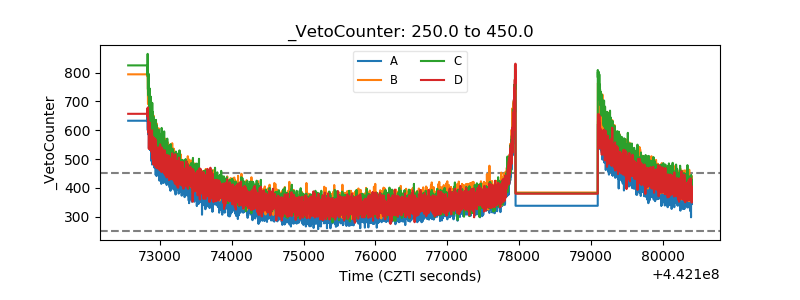 |