| Param | Original file | Final file |
|---|---|---|
| Filename | modeM0/AS1A13_004T11_9000006018_44734cztM0_level2.fits | modeM0/AS1A13_004T11_9000006018_44734cztM0_level2_quad_clean.evt |
| Size (bytes) | 594,861,120 | 104,042,880 |
| Size | 567.3 MB | 99.2 MB |
| Events in quadrant A | 5,554,558 | 726,500 |
| Events in quadrant B | 3,902,186 | 739,846 |
| Events in quadrant C | 3,078,307 | 730,140 |
| Events in quadrant D | 8,992,697 | 510,780 |
| Mode SS | |||
|---|---|---|---|
| Quadrant | BADHDUFLAG | Total packets | Discarded packets |
| A | 0 | 128 | 0 |
| B | 0 | 128 | 0 |
| C | 0 | 128 | 0 |
| D | 0 | 128 | 0 |
| Mode M0 | |||
|---|---|---|---|
| Quadrant | BADHDUFLAG | Total packets | Discarded packets |
| A | 0 | 21557 | 2 |
| B | 0 | 15830 | 2 |
| C | 0 | 13655 | 3 |
| D | 0 | 31076 | 2 |
| Mode M9 | |||
|---|---|---|---|
| Quadrant | BADHDUFLAG | Total packets | Discarded packets |
| A | 0 | 15 | 0 |
| B | 0 | 16 | 0 |
| C | 0 | 16 | 0 |
| D | 0 | 16 | 0 |
| Quadrant | Total seconds | Saturated seconds | Saturation percentage |
|---|---|---|---|
| A | 6350 | 224 | 3.527559% |
| B | 6350 | 294 | 4.629921% |
| C | 6349 | 82 | 1.291542% |
| D | 6349 | 1808 | 28.476926% |
Noise dominated data is calculated using 1-second bins in cleaned event files. If a bin has >2000 counts, and if more than 50% of those come from <1% of pixels, then it is considered to be noise-dominated and hence unusable.
| Quadrant | # 1 sec bins | Bins with >0 counts | Bins with >2000 counts | High rate bins dominated by noise | Noise dominated (total time) | Noise dominated (detector-on time) | Marked lightcurve |
|---|---|---|---|---|---|---|---|
| A | 7555 | 6351 | 100 | 100 | 1.32% | 1.57% | 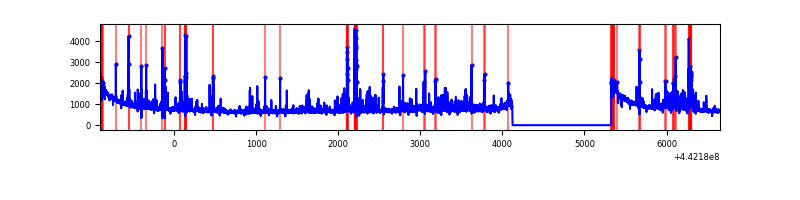 |
| B | 7555 | 6351 | 167 | 167 | 2.21% | 2.63% | 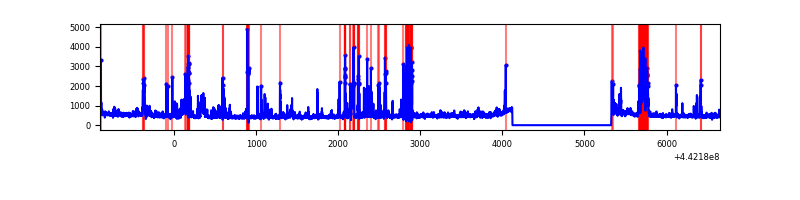 |
| C | 7554 | 6350 | 58 | 58 | 0.77% | 0.91% | 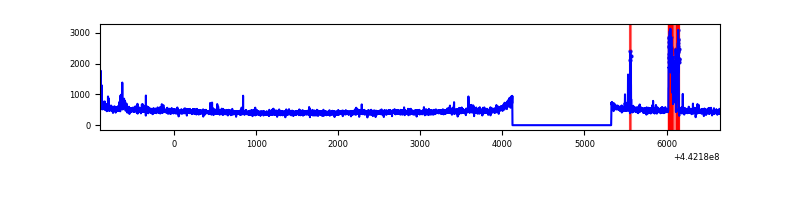 |
| D | 7554 | 6350 | 1637 | 1637 | 21.67% | 25.78% | 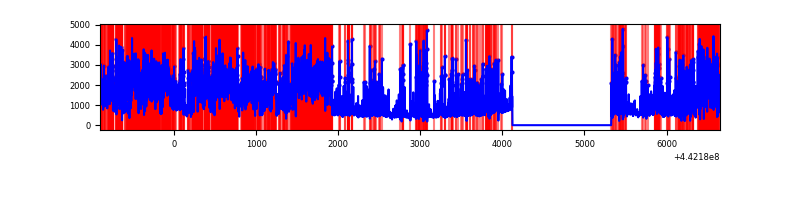 |
Top three noisy pixels from each quadrant. If the there are fewer than three noisy pixels in the level2.evt file, extra rows are filled as -1
| Pixel properties | Quadrant properties | ||||||
|---|---|---|---|---|---|---|---|
| Quadrant | DetID | PixID | Counts | Sigma | Mean | Median | Sigma |
| A | 10 | 83 | 2047987 | 13876.53 | 717 | 700 | 147.5 |
| A | 15 | 223 | 701256 | 4748.37 | 717 | 700 | 147.5 |
| A | 0 | 243 | 21030 | 137.8 | 717 | 700 | 147.5 |
| B | 0 | 189 | 654565 | 4694.15 | 718 | 696 | 139.3 |
| B | 0 | 190 | 112202 | 800.5 | 718 | 696 | 139.3 |
| B | 4 | 171 | 101361 | 722.68 | 718 | 696 | 139.3 |
| C | 5 | 128 | 210782 | 1255.89 | 721 | 727 | 167.3 |
| C | 12 | 2 | 27015 | 157.17 | 721 | 727 | 167.3 |
| C | 1 | 3 | 15900 | 90.72 | 721 | 727 | 167.3 |
| D | 1 | 52 | 4566210 | 28375.71 | 647 | 628 | 160.9 |
| D | 13 | 249 | 961028 | 5969.02 | 647 | 628 | 160.9 |
| D | 2 | 249 | 301450 | 1869.65 | 647 | 628 | 160.9 |
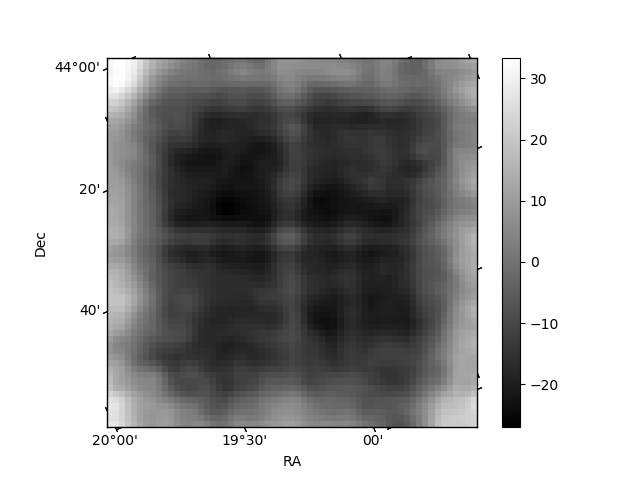
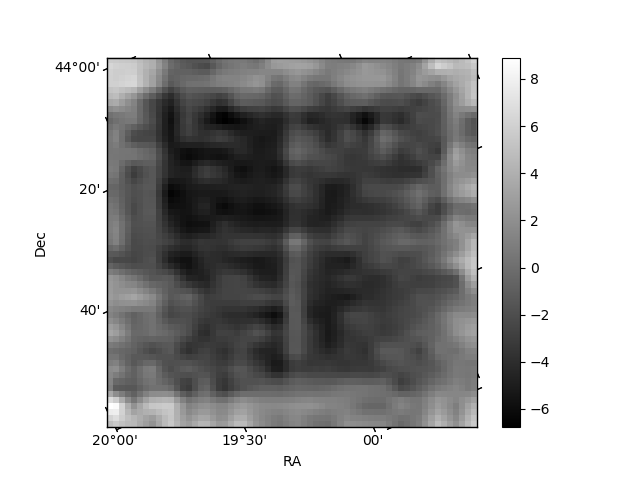
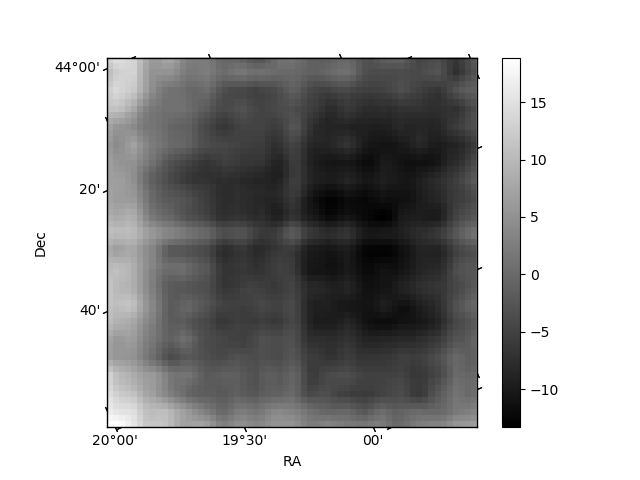
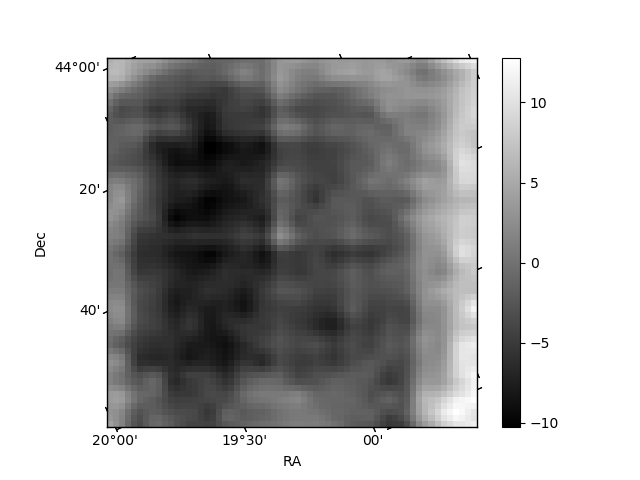
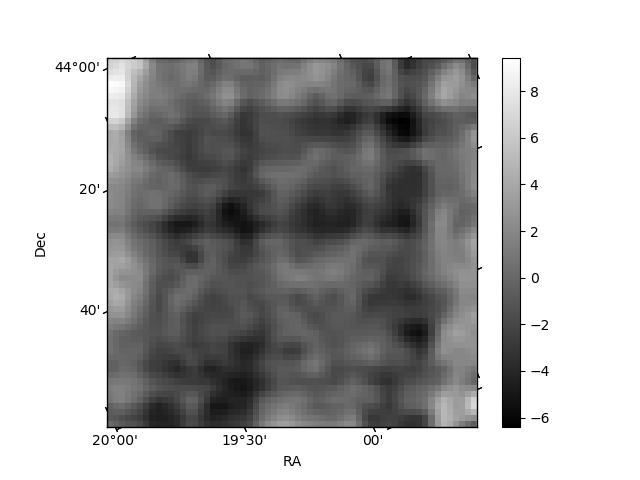
Histogram calculated using DETX and DETY for each event in the final _common_clean file
| Quadrant A | 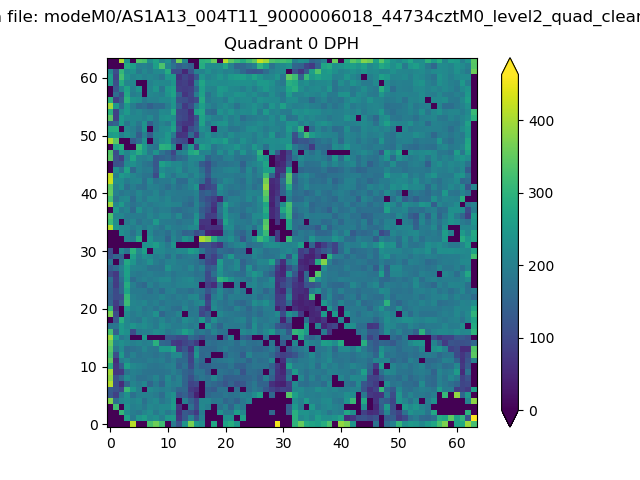 |
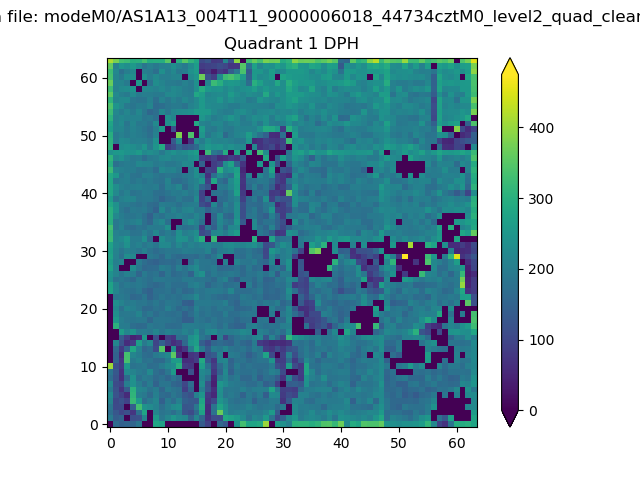 |
Quadrant B |
|---|---|---|---|
| Quadrant D | 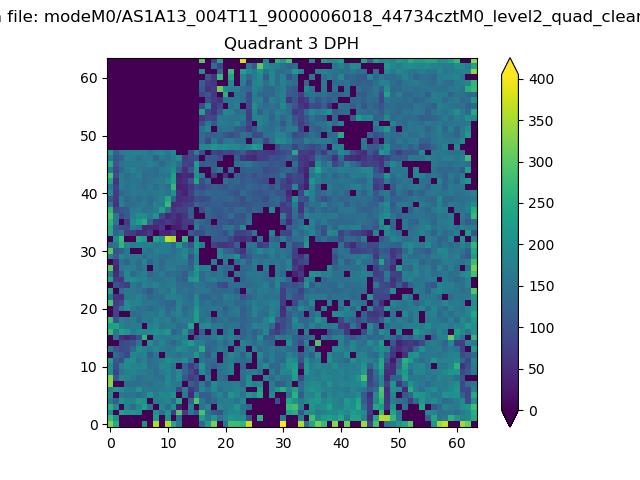 |
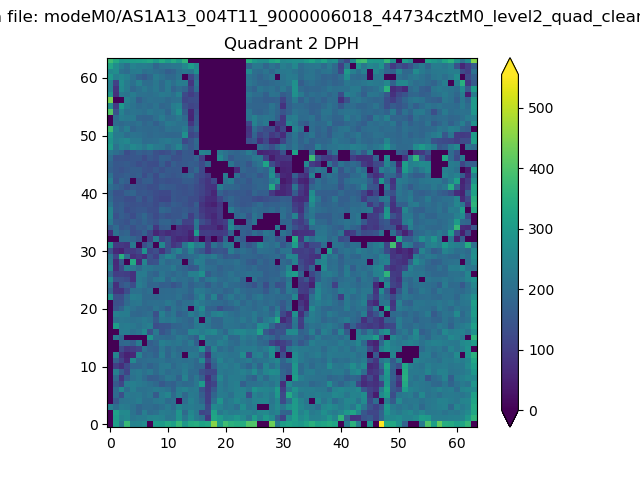 |
Quadrant C |
| Plot type | Count rate plots | Images |
|---|---|---|
| Comparison with Poisson distribution Blue bars denote a histogram of data divided into 1 sec bins. Red curve is a Poisson curve with rate = median count rate of data. |
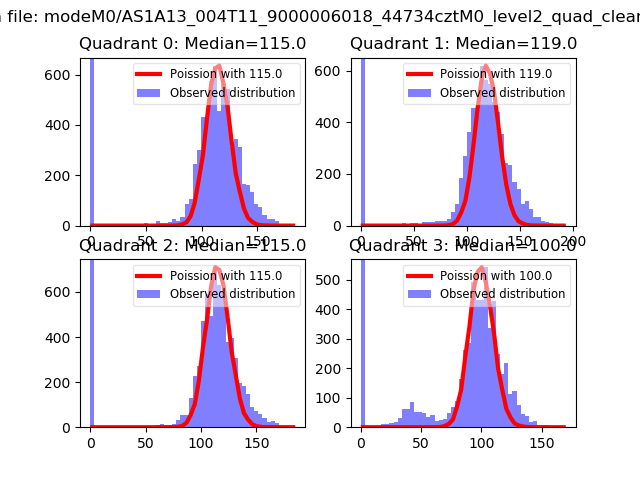 |
 |
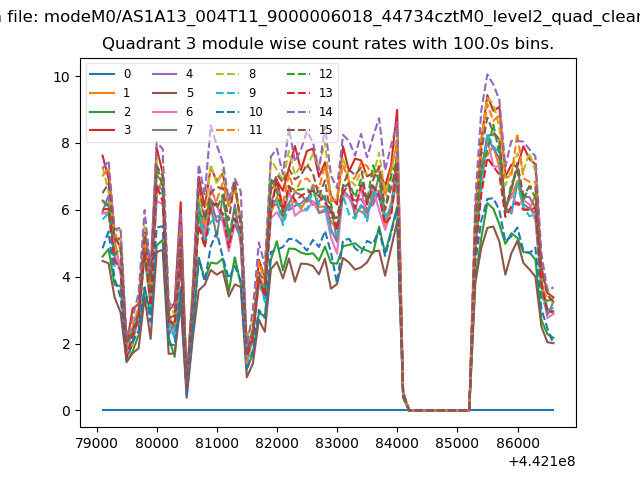
| Quadrant-wise count rates Data is divided into 100 sec bins |
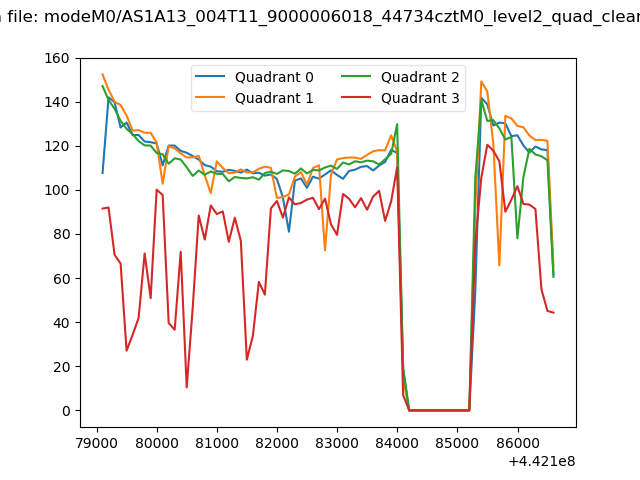 |
|
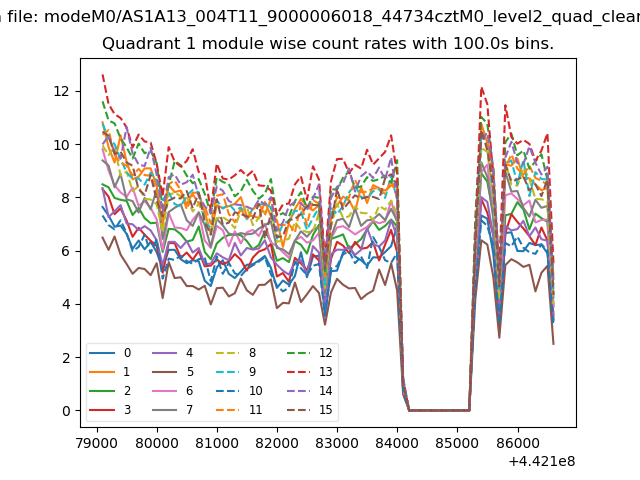
| Module-wise count rates for Quadrant A Data is divided into 100 sec bins |
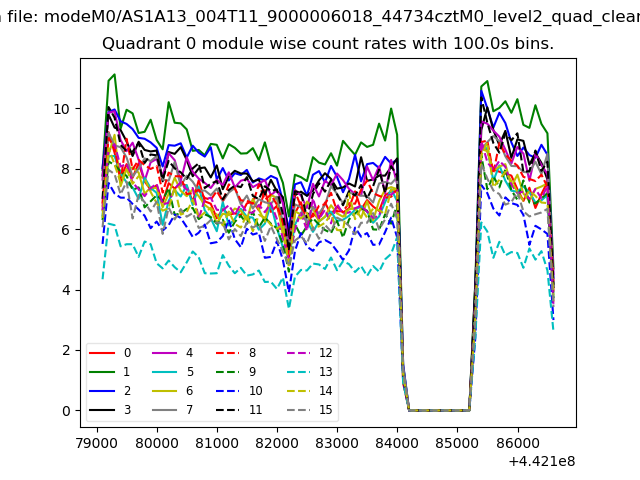 |
 |
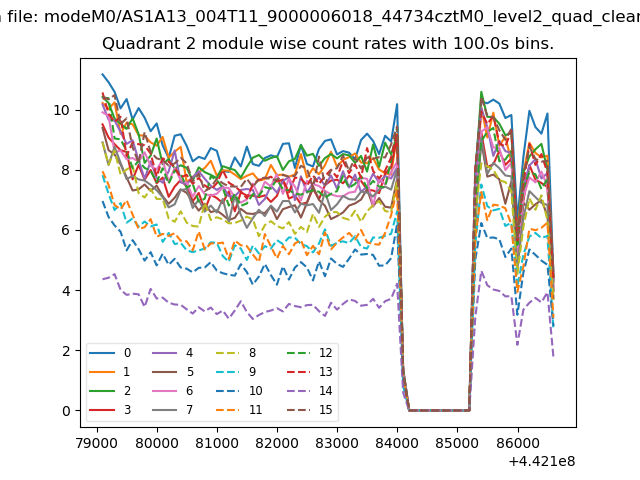
| Module-wise count rates for Quadrant B Data is divided into 100 sec bins |
 |
 |
| Module-wise count rates for Quadrant C Data is divided into 100 sec bins |
 |
 |
| Module-wise count rates for Quadrant D Data is divided into 100 sec bins |
 |
 |
| Parameter | Plot |
|---|---|
| CZT HV Monitor | 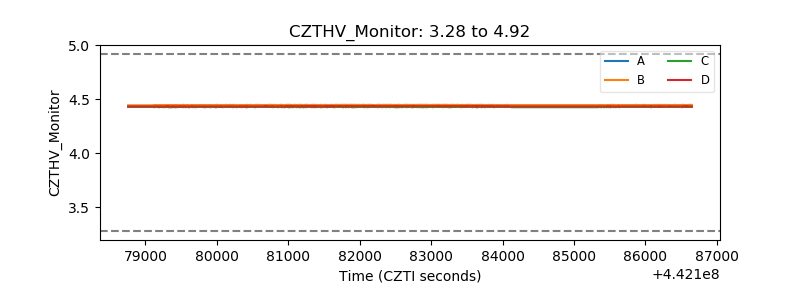 |
| D_VDD | 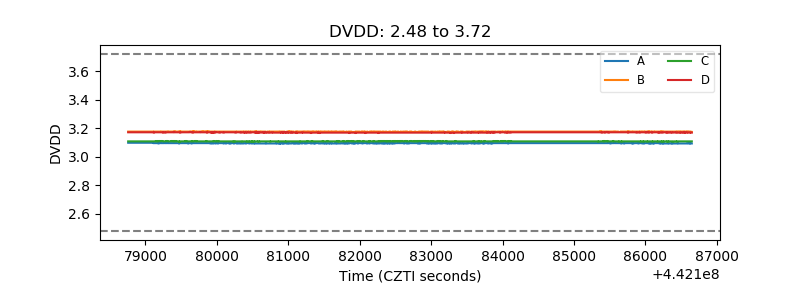 |
| Temperature 1 | 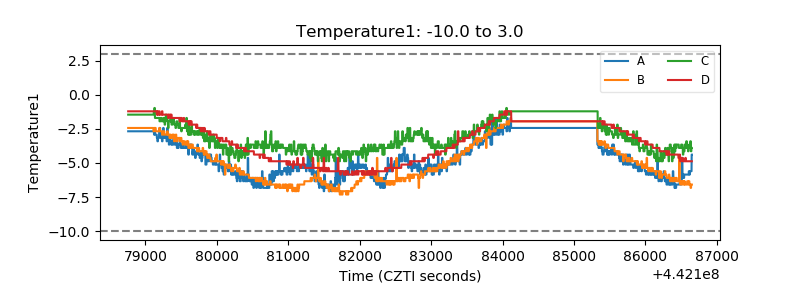 |
| Veto HV Monitor | 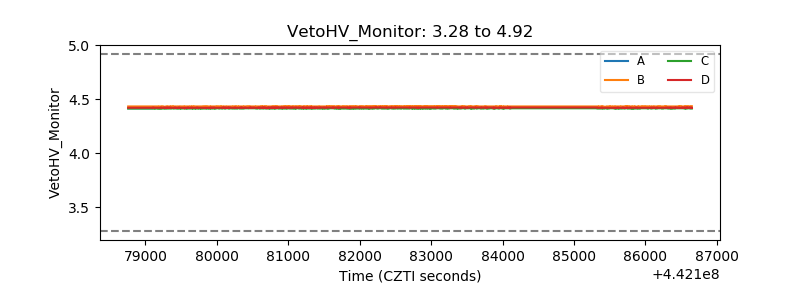 |
| Veto LLD | 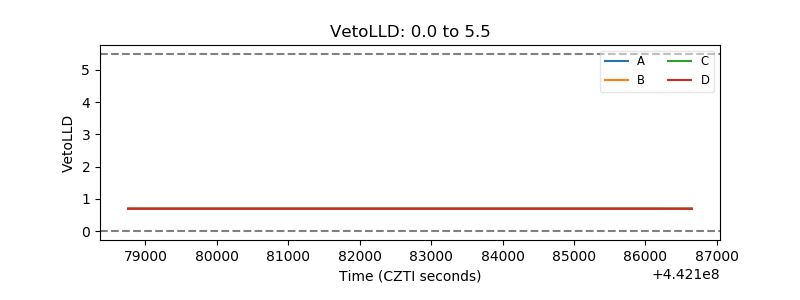 |
| Alpha Counter | 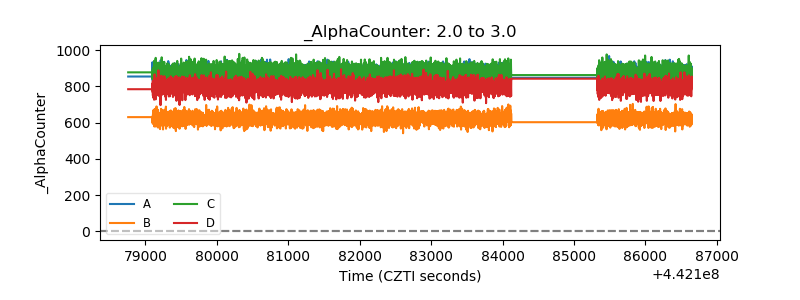 |
| _CPM_Rate | 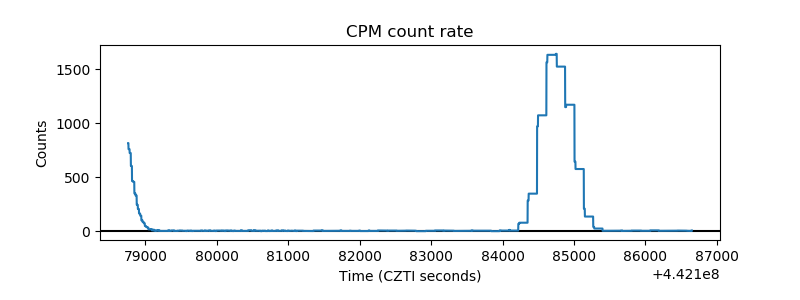 |
| CZT Counter | 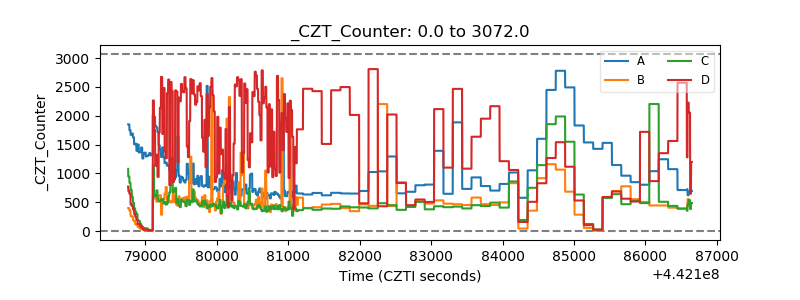 |
| +2.5 Volts monitor | 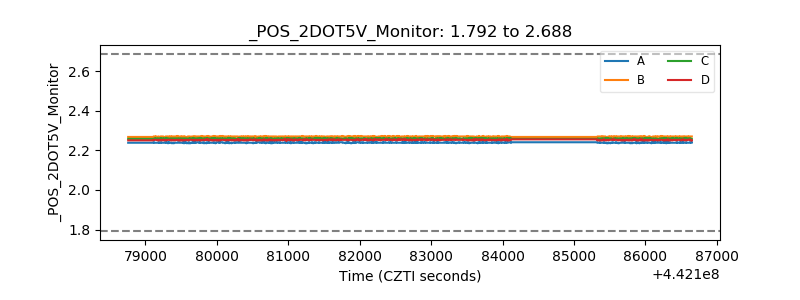 |
| +5 Volts monitor | 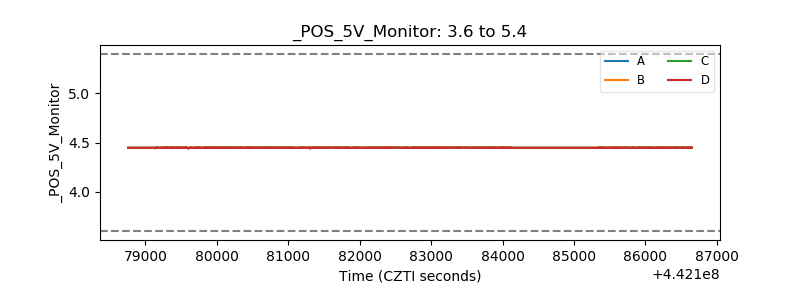 |
| _ROLL_ROT | 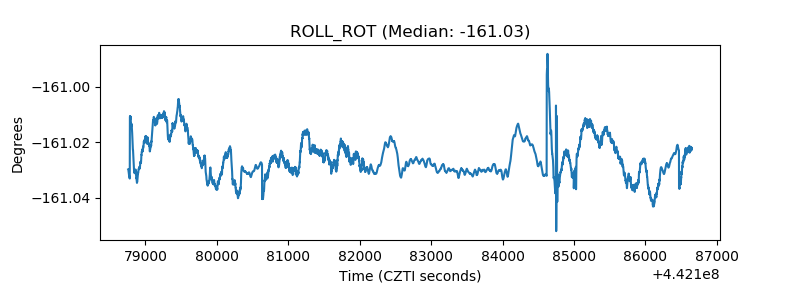 |
| _Roll_DEC | 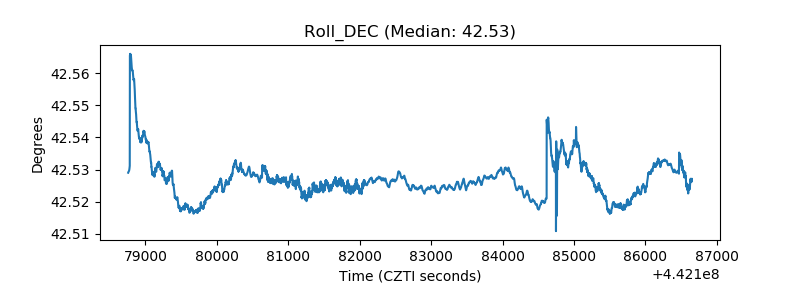 |
| _Roll_RA | 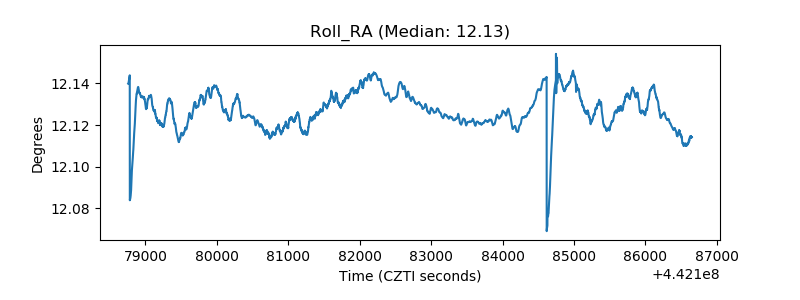 |
| Veto Counter | 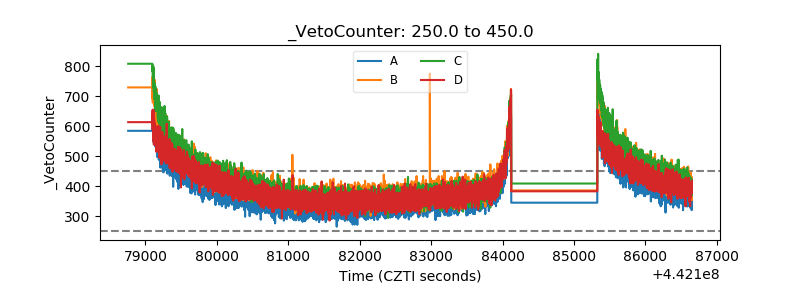 |