| Param | Original file | Final file |
|---|---|---|
| Filename | modeM0/AS1A13_004T11_9000006018_44735cztM0_level2.fits | modeM0/AS1A13_004T11_9000006018_44735cztM0_level2_quad_clean.evt |
| Size (bytes) | 531,005,760 | 107,772,480 |
| Size | 506.4 MB | 102.8 MB |
| Events in quadrant A | 5,646,299 | 727,237 |
| Events in quadrant B | 3,965,792 | 748,963 |
| Events in quadrant C | 3,200,614 | 730,562 |
| Events in quadrant D | 6,348,919 | 611,406 |
| Mode SS | |||
|---|---|---|---|
| Quadrant | BADHDUFLAG | Total packets | Discarded packets |
| A | 0 | 130 | 0 |
| B | 0 | 130 | 0 |
| C | 0 | 130 | 0 |
| D | 0 | 130 | 0 |
| Mode M0 | |||
|---|---|---|---|
| Quadrant | BADHDUFLAG | Total packets | Discarded packets |
| A | 0 | 21873 | 2 |
| B | 0 | 15996 | 2 |
| C | 0 | 14011 | 2 |
| D | 0 | 23245 | 3 |
| Mode M9 | |||
|---|---|---|---|
| Quadrant | BADHDUFLAG | Total packets | Discarded packets |
| A | 0 | 15 | 0 |
| B | 0 | 16 | 0 |
| C | 0 | 16 | 0 |
| D | 0 | 16 | 0 |
| Quadrant | Total seconds | Saturated seconds | Saturation percentage |
|---|---|---|---|
| A | 6377 | 248 | 3.888976% |
| B | 6377 | 275 | 4.312373% |
| C | 6377 | 106 | 1.662224% |
| D | 6376 | 805 | 12.625471% |
Noise dominated data is calculated using 1-second bins in cleaned event files. If a bin has >2000 counts, and if more than 50% of those come from <1% of pixels, then it is considered to be noise-dominated and hence unusable.
| Quadrant | # 1 sec bins | Bins with >0 counts | Bins with >2000 counts | High rate bins dominated by noise | Noise dominated (total time) | Noise dominated (detector-on time) | Marked lightcurve |
|---|---|---|---|---|---|---|---|
| A | 7582 | 6378 | 109 | 109 | 1.44% | 1.71% | 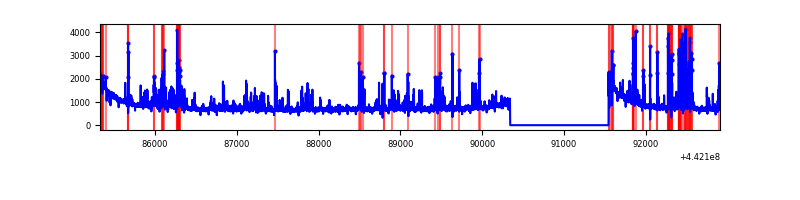 |
| B | 7582 | 6378 | 118 | 118 | 1.56% | 1.85% | 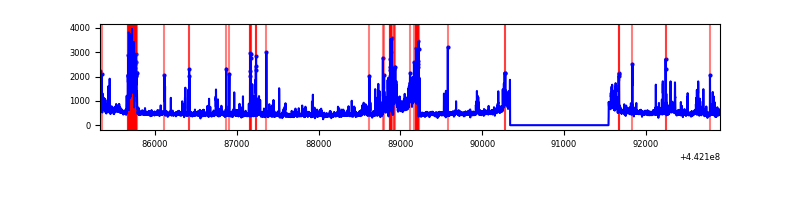 |
| C | 7582 | 6378 | 82 | 82 | 1.08% | 1.29% | 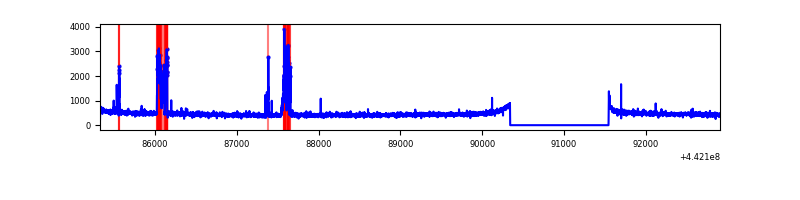 |
| D | 7581 | 6377 | 580 | 580 | 7.65% | 9.10% | 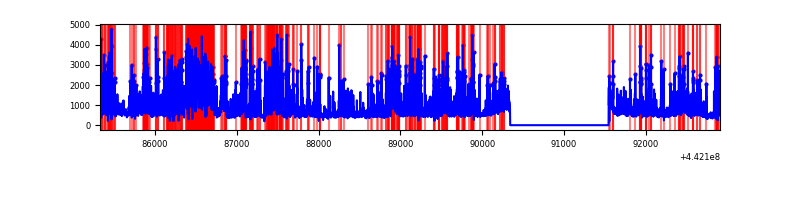 |
Top three noisy pixels from each quadrant. If the there are fewer than three noisy pixels in the level2.evt file, extra rows are filled as -1
| Pixel properties | Quadrant properties | ||||||
|---|---|---|---|---|---|---|---|
| Quadrant | DetID | PixID | Counts | Sigma | Mean | Median | Sigma |
| A | 10 | 83 | 2024691 | 13612.44 | 720 | 704 | 148.7 |
| A | 15 | 223 | 755577 | 5076.94 | 720 | 704 | 148.7 |
| A | 13 | 248 | 31824 | 209.3 | 720 | 704 | 148.7 |
| B | 0 | 189 | 801295 | 5708.68 | 727 | 705 | 140.2 |
| B | 4 | 171 | 125032 | 886.53 | 727 | 705 | 140.2 |
| B | 0 | 190 | 81792 | 578.2 | 727 | 705 | 140.2 |
| C | 5 | 128 | 342572 | 2015.84 | 726 | 729 | 169.6 |
| C | 3 | 233 | 12160 | 67.41 | 726 | 729 | 169.6 |
| C | 1 | 3 | 7560 | 40.28 | 726 | 729 | 169.6 |
| D | 1 | 52 | 2264705 | 13162.11 | 688 | 667 | 172.0 |
| D | 12 | 16 | 364521 | 2115.28 | 688 | 667 | 172.0 |
| D | 2 | 249 | 317738 | 1843.31 | 688 | 667 | 172.0 |
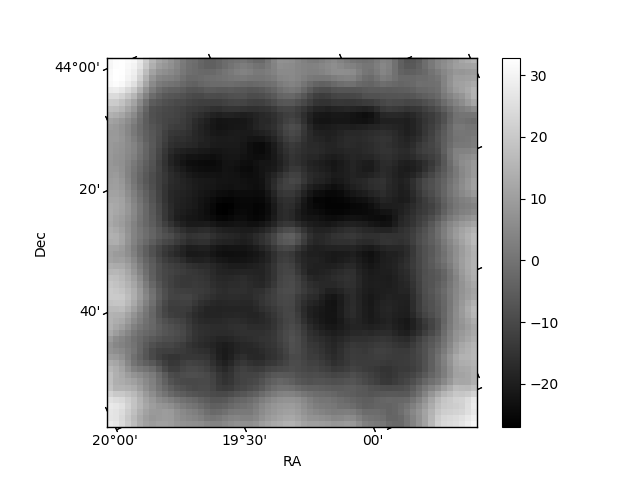
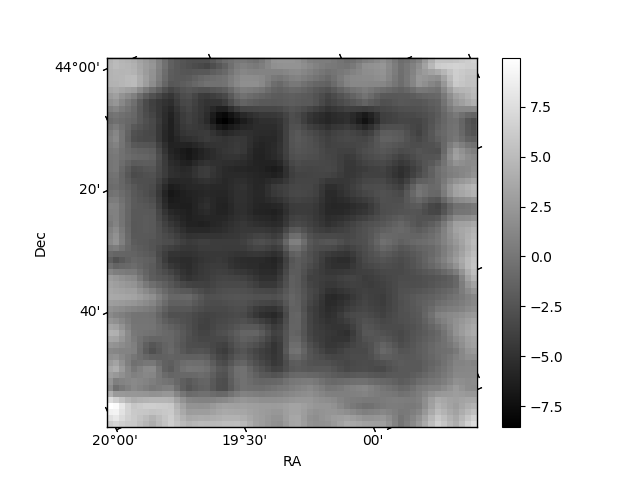
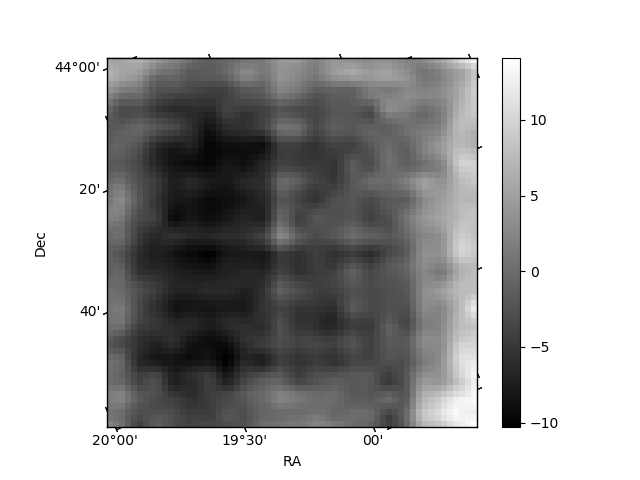
Histogram calculated using DETX and DETY for each event in the final _common_clean file
| Quadrant A | 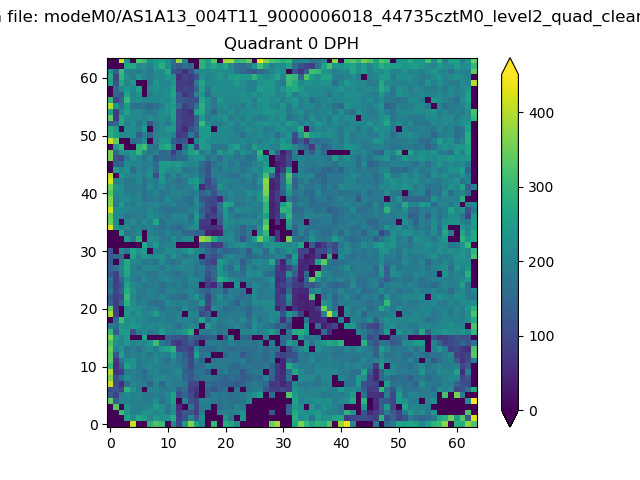 |
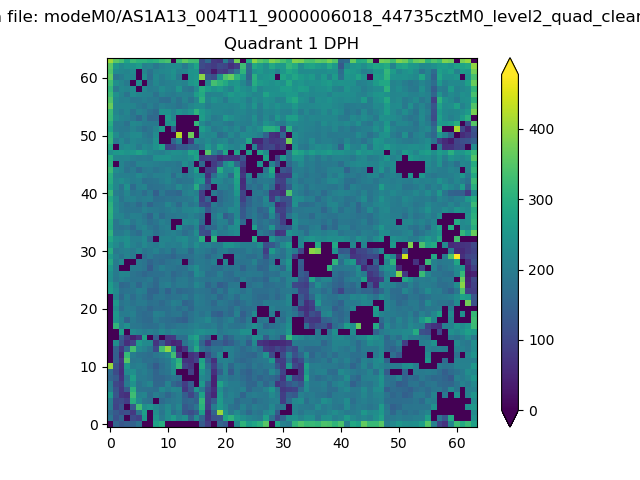 |
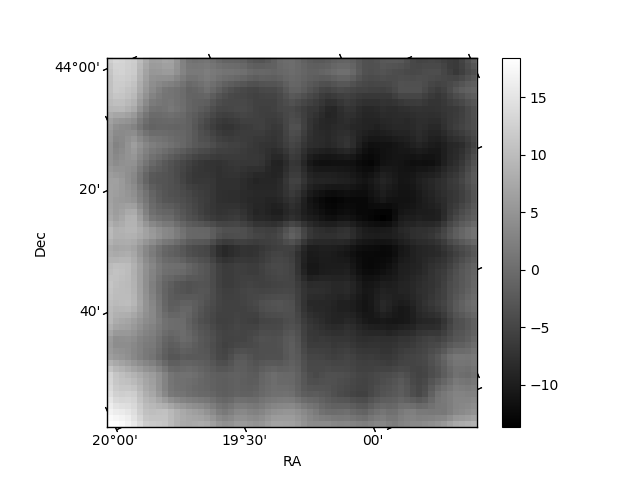
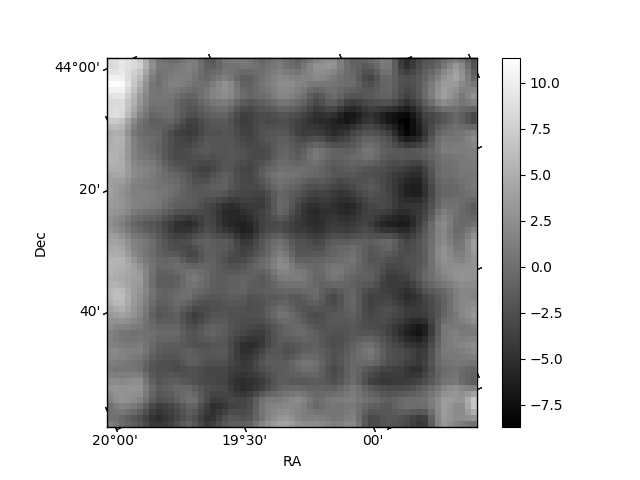
Quadrant B |
|---|---|---|---|
| Quadrant D | 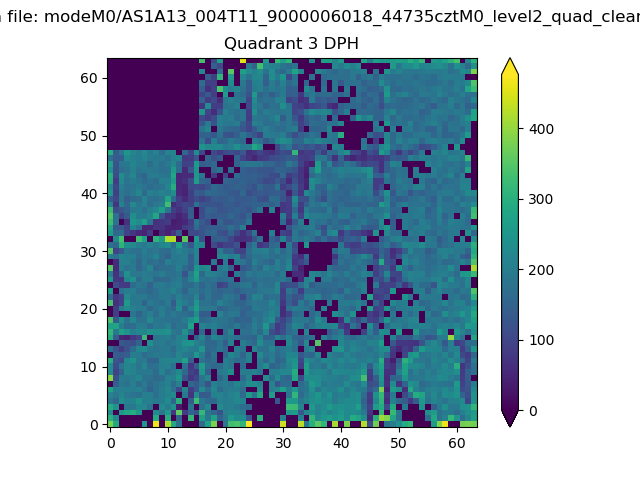 |
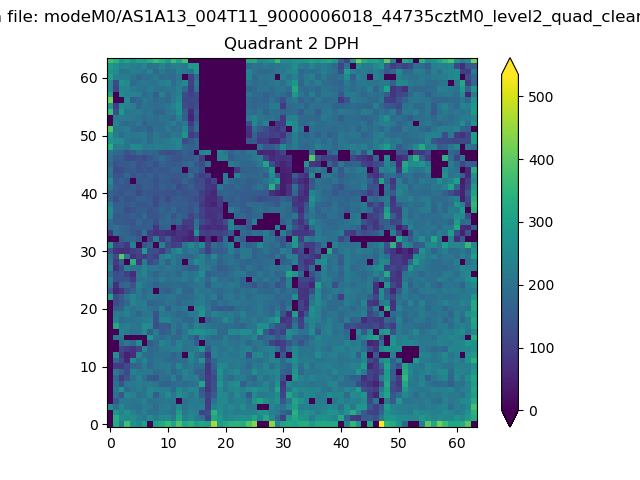 |
Quadrant C |
| Plot type | Count rate plots | Images |
|---|---|---|
| Comparison with Poisson distribution Blue bars denote a histogram of data divided into 1 sec bins. Red curve is a Poisson curve with rate = median count rate of data. |
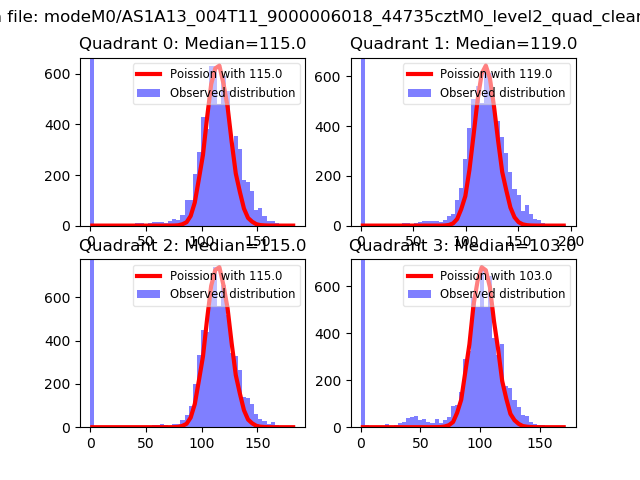 |
 |
| Quadrant-wise count rates Data is divided into 100 sec bins |
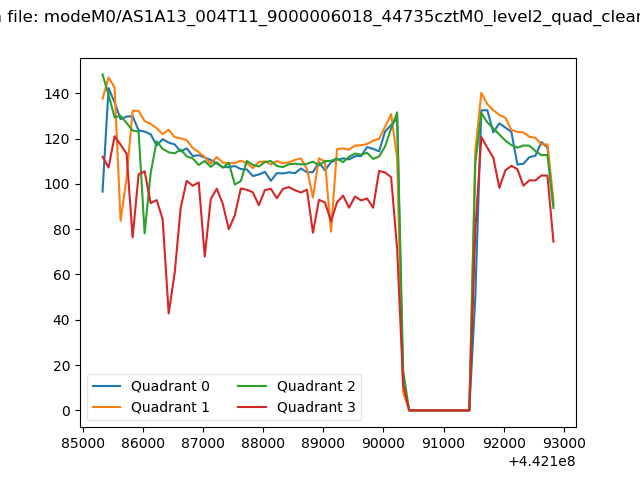 |
|
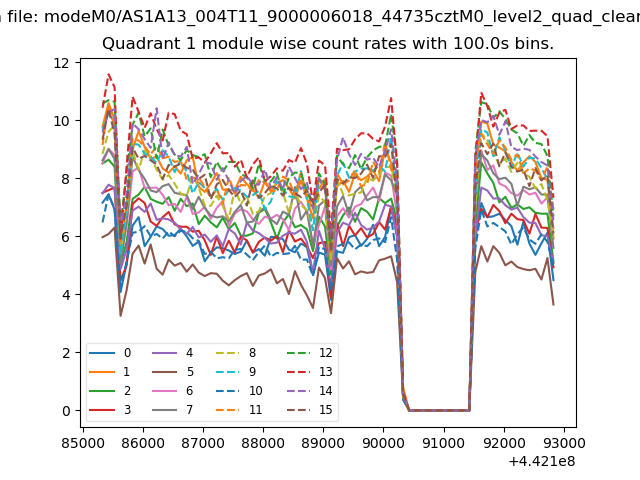
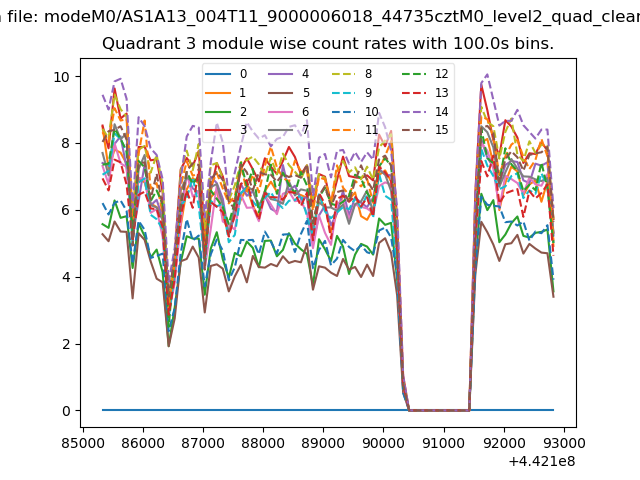
| Module-wise count rates for Quadrant A Data is divided into 100 sec bins |
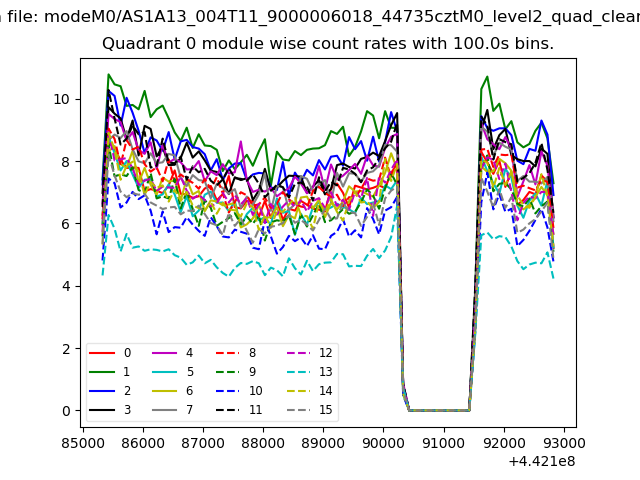 |
 |
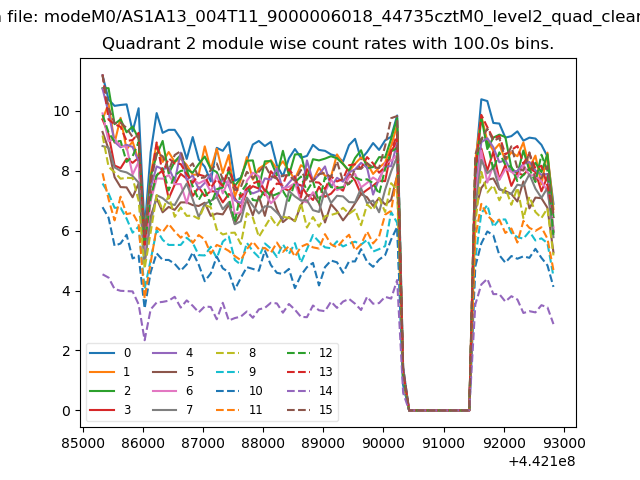
| Module-wise count rates for Quadrant B Data is divided into 100 sec bins |
 |
 |
| Module-wise count rates for Quadrant C Data is divided into 100 sec bins |
 |
 |
| Module-wise count rates for Quadrant D Data is divided into 100 sec bins |
 |
 |
| Parameter | Plot |
|---|---|
| CZT HV Monitor | 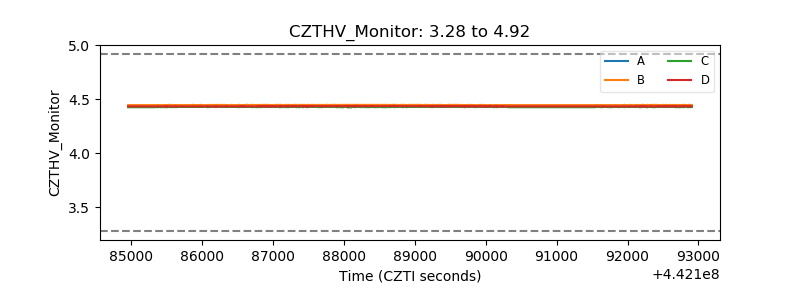 |
| D_VDD | 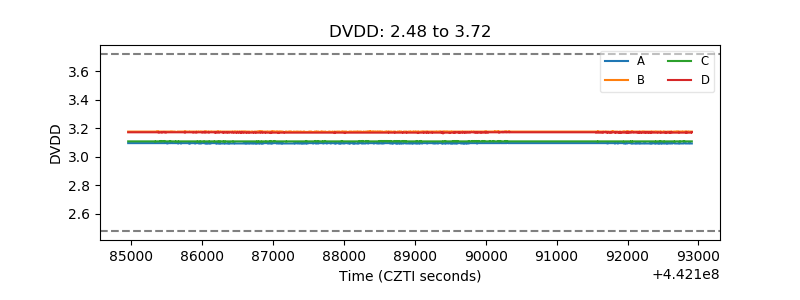 |
| Temperature 1 | 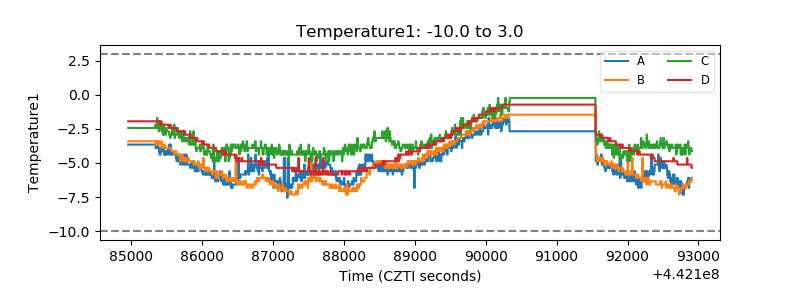 |
| Veto HV Monitor | 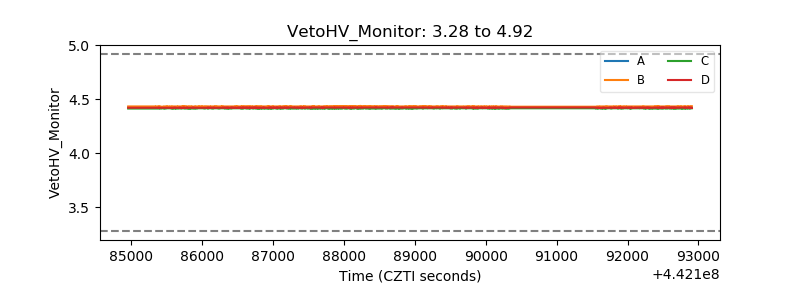 |
| Veto LLD | 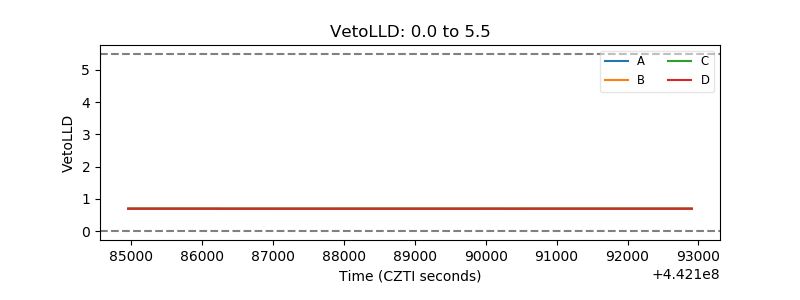 |
| Alpha Counter | 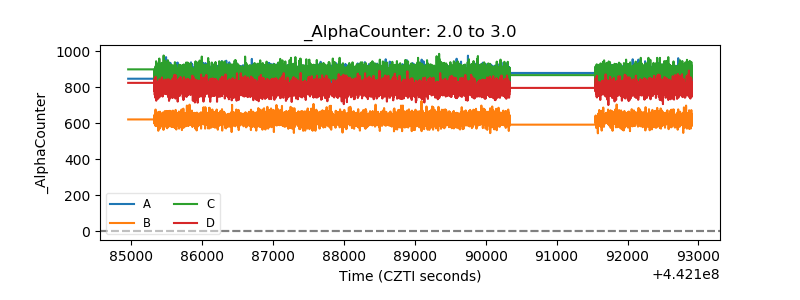 |
| _CPM_Rate | 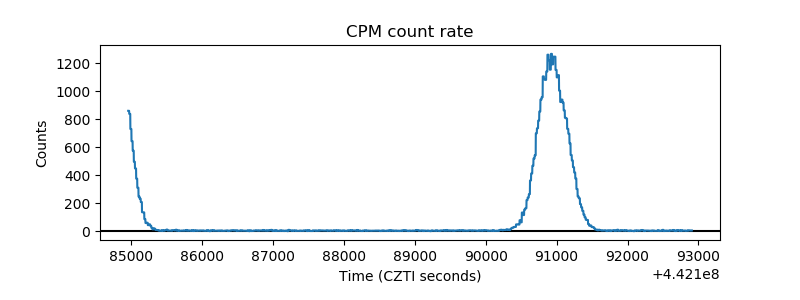 |
| CZT Counter | 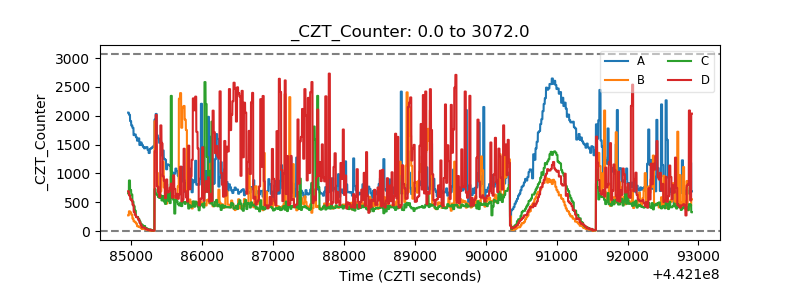 |
| +2.5 Volts monitor | 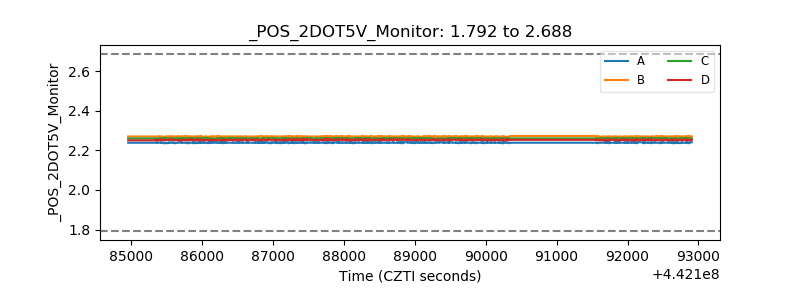 |
| +5 Volts monitor | 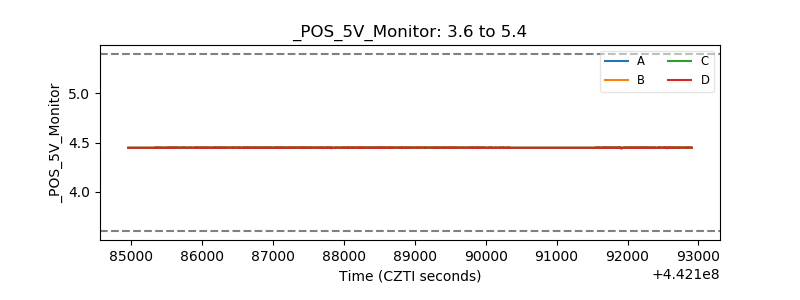 |
| _ROLL_ROT | 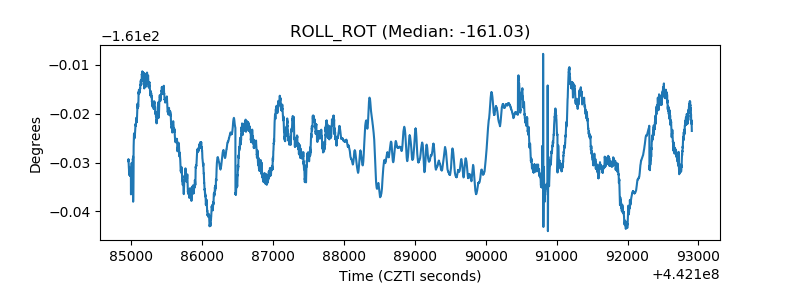 |
| _Roll_DEC |  |
| _Roll_RA | 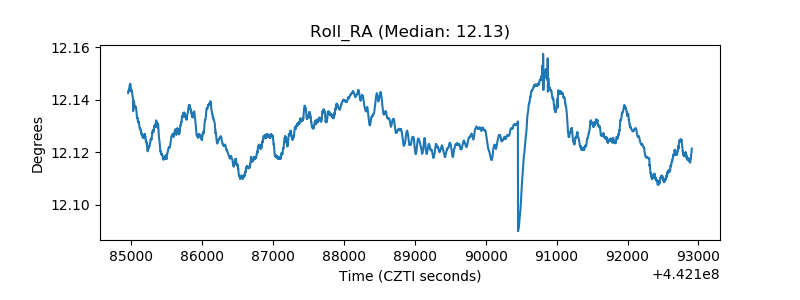 |
| Veto Counter | 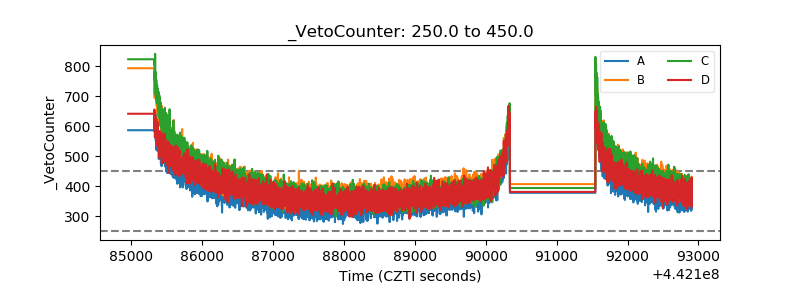 |