| Param | Original file | Final file |
|---|---|---|
| Filename | modeM0/AS1A13_004T11_9000006018_44736cztM0_level2.fits | modeM0/AS1A13_004T11_9000006018_44736cztM0_level2_quad_clean.evt |
| Size (bytes) | 596,220,480 | 110,257,920 |
| Size | 568.6 MB | 105.2 MB |
| Events in quadrant A | 7,945,587 | 701,348 |
| Events in quadrant B | 4,160,863 | 778,841 |
| Events in quadrant C | 3,197,594 | 758,673 |
| Events in quadrant D | 6,240,992 | 627,041 |
| Mode SS | |||
|---|---|---|---|
| Quadrant | BADHDUFLAG | Total packets | Discarded packets |
| A | 0 | 138 | 0 |
| B | 0 | 138 | 0 |
| C | 0 | 138 | 0 |
| D | 0 | 138 | 0 |
| Mode M0 | |||
|---|---|---|---|
| Quadrant | BADHDUFLAG | Total packets | Discarded packets |
| A | 0 | 28434 | 2 |
| B | 0 | 16965 | 2 |
| C | 0 | 14391 | 2 |
| D | 0 | 23282 | 2 |
| Mode M9 | |||
|---|---|---|---|
| Quadrant | BADHDUFLAG | Total packets | Discarded packets |
| A | 0 | 12 | 0 |
| B | 0 | 12 | 0 |
| C | 0 | 13 | 0 |
| D | 0 | 13 | 0 |
| Quadrant | Total seconds | Saturated seconds | Saturation percentage |
|---|---|---|---|
| A | 6778 | 826 | 12.186486% |
| B | 6778 | 223 | 3.290056% |
| C | 6778 | 53 | 0.781942% |
| D | 6778 | 859 | 12.673355% |
Noise dominated data is calculated using 1-second bins in cleaned event files. If a bin has >2000 counts, and if more than 50% of those come from <1% of pixels, then it is considered to be noise-dominated and hence unusable.
| Quadrant | # 1 sec bins | Bins with >0 counts | Bins with >2000 counts | High rate bins dominated by noise | Noise dominated (total time) | Noise dominated (detector-on time) | Marked lightcurve |
|---|---|---|---|---|---|---|---|
| A | 7958 | 6779 | 553 | 553 | 6.95% | 8.16% |  |
| B | 7958 | 6779 | 104 | 104 | 1.31% | 1.53% | 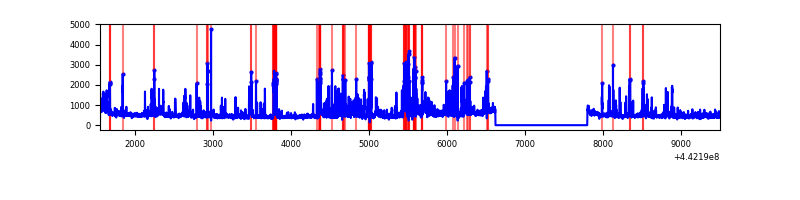 |
| C | 7958 | 6779 | 21 | 21 | 0.26% | 0.31% | 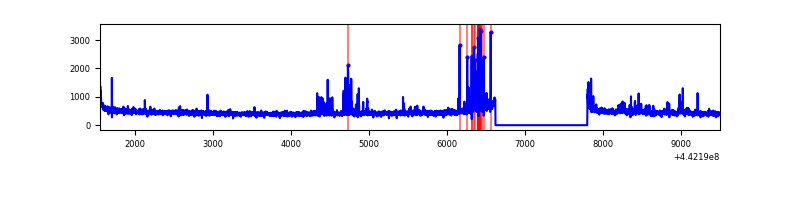 |
| D | 7958 | 6779 | 638 | 638 | 8.02% | 9.41% | 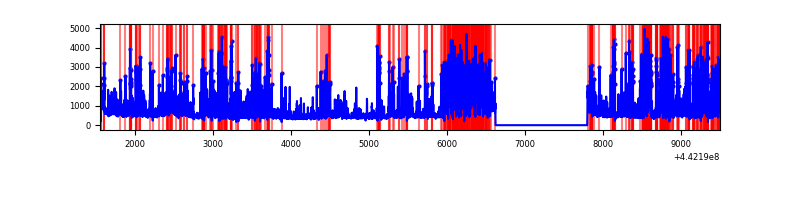 |
Top three noisy pixels from each quadrant. If the there are fewer than three noisy pixels in the level2.evt file, extra rows are filled as -1
| Pixel properties | Quadrant properties | ||||||
|---|---|---|---|---|---|---|---|
| Quadrant | DetID | PixID | Counts | Sigma | Mean | Median | Sigma |
| A | 15 | 223 | 2975319 | 19642.82 | 731 | 716 | 151.4 |
| A | 10 | 83 | 2089540 | 13793.57 | 731 | 716 | 151.4 |
| A | 10 | 248 | 21639 | 138.17 | 731 | 716 | 151.4 |
| B | 0 | 189 | 761556 | 5129.2 | 760 | 737 | 148.3 |
| B | 4 | 171 | 169714 | 1139.19 | 760 | 737 | 148.3 |
| B | 5 | 172 | 59769 | 397.97 | 760 | 737 | 148.3 |
| C | 14 | 254 | 184625 | 1040.49 | 755 | 762 | 176.7 |
| C | 3 | 233 | 29763 | 164.12 | 755 | 762 | 176.7 |
| C | 12 | 2 | 16756 | 90.51 | 755 | 762 | 176.7 |
| D | 1 | 52 | 1860651 | 10508.18 | 705 | 686 | 177.0 |
| D | 8 | 129 | 525628 | 2965.75 | 705 | 686 | 177.0 |
| D | 13 | 249 | 480151 | 2708.82 | 705 | 686 | 177.0 |
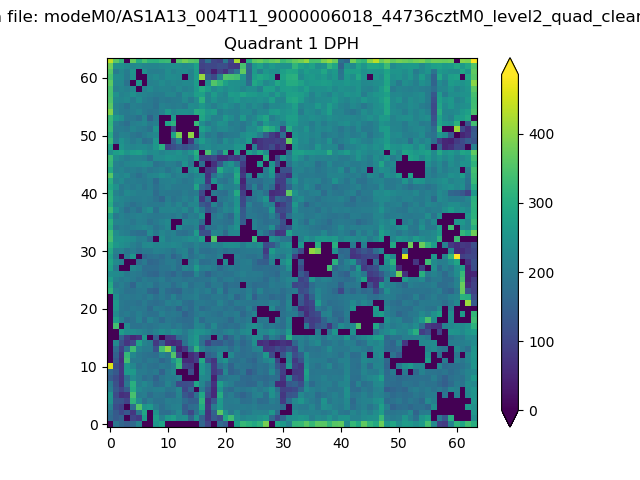
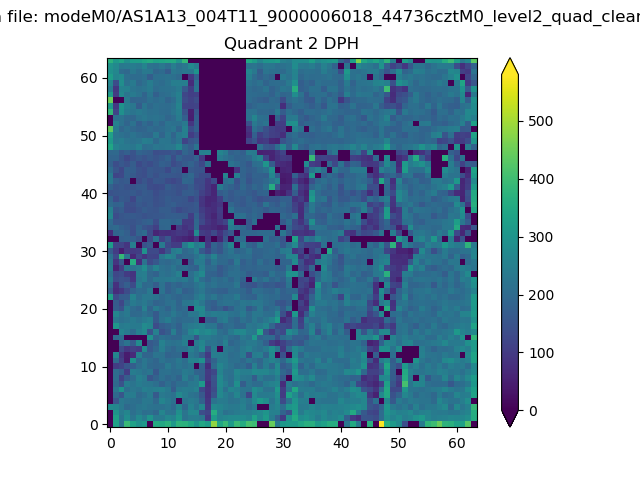
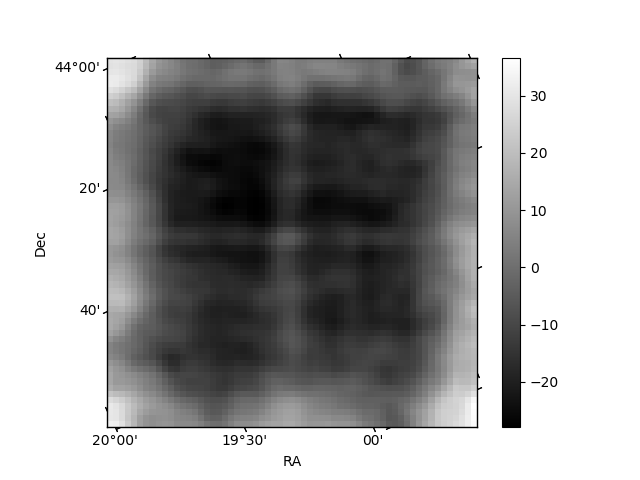
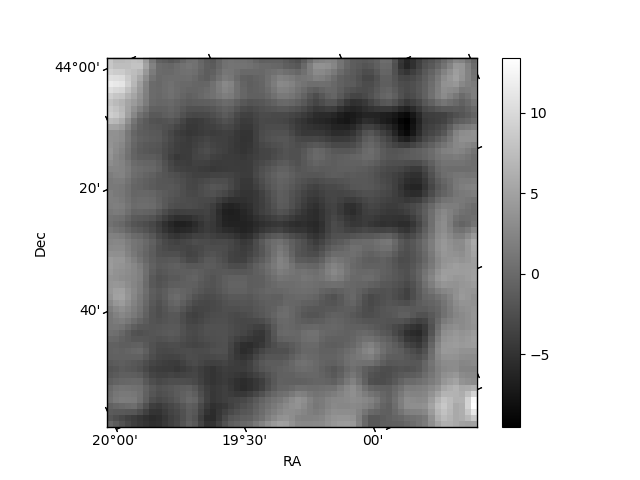
Histogram calculated using DETX and DETY for each event in the final _common_clean file
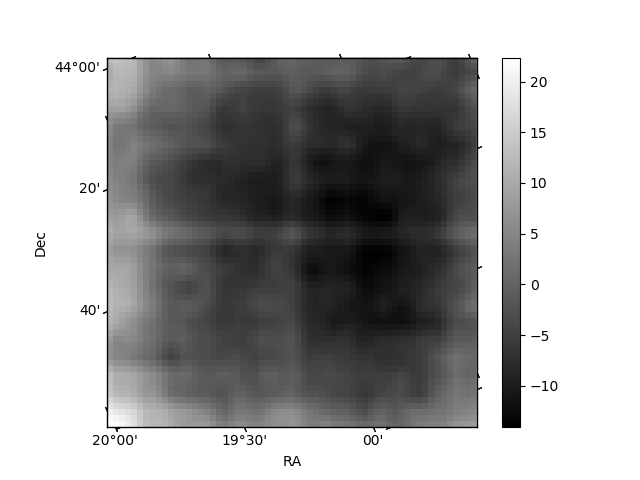
| Quadrant A | 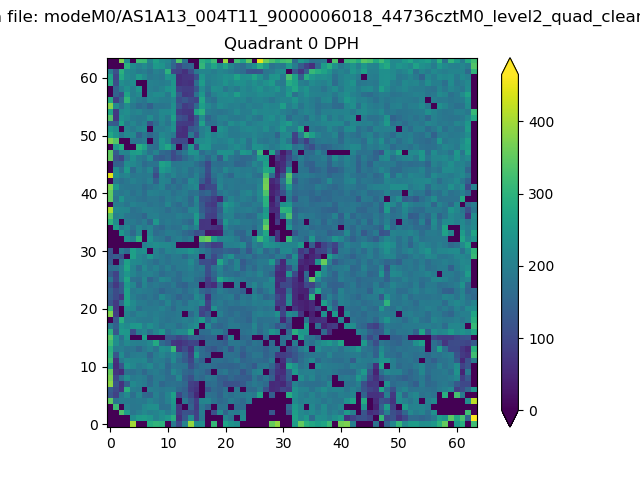 |
 |
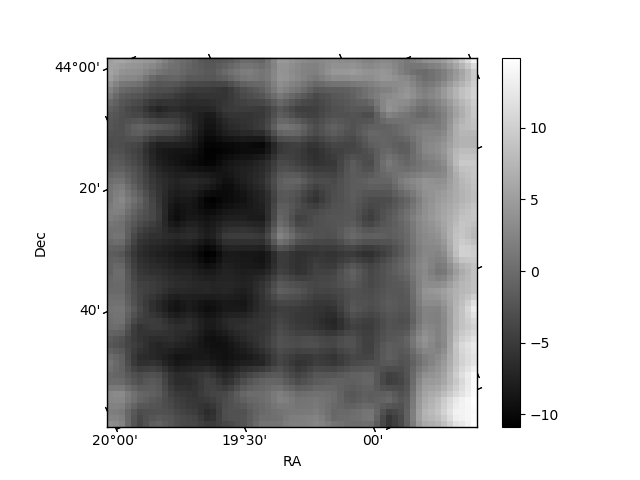
Quadrant B |
|---|---|---|---|
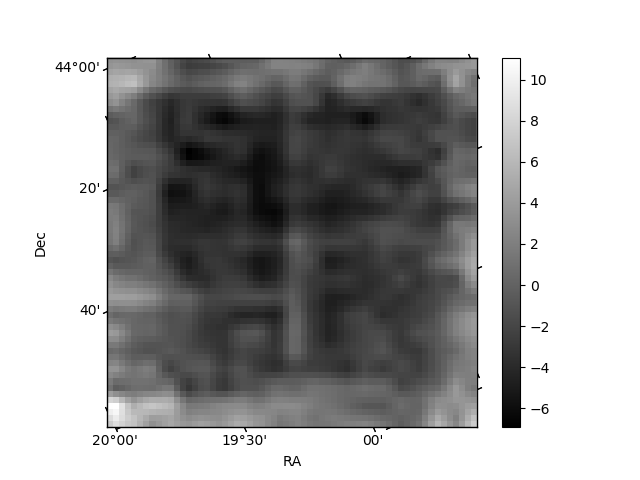
| Quadrant D | 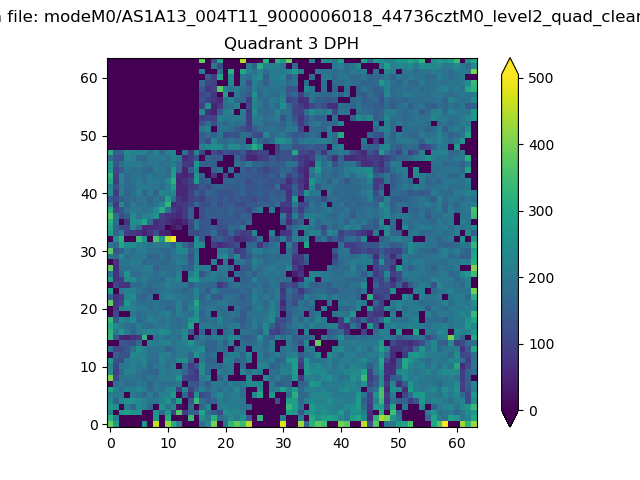 |
 |
Quadrant C |
| Plot type | Count rate plots | Images |
|---|---|---|
| Comparison with Poisson distribution Blue bars denote a histogram of data divided into 1 sec bins. Red curve is a Poisson curve with rate = median count rate of data. |
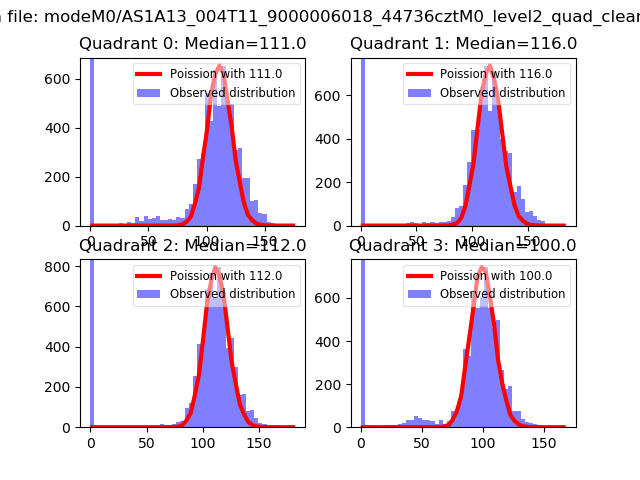 |
 |
| Quadrant-wise count rates Data is divided into 100 sec bins |
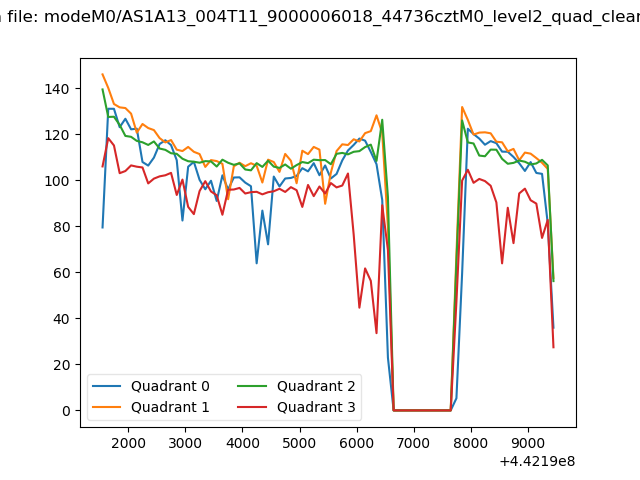 |
|
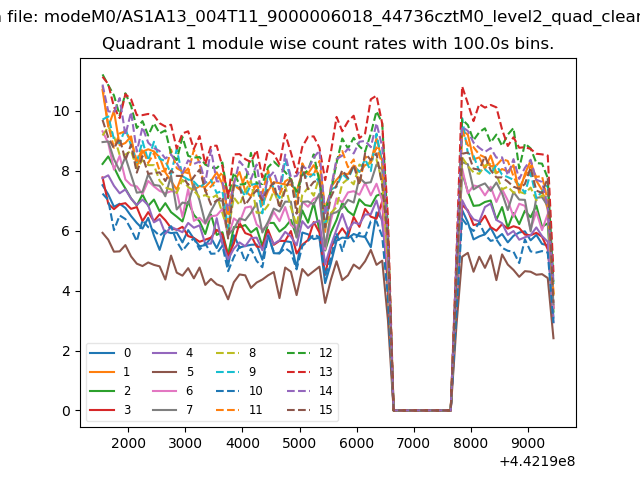
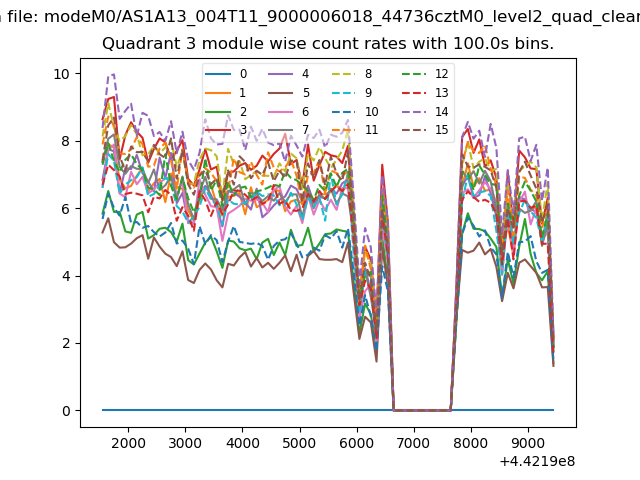
| Module-wise count rates for Quadrant A Data is divided into 100 sec bins |
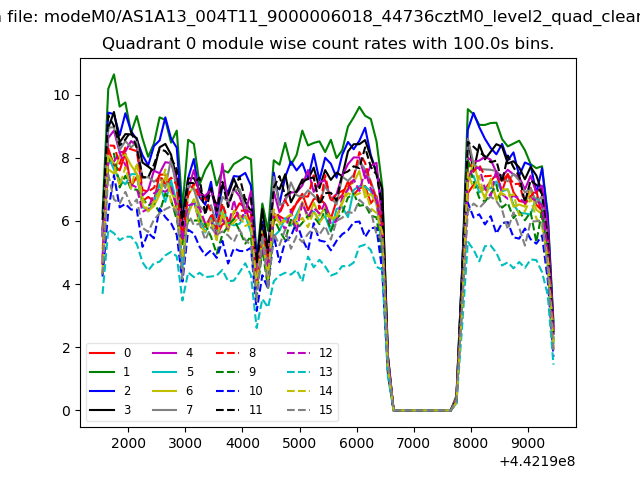 |
 |
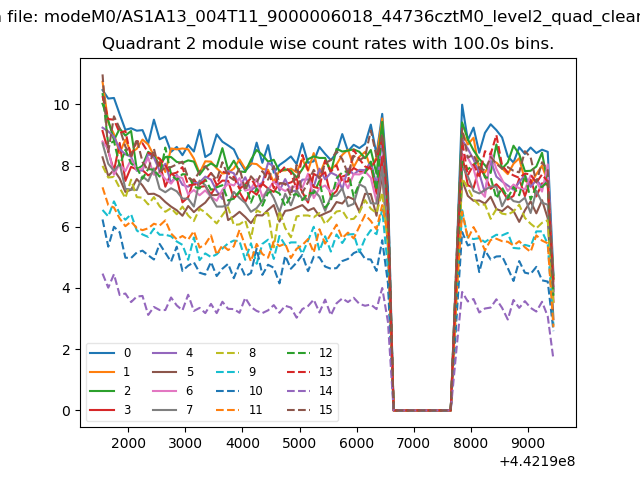
| Module-wise count rates for Quadrant B Data is divided into 100 sec bins |
 |
 |
| Module-wise count rates for Quadrant C Data is divided into 100 sec bins |
 |
 |
| Module-wise count rates for Quadrant D Data is divided into 100 sec bins |
 |
 |
| Parameter | Plot |
|---|---|
| CZT HV Monitor | 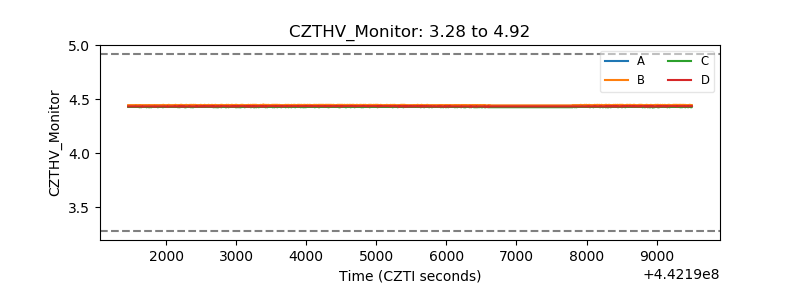 |
| D_VDD | 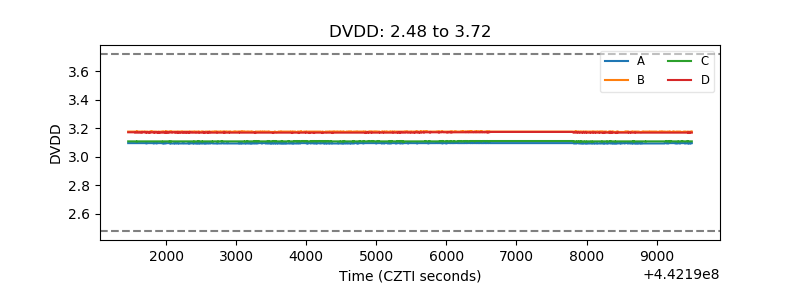 |
| Temperature 1 | 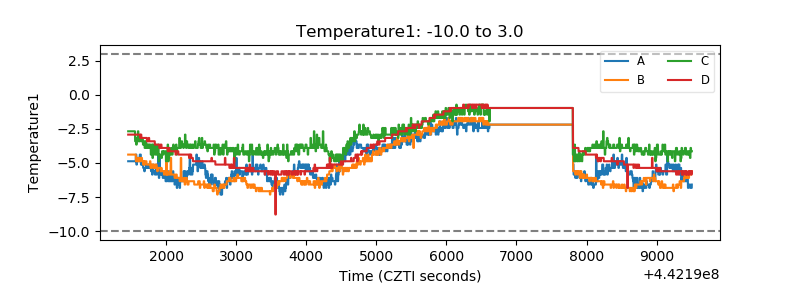 |
| Veto HV Monitor |  |
| Veto LLD | 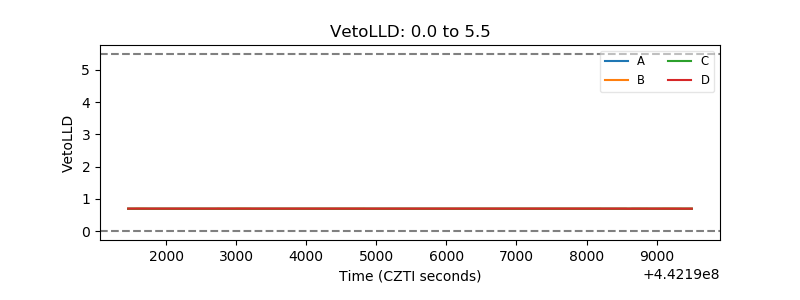 |
| Alpha Counter | 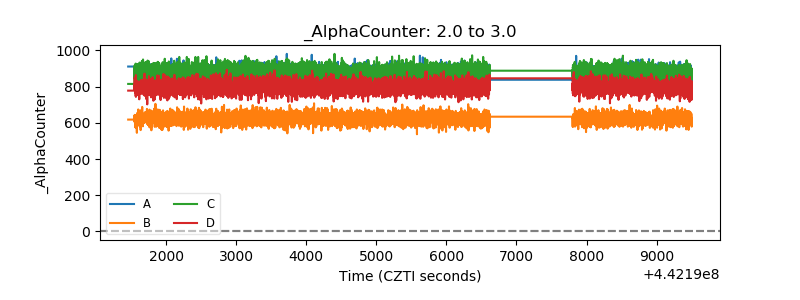 |
| _CPM_Rate | 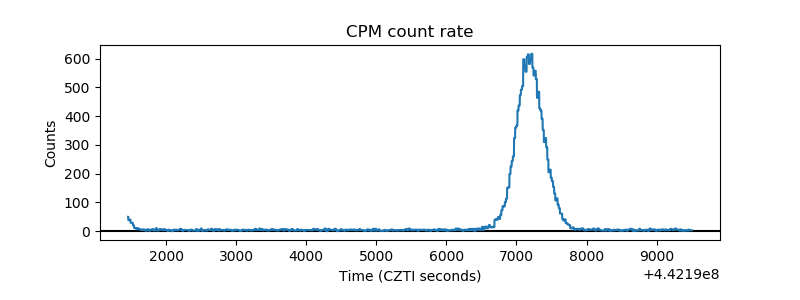 |
| CZT Counter | 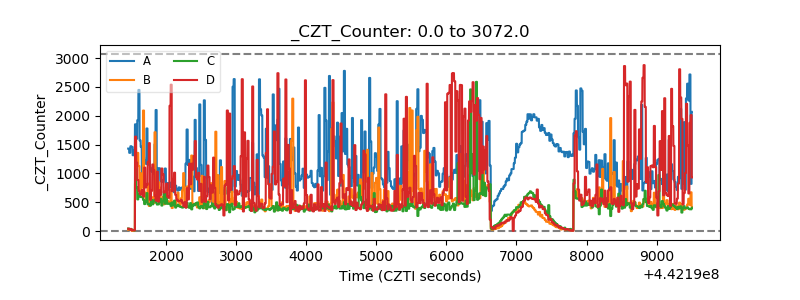 |
| +2.5 Volts monitor | 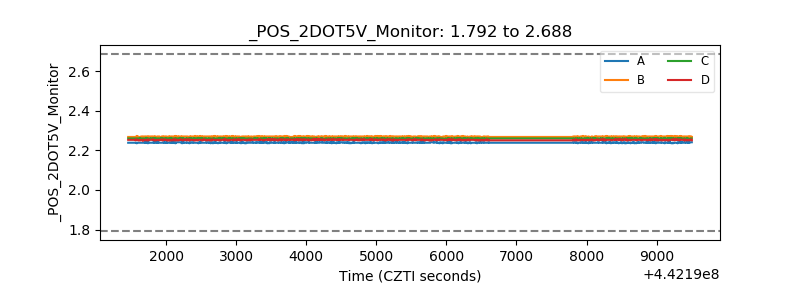 |
| +5 Volts monitor | 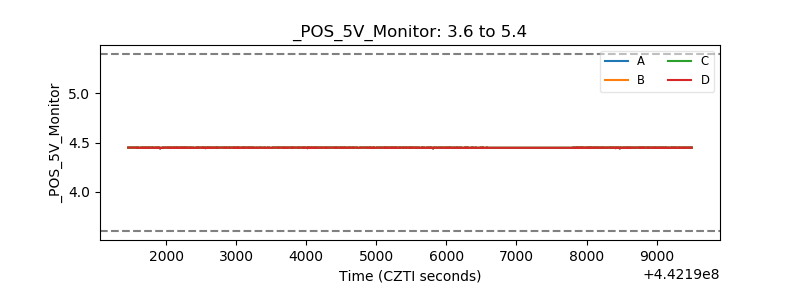 |
| _ROLL_ROT | 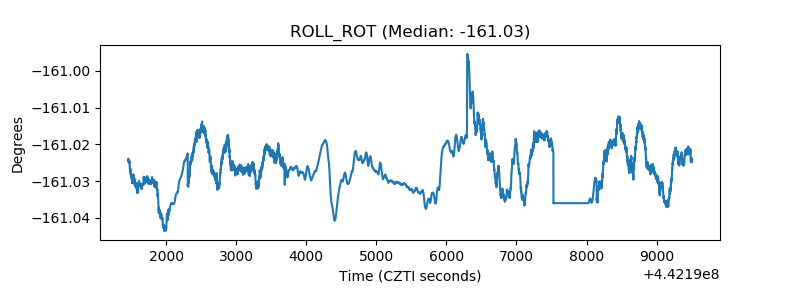 |
| _Roll_DEC | 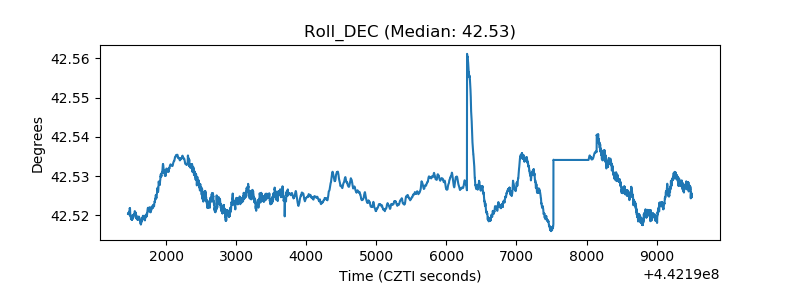 |
| _Roll_RA | 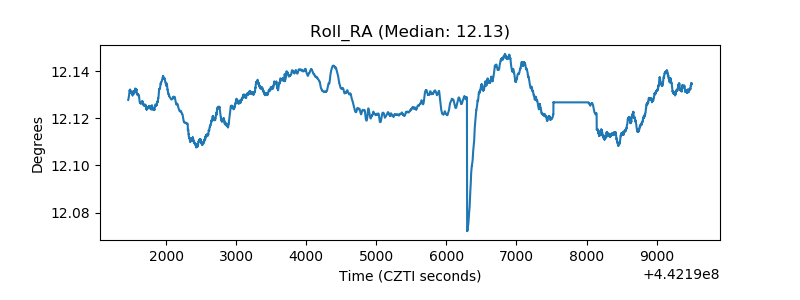 |
| Veto Counter | 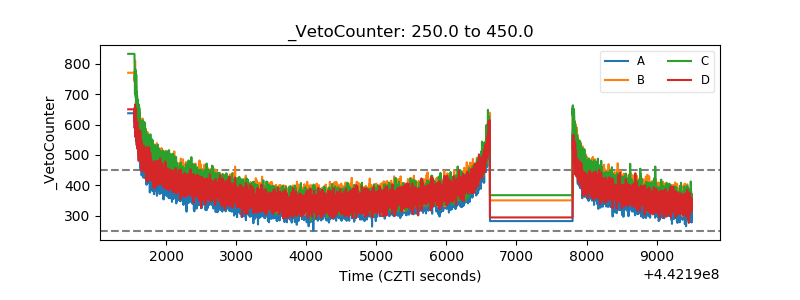 |