| Param | Original file | Final file |
|---|---|---|
| Filename | modeM0/AS1A13_004T11_9000006018_44737cztM0_level2.fits | modeM0/AS1A13_004T11_9000006018_44737cztM0_level2_quad_clean.evt |
| Size (bytes) | 525,202,560 | 104,523,840 |
| Size | 500.9 MB | 99.7 MB |
| Events in quadrant A | 6,991,997 | 665,892 |
| Events in quadrant B | 3,511,994 | 720,356 |
| Events in quadrant C | 3,091,326 | 707,136 |
| Events in quadrant D | 5,337,726 | 614,559 |
| Mode SS | |||
|---|---|---|---|
| Quadrant | BADHDUFLAG | Total packets | Discarded packets |
| A | 0 | 132 | 0 |
| B | 0 | 132 | 0 |
| C | 0 | 132 | 0 |
| D | 0 | 132 | 0 |
| Mode M0 | |||
|---|---|---|---|
| Quadrant | BADHDUFLAG | Total packets | Discarded packets |
| A | 0 | 25601 | 1 |
| B | 0 | 14899 | 1 |
| C | 0 | 13967 | 1 |
| D | 0 | 20396 | 1 |
| Mode M9 | |||
|---|---|---|---|
| Quadrant | BADHDUFLAG | Total packets | Discarded packets |
| A | 0 | 10 | 0 |
| B | 0 | 10 | 0 |
| C | 0 | 10 | 0 |
| D | 0 | 10 | 0 |
| Quadrant | Total seconds | Saturated seconds | Saturation percentage |
|---|---|---|---|
| A | 6552 | 620 | 9.462759% |
| B | 6553 | 155 | 2.365329% |
| C | 6553 | 49 | 0.747749% |
| D | 6553 | 547 | 8.347322% |
Noise dominated data is calculated using 1-second bins in cleaned event files. If a bin has >2000 counts, and if more than 50% of those come from <1% of pixels, then it is considered to be noise-dominated and hence unusable.
| Quadrant | # 1 sec bins | Bins with >0 counts | Bins with >2000 counts | High rate bins dominated by noise | Noise dominated (total time) | Noise dominated (detector-on time) | Marked lightcurve |
|---|---|---|---|---|---|---|---|
| A | 7517 | 6553 | 409 | 409 | 5.44% | 6.24% | 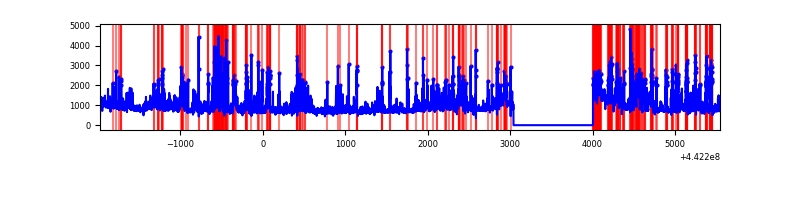 |
| B | 7518 | 6554 | 56 | 56 | 0.74% | 0.85% | 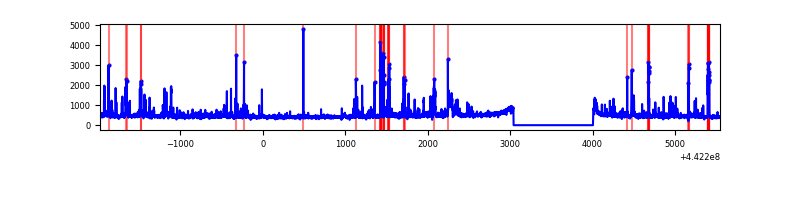 |
| C | 7518 | 6554 | 24 | 24 | 0.32% | 0.37% | 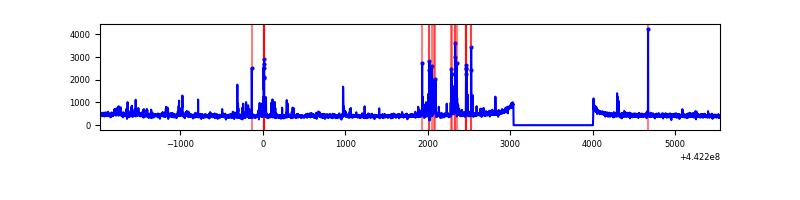 |
| D | 7518 | 6554 | 424 | 424 | 5.64% | 6.47% | 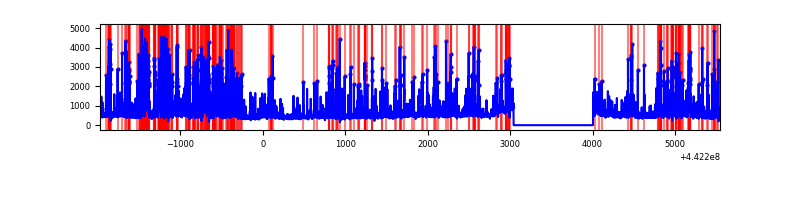 |
Top three noisy pixels from each quadrant. If the there are fewer than three noisy pixels in the level2.evt file, extra rows are filled as -1
| Pixel properties | Quadrant properties | ||||||
|---|---|---|---|---|---|---|---|
| Quadrant | DetID | PixID | Counts | Sigma | Mean | Median | Sigma |
| A | 15 | 223 | 2357698 | 16056.96 | 706 | 690 | 146.8 |
| A | 10 | 83 | 1862039 | 12680.32 | 706 | 690 | 146.8 |
| A | 13 | 248 | 19473 | 127.96 | 706 | 690 | 146.8 |
| B | 0 | 189 | 242533 | 1691.65 | 724 | 703 | 143.0 |
| B | 4 | 171 | 190933 | 1330.7 | 724 | 703 | 143.0 |
| B | 0 | 219 | 41722 | 286.94 | 724 | 703 | 143.0 |
| C | 14 | 254 | 240541 | 1415.99 | 718 | 723 | 169.4 |
| C | 3 | 233 | 26547 | 152.48 | 718 | 723 | 169.4 |
| C | 12 | 2 | 12503 | 69.55 | 718 | 723 | 169.4 |
| D | 1 | 52 | 788485 | 4580.67 | 688 | 667 | 172.0 |
| D | 13 | 249 | 758116 | 4404.1 | 688 | 667 | 172.0 |
| D | 8 | 129 | 746444 | 4336.23 | 688 | 667 | 172.0 |
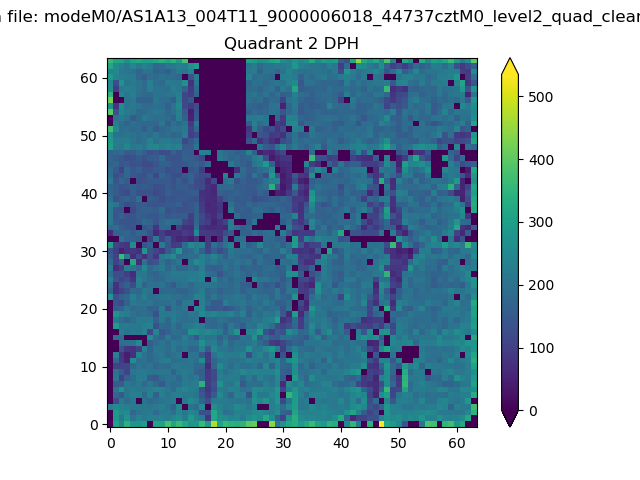
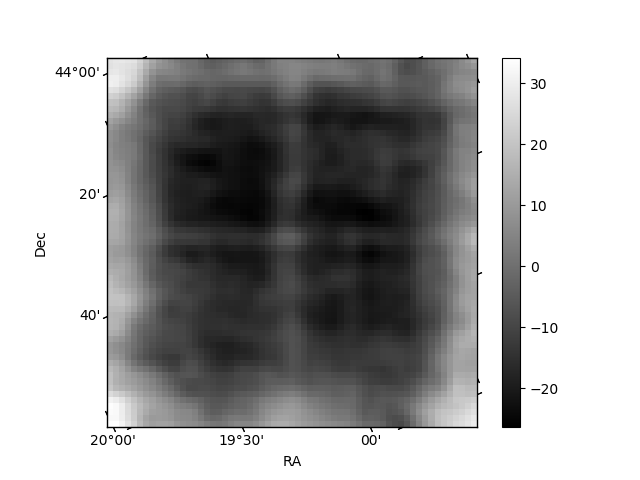
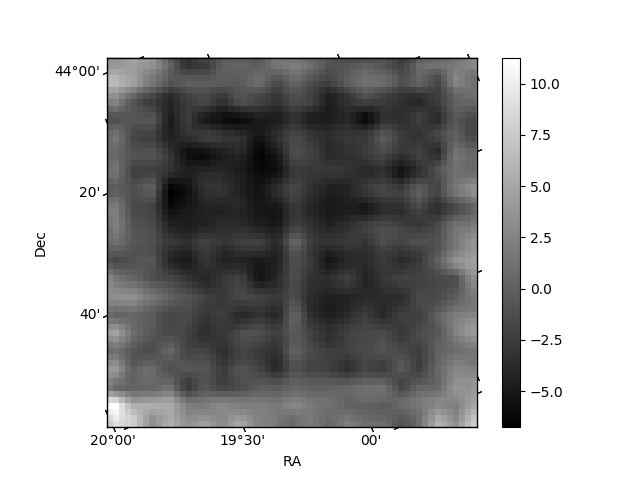
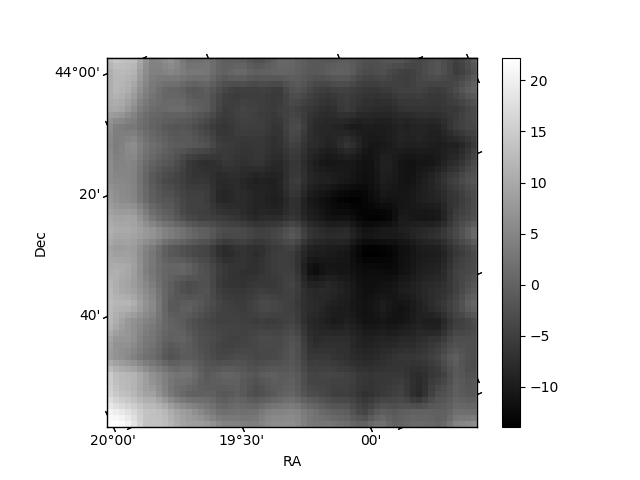
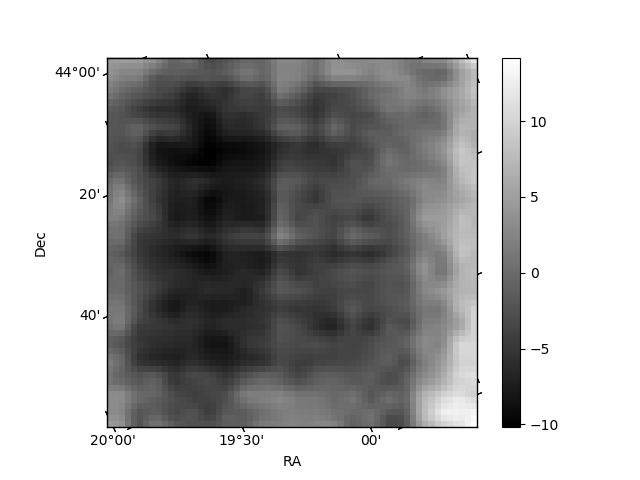
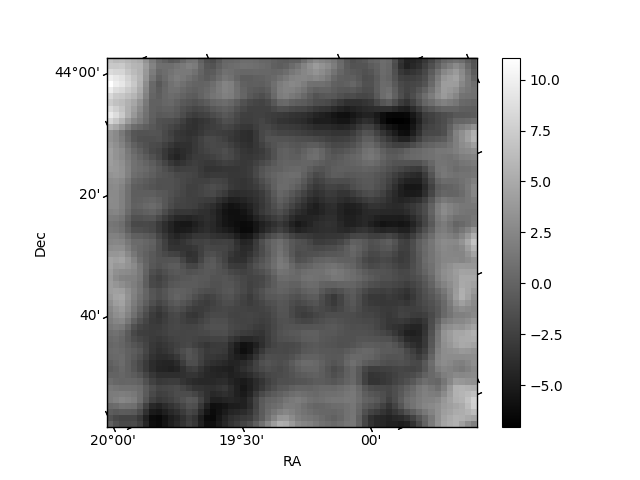
Histogram calculated using DETX and DETY for each event in the final _common_clean file
| Quadrant A | 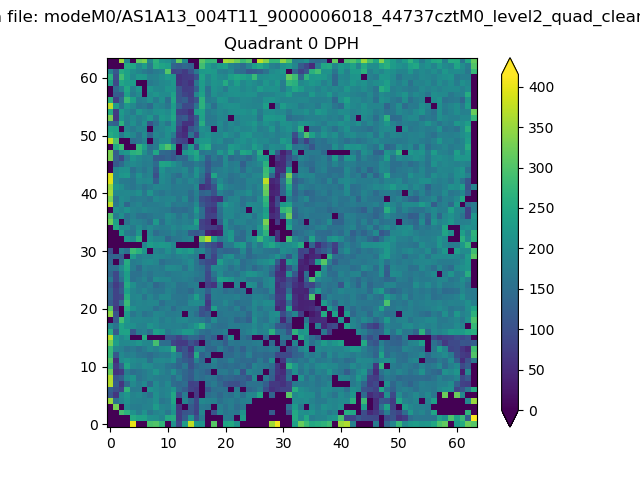 |
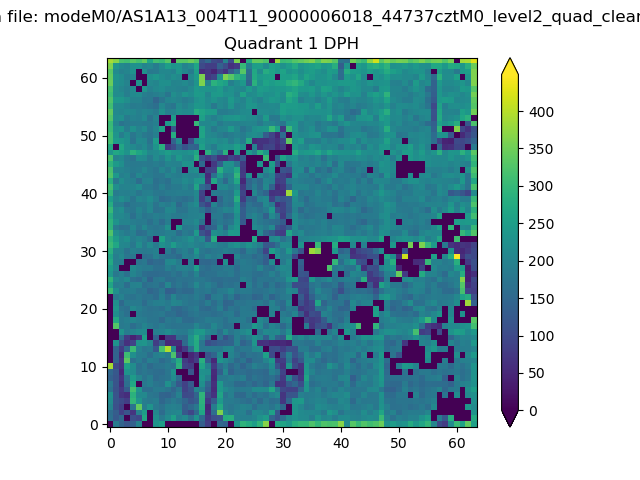 |
Quadrant B |
|---|---|---|---|
| Quadrant D | 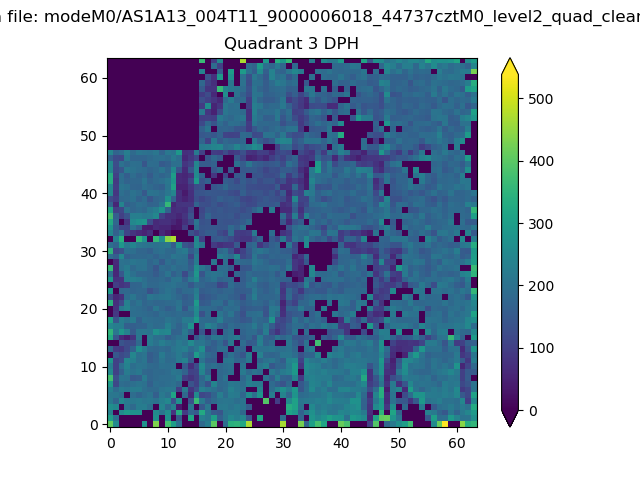 |
 |
Quadrant C |
| Plot type | Count rate plots | Images |
|---|---|---|
| Comparison with Poisson distribution Blue bars denote a histogram of data divided into 1 sec bins. Red curve is a Poisson curve with rate = median count rate of data. |
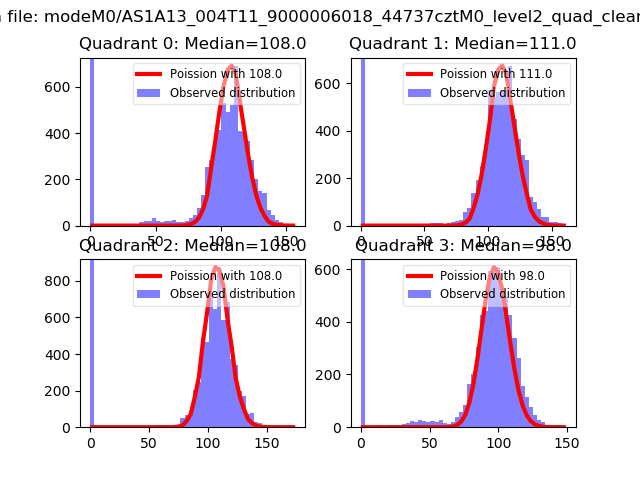 |
 |
| Quadrant-wise count rates Data is divided into 100 sec bins |
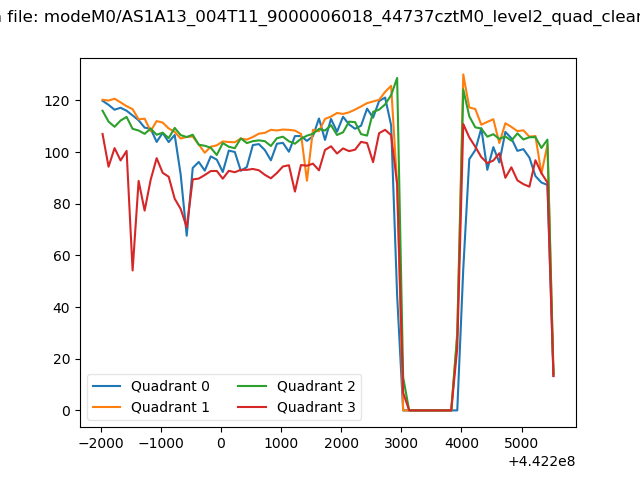 |
|
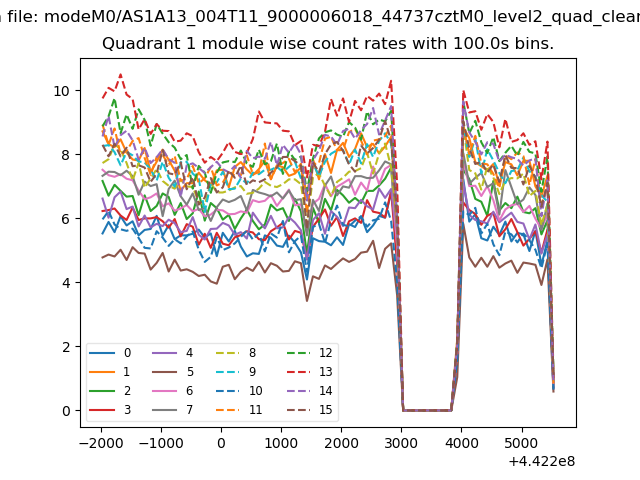
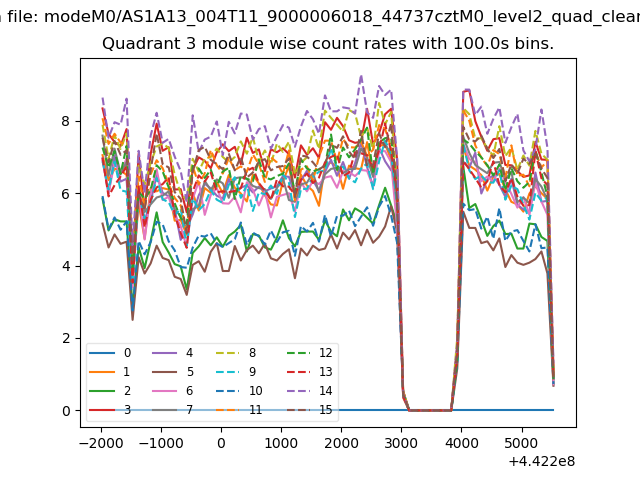
| Module-wise count rates for Quadrant A Data is divided into 100 sec bins |
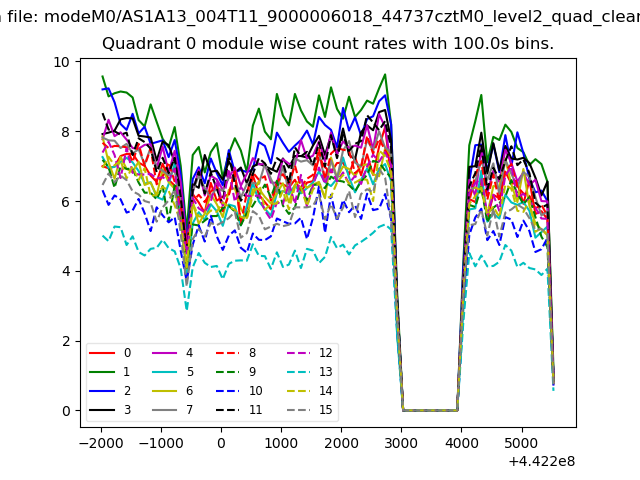 |
 |
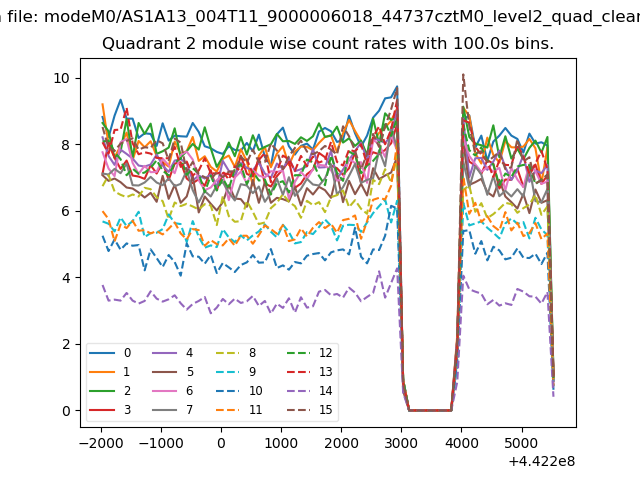
| Module-wise count rates for Quadrant B Data is divided into 100 sec bins |
 |
 |
| Module-wise count rates for Quadrant C Data is divided into 100 sec bins |
 |
 |
| Module-wise count rates for Quadrant D Data is divided into 100 sec bins |
 |
 |
| Parameter | Plot |
|---|---|
| CZT HV Monitor | 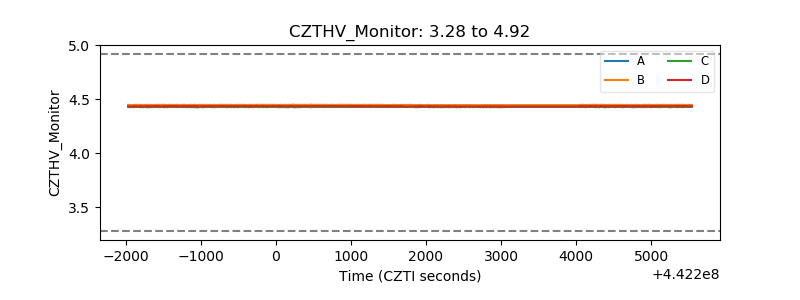 |
| D_VDD | 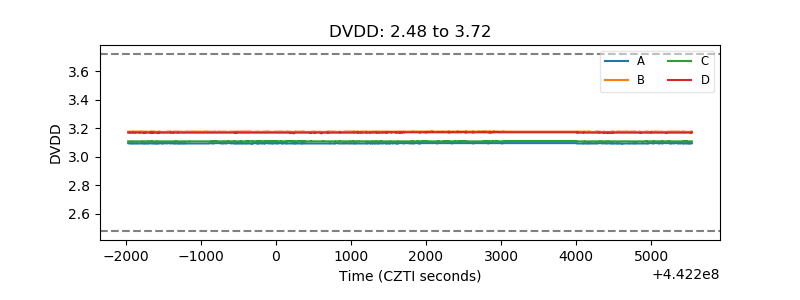 |
| Temperature 1 | 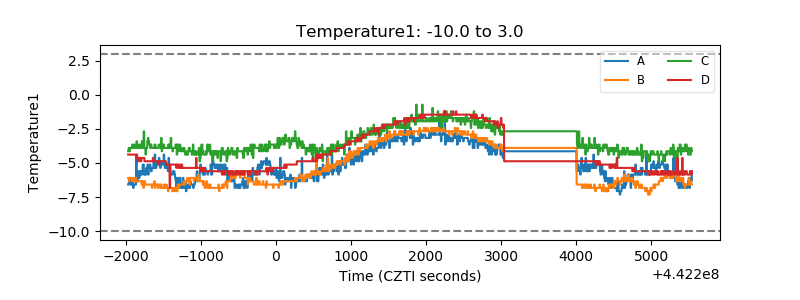 |
| Veto HV Monitor | 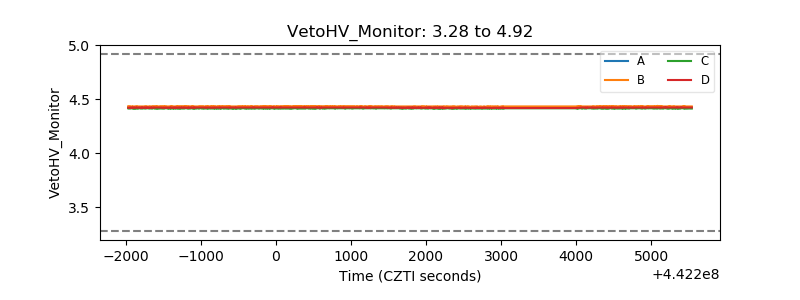 |
| Veto LLD | 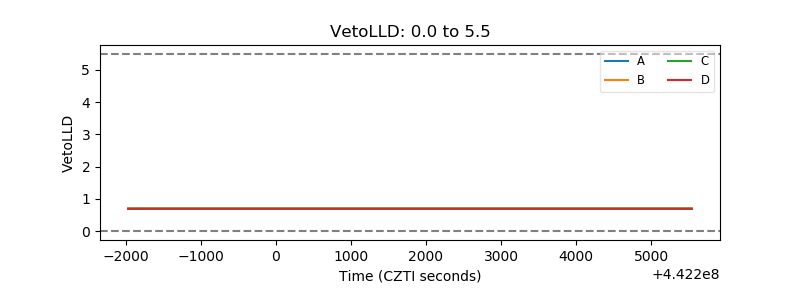 |
| Alpha Counter | 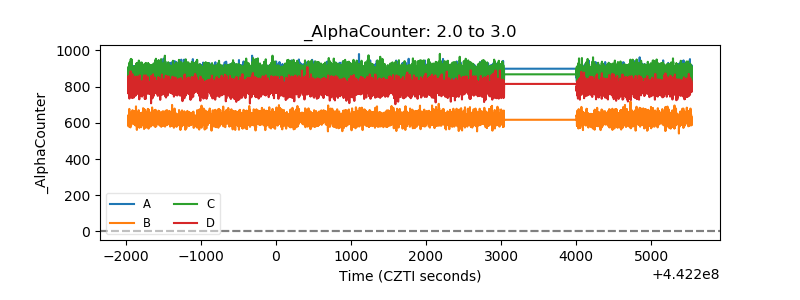 |
| _CPM_Rate | 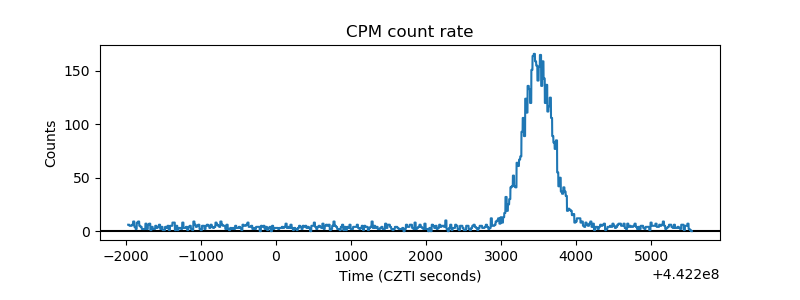 |
| CZT Counter | 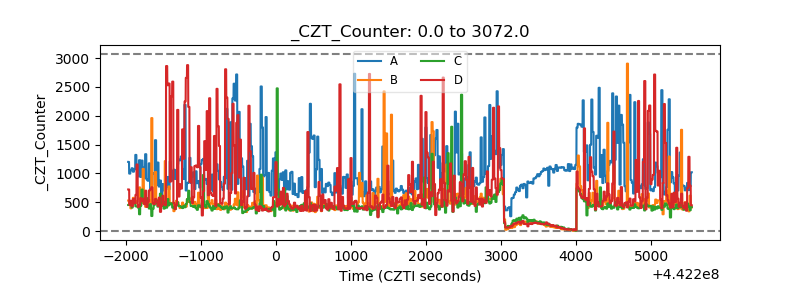 |
| +2.5 Volts monitor | 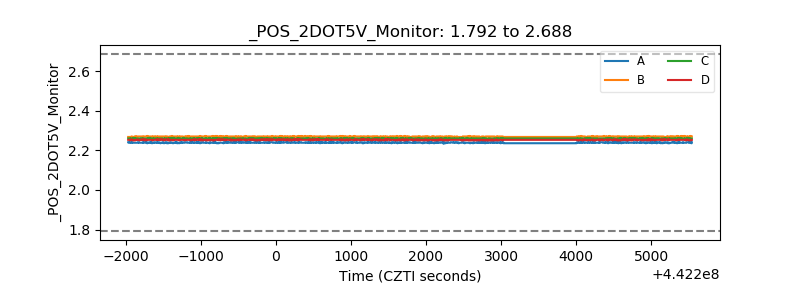 |
| +5 Volts monitor | 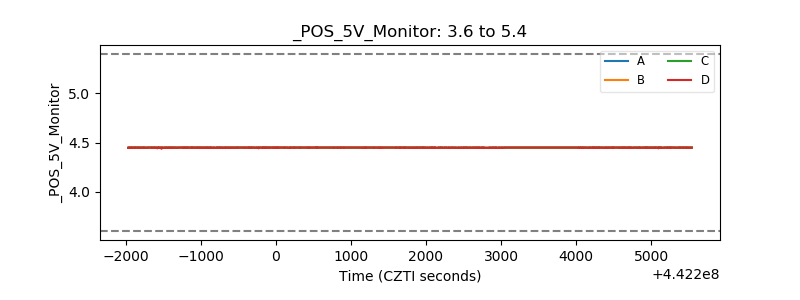 |
| _ROLL_ROT | 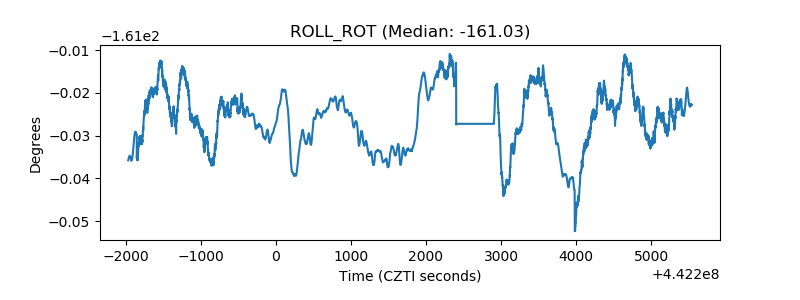 |
| _Roll_DEC |  |
| _Roll_RA | 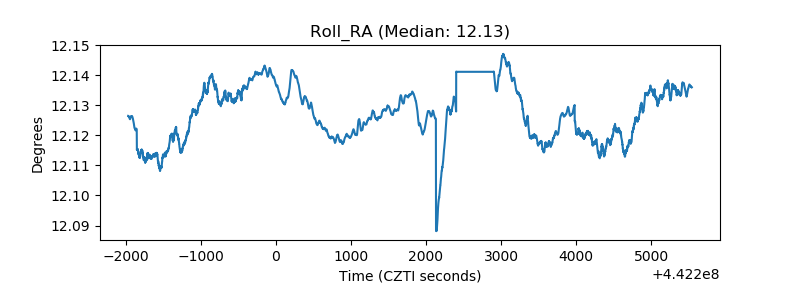 |
| Veto Counter | 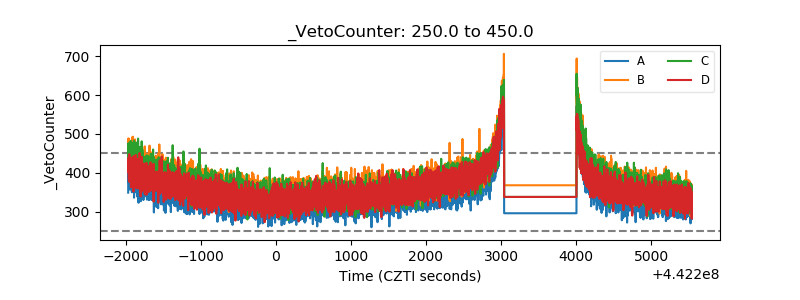 |