| Param | Original file | Final file |
|---|---|---|
| Filename | modeM0/AS1A13_004T11_9000006018_44738cztM0_level2.fits | modeM0/AS1A13_004T11_9000006018_44738cztM0_level2_quad_clean.evt |
| Size (bytes) | 558,947,520 | 114,033,600 |
| Size | 533.1 MB | 108.8 MB |
| Events in quadrant A | 6,317,895 | 739,580 |
| Events in quadrant B | 3,849,611 | 777,953 |
| Events in quadrant C | 3,355,805 | 776,815 |
| Events in quadrant D | 6,600,699 | 650,250 |
| Mode SS | |||
|---|---|---|---|
| Quadrant | BADHDUFLAG | Total packets | Discarded packets |
| A | 0 | 150 | 0 |
| B | 0 | 150 | 0 |
| C | 0 | 150 | 0 |
| D | 0 | 150 | 0 |
| Mode M0 | |||
|---|---|---|---|
| Quadrant | BADHDUFLAG | Total packets | Discarded packets |
| A | 0 | 24787 | 2 |
| B | 0 | 16505 | 2 |
| C | 0 | 15390 | 2 |
| D | 0 | 24738 | 2 |
| Mode M9 | |||
|---|---|---|---|
| Quadrant | BADHDUFLAG | Total packets | Discarded packets |
| A | 0 | 15 | 0 |
| B | 0 | 15 | 0 |
| C | 0 | 15 | 0 |
| D | 0 | 15 | 0 |
| Quadrant | Total seconds | Saturated seconds | Saturation percentage |
|---|---|---|---|
| A | 7295 | 513 | 7.032214% |
| B | 7295 | 319 | 4.372858% |
| C | 7296 | 73 | 1.000548% |
| D | 7296 | 895 | 12.266996% |
Noise dominated data is calculated using 1-second bins in cleaned event files. If a bin has >2000 counts, and if more than 50% of those come from <1% of pixels, then it is considered to be noise-dominated and hence unusable.
| Quadrant | # 1 sec bins | Bins with >0 counts | Bins with >2000 counts | High rate bins dominated by noise | Noise dominated (total time) | Noise dominated (detector-on time) | Marked lightcurve |
|---|---|---|---|---|---|---|---|
| A | 8800 | 7297 | 215 | 215 | 2.44% | 2.95% | 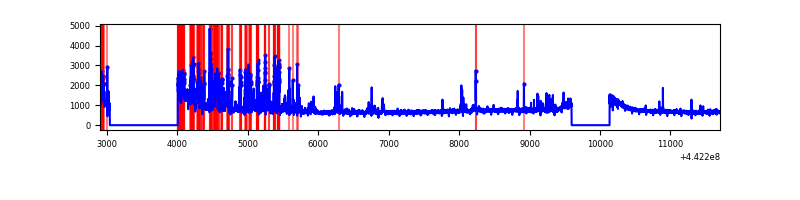 |
| B | 8800 | 7297 | 72 | 72 | 0.82% | 0.99% | 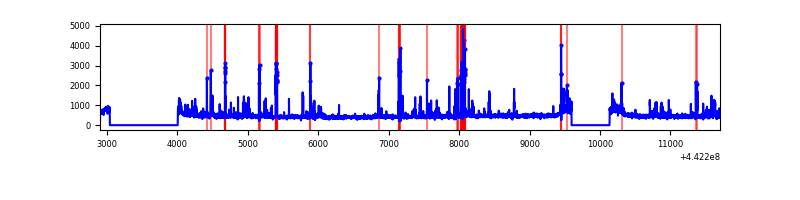 |
| C | 8801 | 7298 | 4 | 4 | 0.05% | 0.05% | 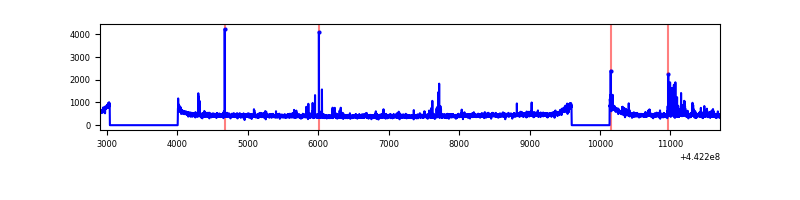 |
| D | 8801 | 7298 | 648 | 648 | 7.36% | 8.88% | 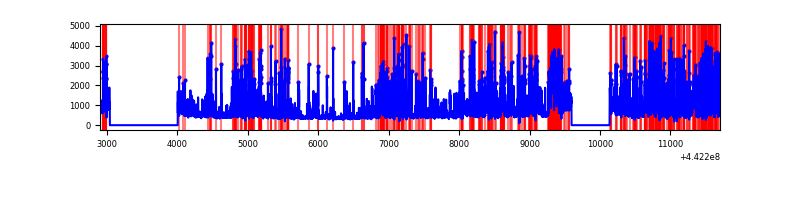 |
Top three noisy pixels from each quadrant. If the there are fewer than three noisy pixels in the level2.evt file, extra rows are filled as -1
| Pixel properties | Quadrant properties | ||||||
|---|---|---|---|---|---|---|---|
| Quadrant | DetID | PixID | Counts | Sigma | Mean | Median | Sigma |
| A | 10 | 83 | 2118464 | 12653.39 | 812 | 794 | 167.4 |
| A | 15 | 223 | 1022857 | 6106.98 | 812 | 794 | 167.4 |
| A | 13 | 248 | 16732 | 95.23 | 812 | 794 | 167.4 |
| B | 0 | 189 | 314449 | 1910.56 | 820 | 791 | 164.2 |
| B | 5 | 255 | 107799 | 651.81 | 820 | 791 | 164.2 |
| B | 0 | 190 | 60424 | 363.24 | 820 | 791 | 164.2 |
| C | 15 | 208 | 79591 | 407.82 | 818 | 822 | 193.1 |
| C | 14 | 254 | 59252 | 302.52 | 818 | 822 | 193.1 |
| C | 3 | 233 | 14541 | 71.03 | 818 | 822 | 193.1 |
| D | 1 | 52 | 1375119 | 7146.45 | 773 | 748 | 192.3 |
| D | 8 | 129 | 1330077 | 6912.24 | 773 | 748 | 192.3 |
| D | 13 | 249 | 528556 | 2744.49 | 773 | 748 | 192.3 |
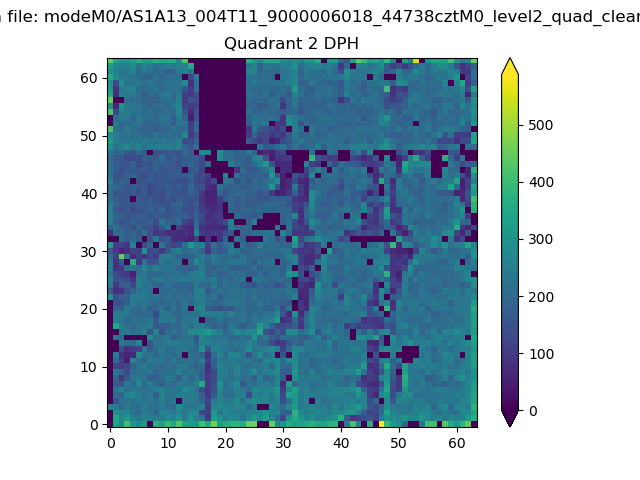
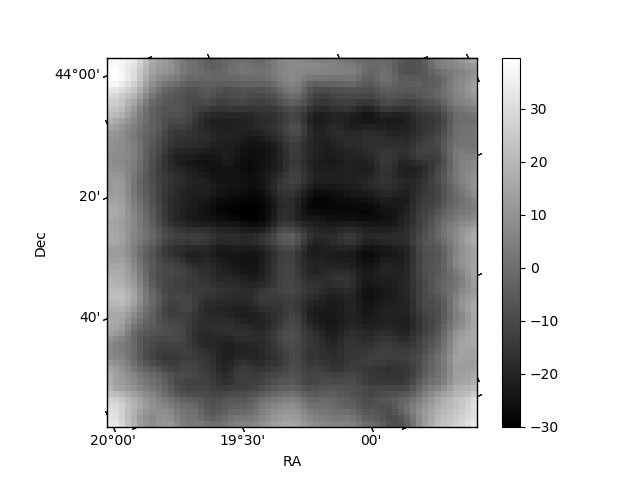
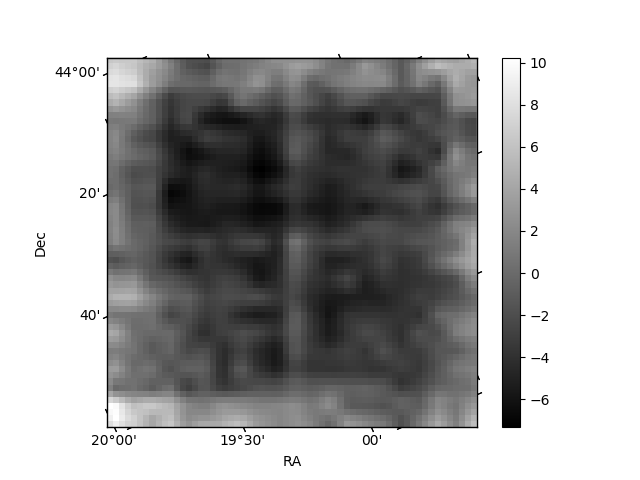
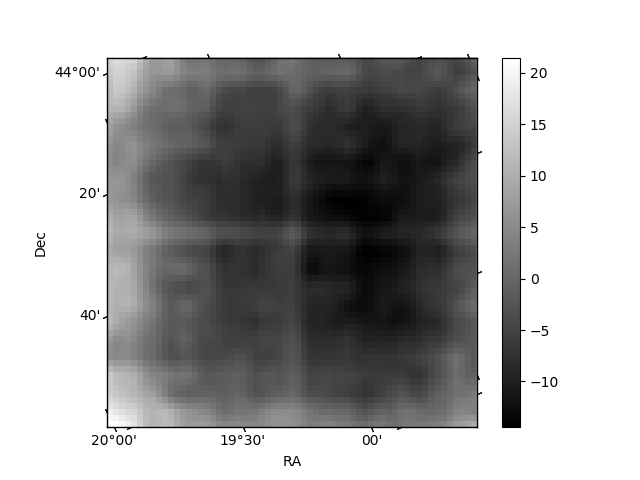
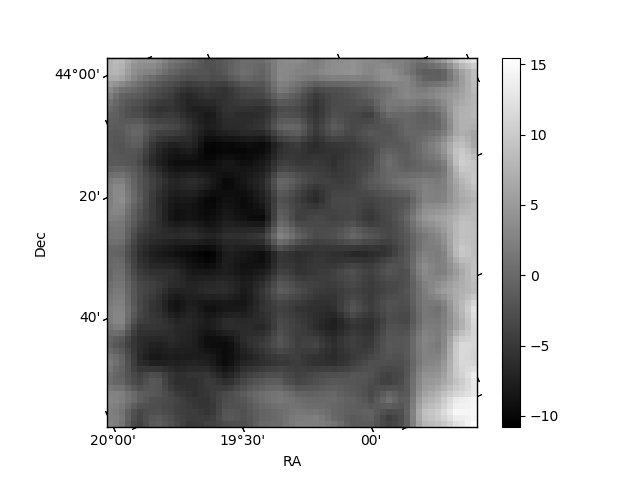
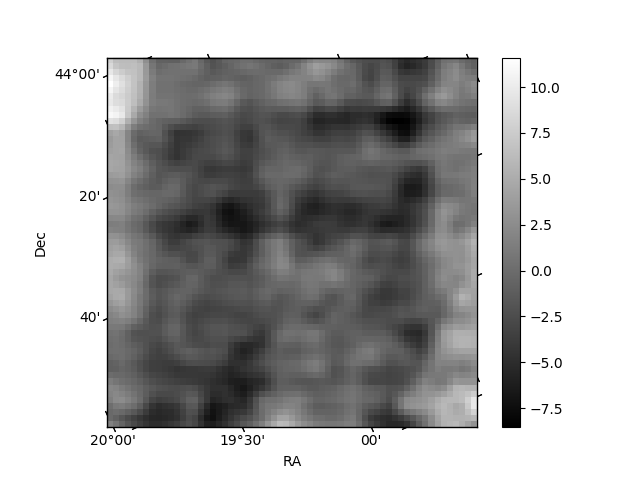
Histogram calculated using DETX and DETY for each event in the final _common_clean file
| Quadrant A | 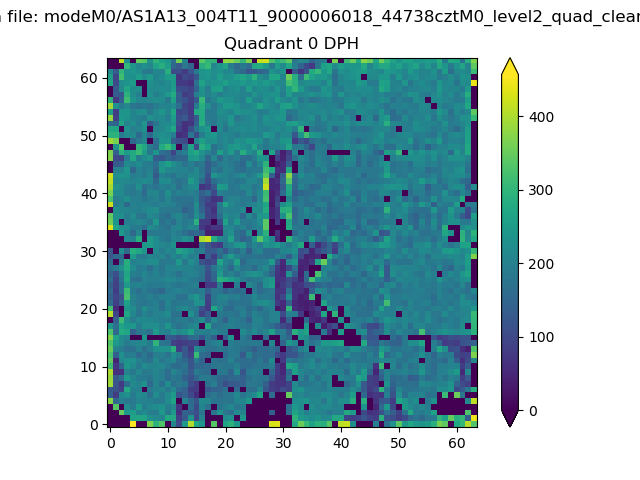 |
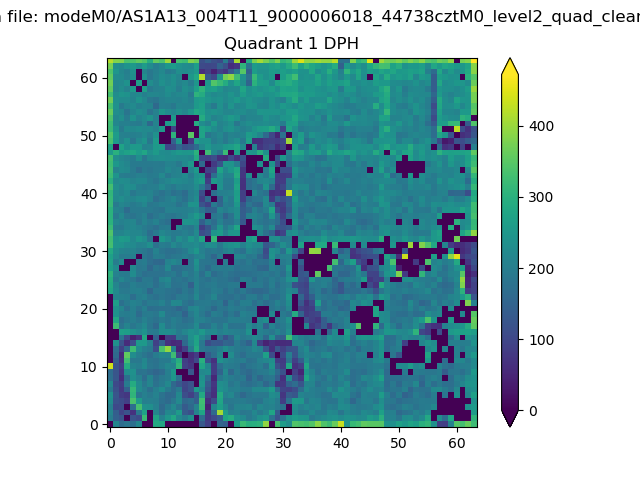 |
Quadrant B |
|---|---|---|---|
| Quadrant D | 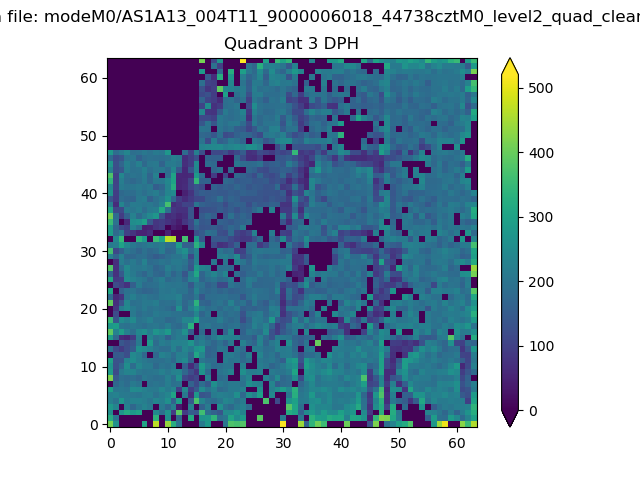 |
 |
Quadrant C |
| Plot type | Count rate plots | Images |
|---|---|---|
| Comparison with Poisson distribution Blue bars denote a histogram of data divided into 1 sec bins. Red curve is a Poisson curve with rate = median count rate of data. |
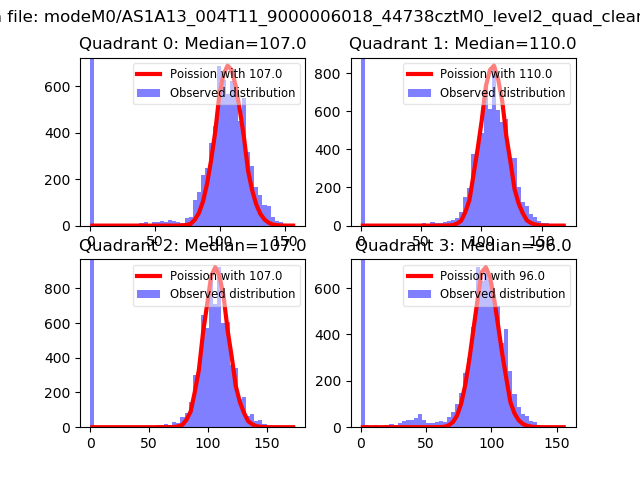 |
 |
| Quadrant-wise count rates Data is divided into 100 sec bins |
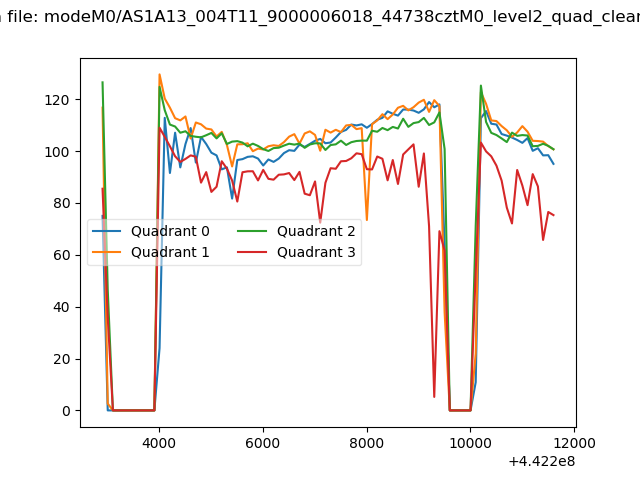 |
|
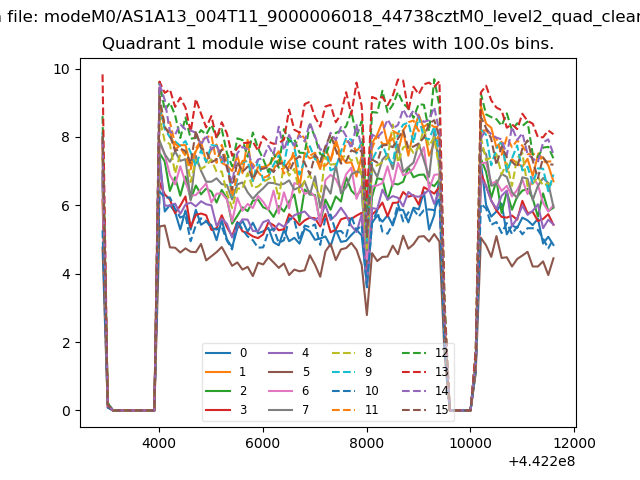
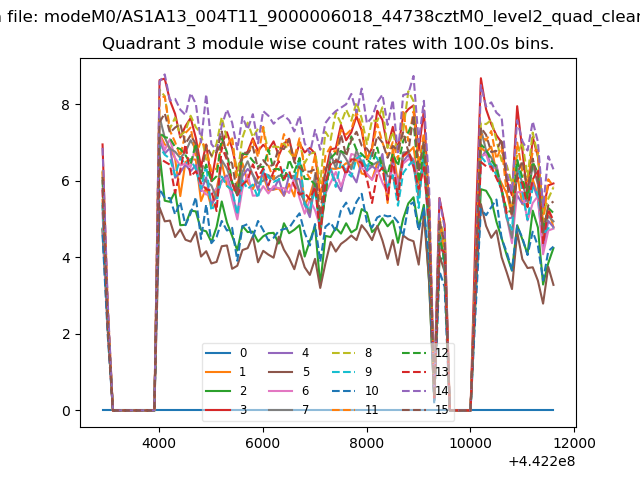
| Module-wise count rates for Quadrant A Data is divided into 100 sec bins |
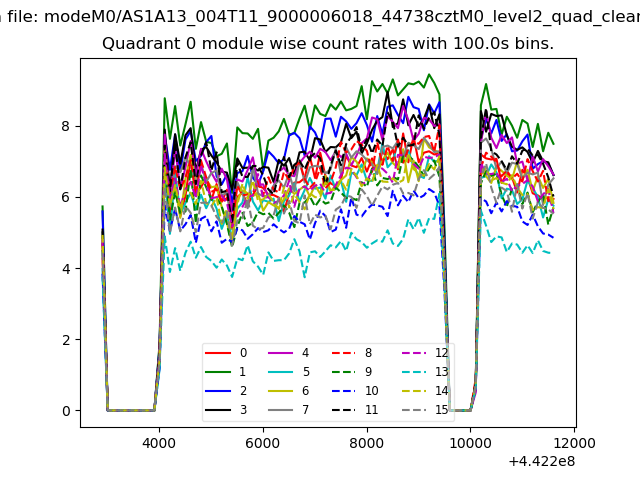 |
 |
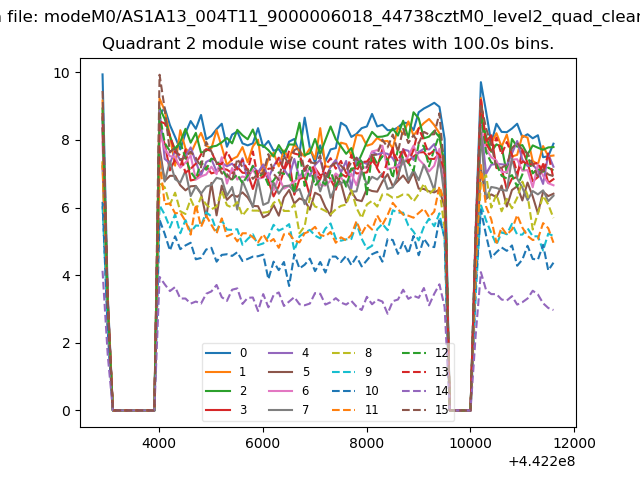
| Module-wise count rates for Quadrant B Data is divided into 100 sec bins |
 |
 |
| Module-wise count rates for Quadrant C Data is divided into 100 sec bins |
 |
 |
| Module-wise count rates for Quadrant D Data is divided into 100 sec bins |
 |
 |
| Parameter | Plot |
|---|---|
| CZT HV Monitor | 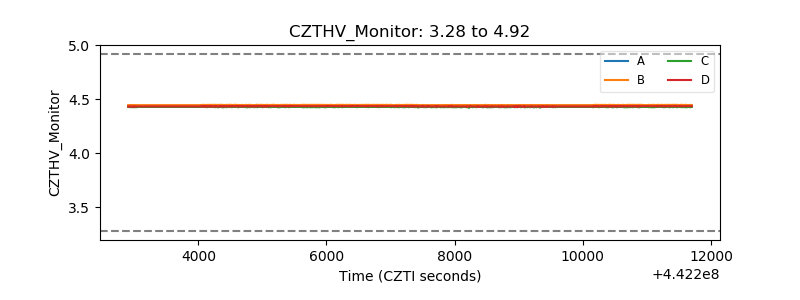 |
| D_VDD | 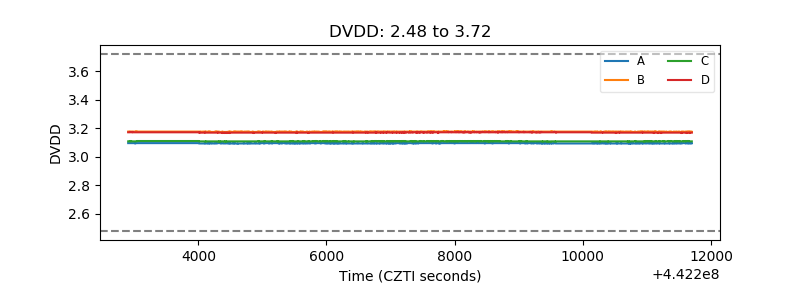 |
| Temperature 1 | 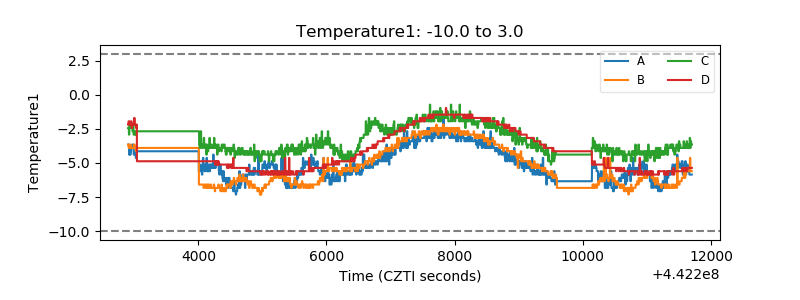 |
| Veto HV Monitor | 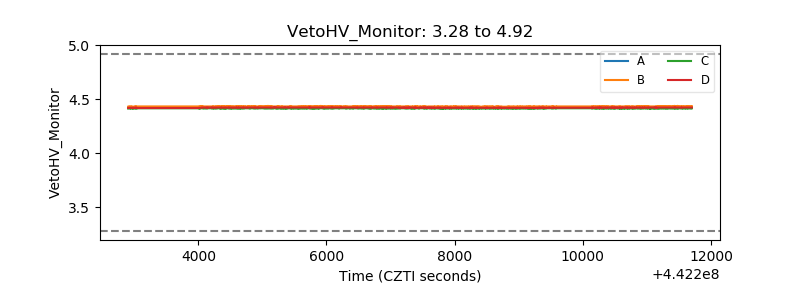 |
| Veto LLD | 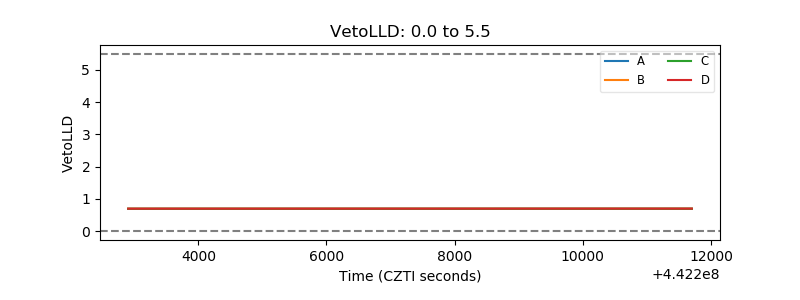 |
| Alpha Counter | 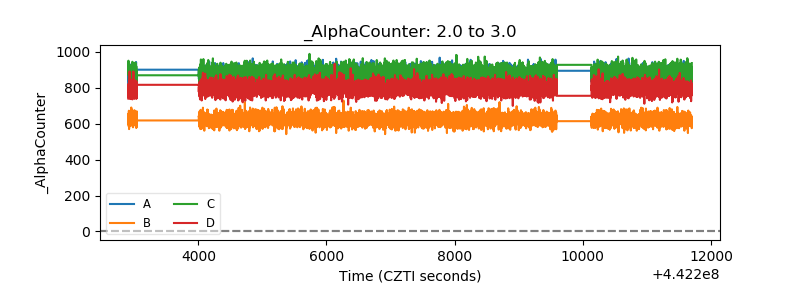 |
| _CPM_Rate | 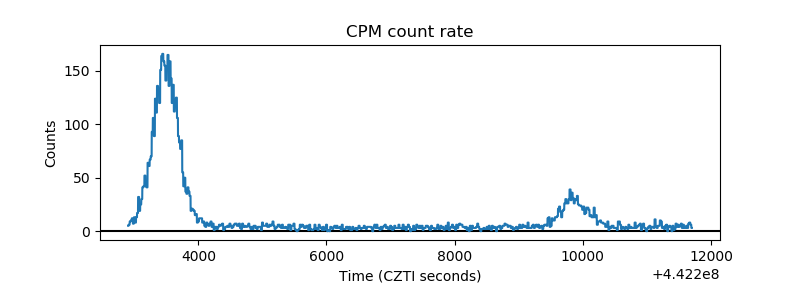 |
| CZT Counter | 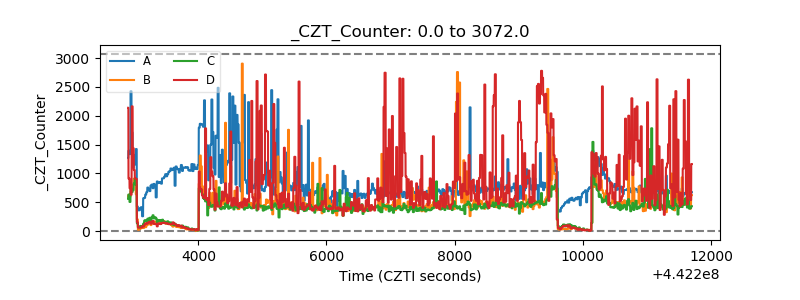 |
| +2.5 Volts monitor | 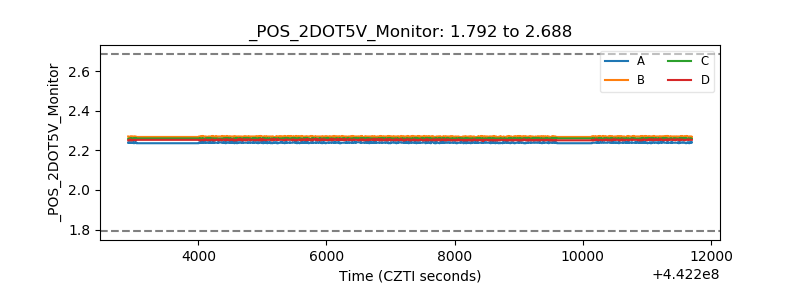 |
| +5 Volts monitor | 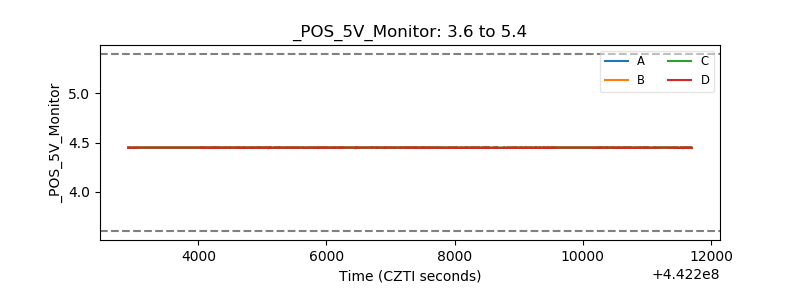 |
| _ROLL_ROT | 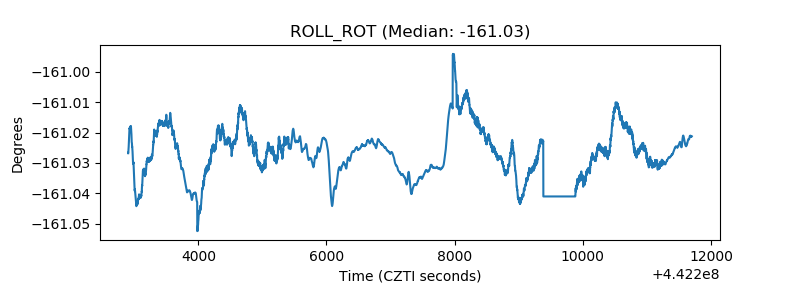 |
| _Roll_DEC | 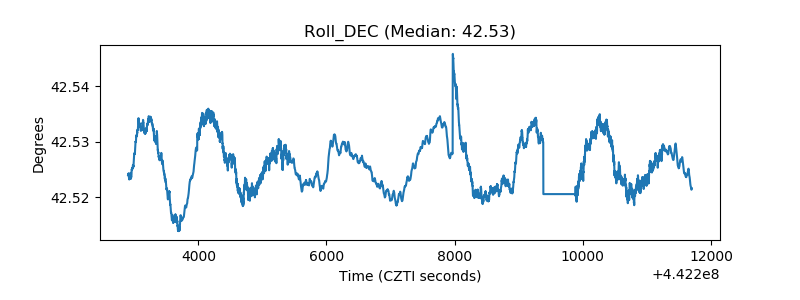 |
| _Roll_RA | 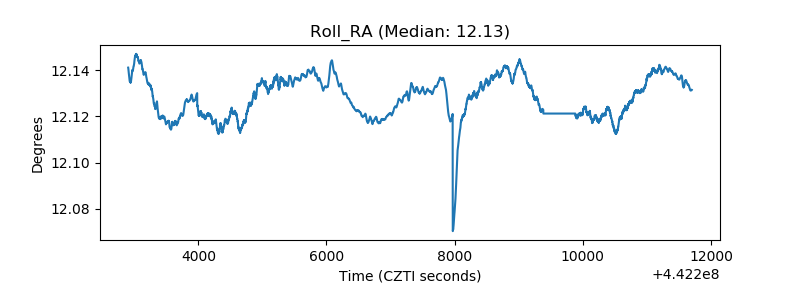 |
| Veto Counter | 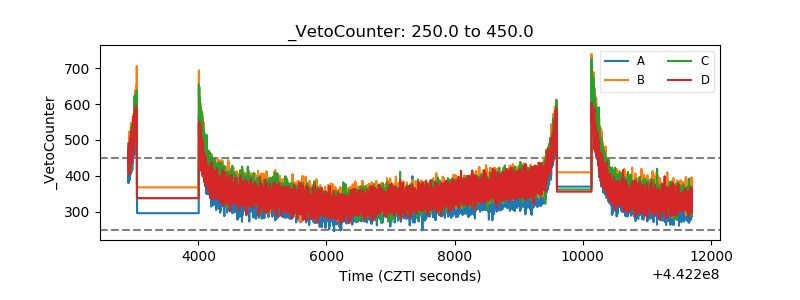 |