| Param | Original file | Final file |
|---|---|---|
| Filename | modeM0/AS1A13_004T11_9000006018_44739cztM0_level2.fits | modeM0/AS1A13_004T11_9000006018_44739cztM0_level2_quad_clean.evt |
| Size (bytes) | 587,813,760 | 123,655,680 |
| Size | 560.6 MB | 117.9 MB |
| Events in quadrant A | 5,666,384 | 826,297 |
| Events in quadrant B | 4,618,804 | 818,400 |
| Events in quadrant C | 3,777,358 | 837,195 |
| Events in quadrant D | 7,080,309 | 709,847 |
| Mode SS | |||
|---|---|---|---|
| Quadrant | BADHDUFLAG | Total packets | Discarded packets |
| A | 0 | 160 | 0 |
| B | 0 | 160 | 0 |
| C | 0 | 160 | 0 |
| D | 0 | 160 | 0 |
| Mode M0 | |||
|---|---|---|---|
| Quadrant | BADHDUFLAG | Total packets | Discarded packets |
| A | 0 | 23861 | 1 |
| B | 0 | 19384 | 1 |
| C | 0 | 17033 | 1 |
| D | 0 | 26537 | 1 |
| Mode M9 | |||
|---|---|---|---|
| Quadrant | BADHDUFLAG | Total packets | Discarded packets |
| A | 0 | 1 | 0 |
| B | 0 | 2 | 0 |
| C | 0 | 2 | 0 |
| D | 0 | 2 | 0 |
| Quadrant | Total seconds | Saturated seconds | Saturation percentage |
|---|---|---|---|
| A | 7940 | 252 | 3.173804% |
| B | 7940 | 566 | 7.128463% |
| C | 7940 | 78 | 0.982368% |
| D | 7940 | 905 | 11.397985% |
Noise dominated data is calculated using 1-second bins in cleaned event files. If a bin has >2000 counts, and if more than 50% of those come from <1% of pixels, then it is considered to be noise-dominated and hence unusable.
| Quadrant | # 1 sec bins | Bins with >0 counts | Bins with >2000 counts | High rate bins dominated by noise | Noise dominated (total time) | Noise dominated (detector-on time) | Marked lightcurve |
|---|---|---|---|---|---|---|---|
| A | 7940 | 7940 | 2 | 2 | 0.03% | 0.03% | 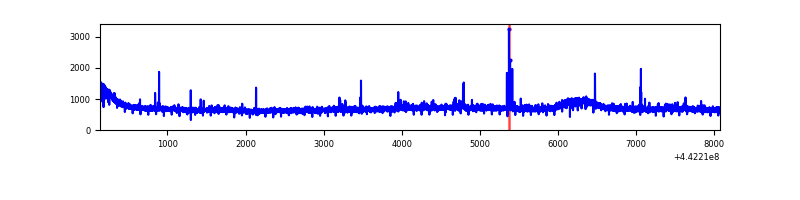 |
| B | 7940 | 7940 | 211 | 211 | 2.66% | 2.66% | 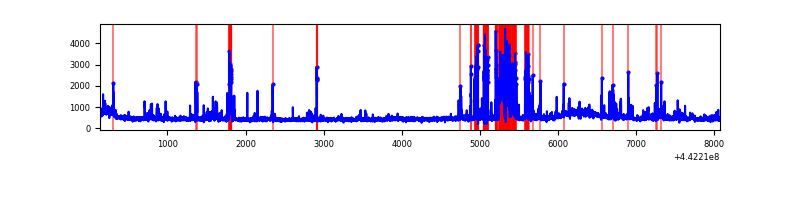 |
| C | 7940 | 7940 | 9 | 9 | 0.11% | 0.11% | 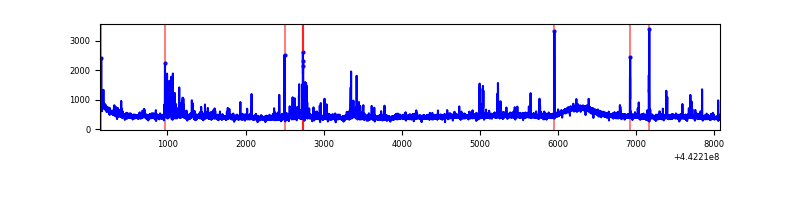 |
| D | 7940 | 7940 | 655 | 655 | 8.25% | 8.25% | 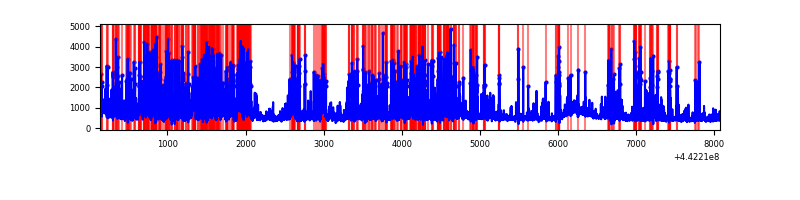 |
Top three noisy pixels from each quadrant. If the there are fewer than three noisy pixels in the level2.evt file, extra rows are filled as -1
| Pixel properties | Quadrant properties | ||||||
|---|---|---|---|---|---|---|---|
| Quadrant | DetID | PixID | Counts | Sigma | Mean | Median | Sigma |
| A | 10 | 83 | 2130447 | 11522.29 | 892 | 869 | 184.8 |
| A | 13 | 248 | 28048 | 147.05 | 892 | 869 | 184.8 |
| A | 15 | 223 | 22807 | 118.7 | 892 | 869 | 184.8 |
| B | 0 | 189 | 799807 | 4577.16 | 881 | 851 | 174.6 |
| B | 5 | 255 | 111932 | 636.37 | 881 | 851 | 174.6 |
| B | 0 | 190 | 82652 | 468.63 | 881 | 851 | 174.6 |
| C | 15 | 208 | 192971 | 922.09 | 887 | 888 | 208.3 |
| C | 14 | 254 | 71715 | 340.0 | 887 | 888 | 208.3 |
| C | 5 | 128 | 16214 | 73.57 | 887 | 888 | 208.3 |
| D | 1 | 52 | 1800094 | 8549.16 | 844 | 817 | 210.5 |
| D | 8 | 129 | 1147107 | 5446.53 | 844 | 817 | 210.5 |
| D | 13 | 249 | 442464 | 2098.46 | 844 | 817 | 210.5 |
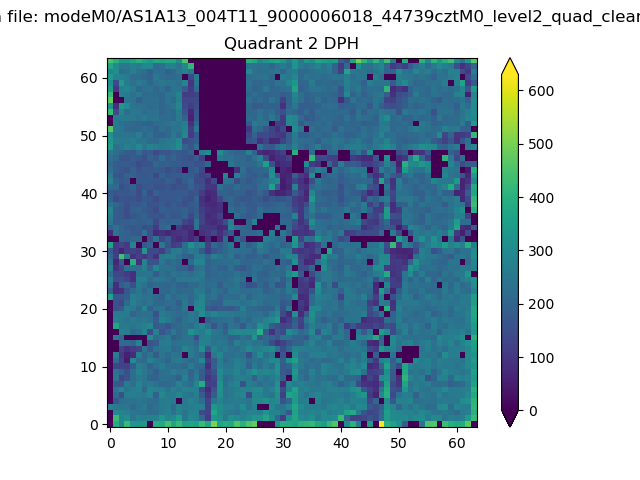
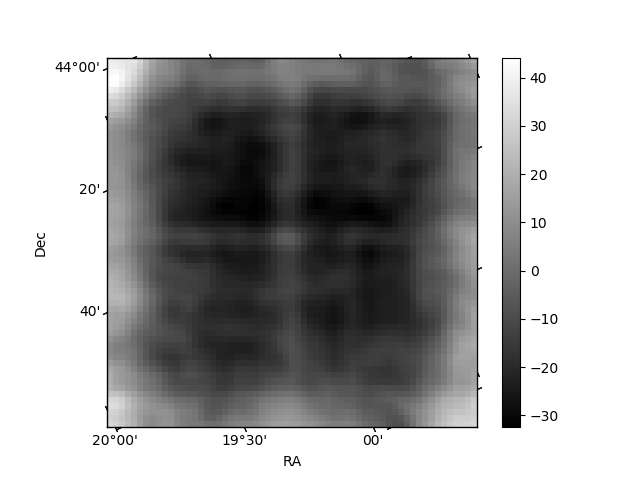
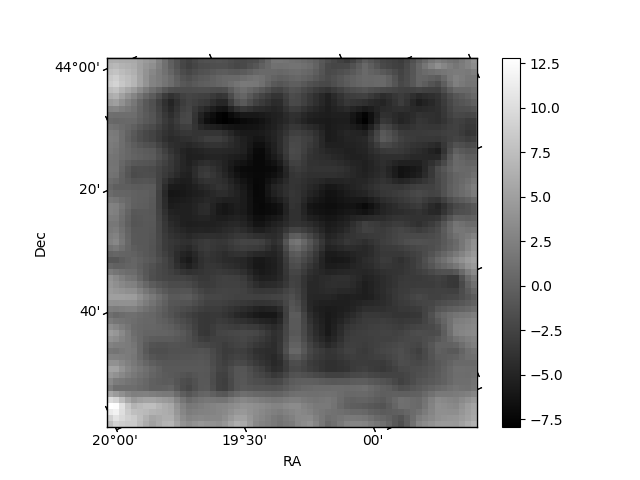
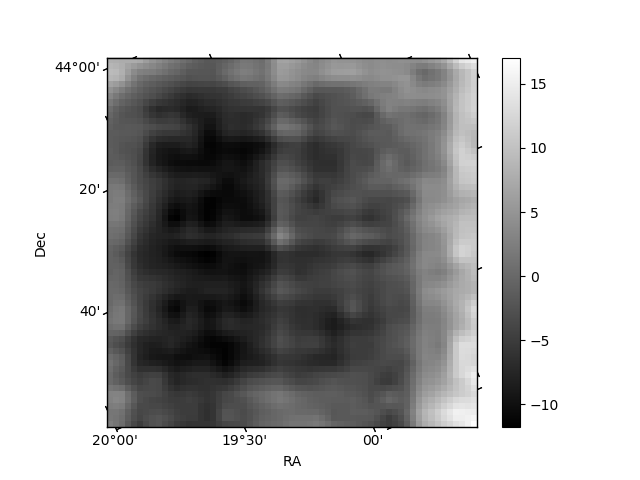
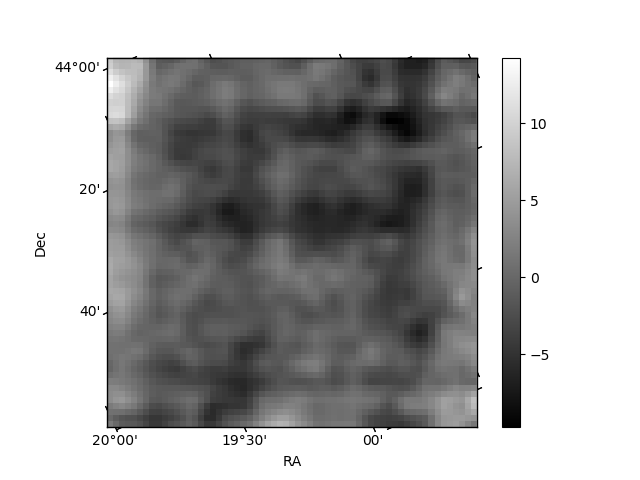
Histogram calculated using DETX and DETY for each event in the final _common_clean file
| Quadrant A | 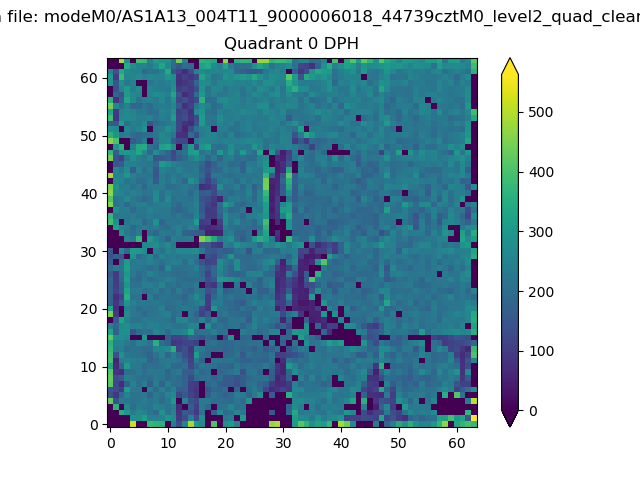 |
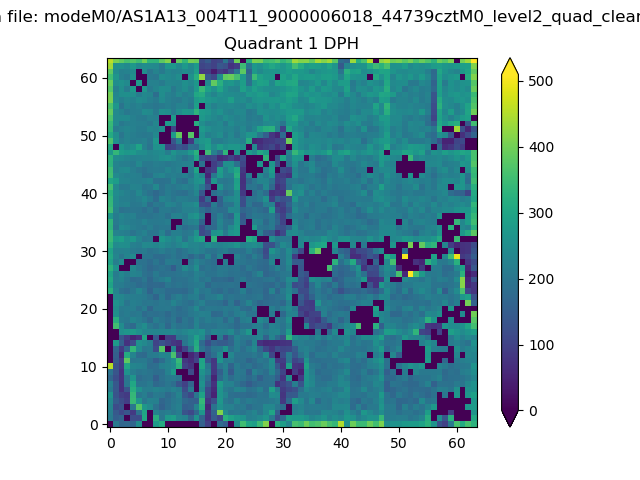 |
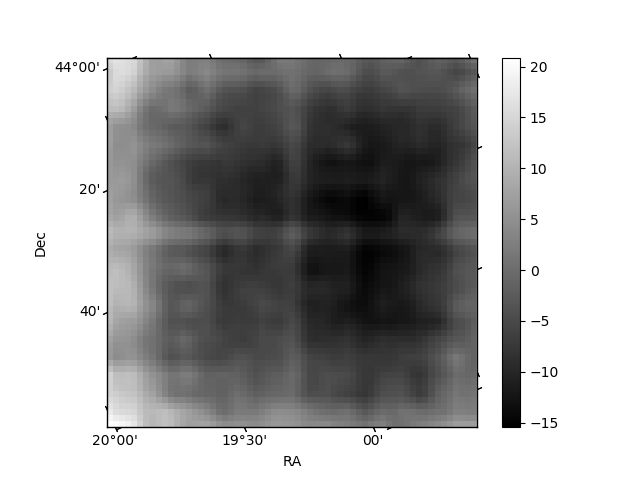
Quadrant B |
|---|---|---|---|
| Quadrant D | 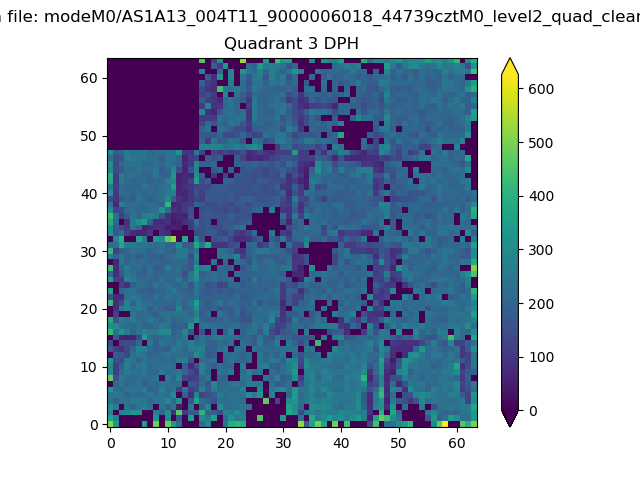 |
 |
Quadrant C |
| Plot type | Count rate plots | Images |
|---|---|---|
| Comparison with Poisson distribution Blue bars denote a histogram of data divided into 1 sec bins. Red curve is a Poisson curve with rate = median count rate of data. |
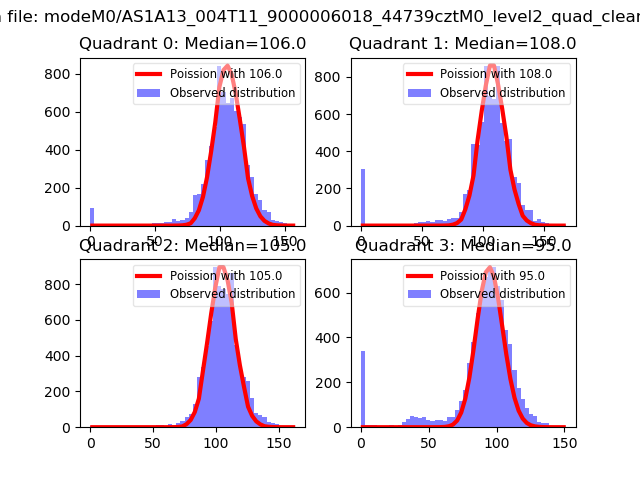 |
 |
| Quadrant-wise count rates Data is divided into 100 sec bins |
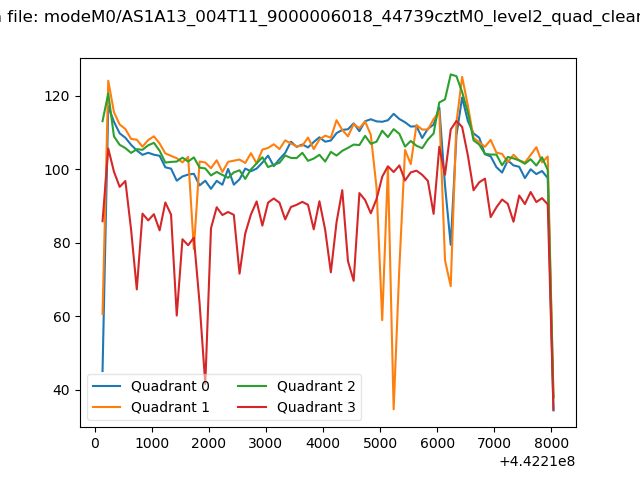 |
|
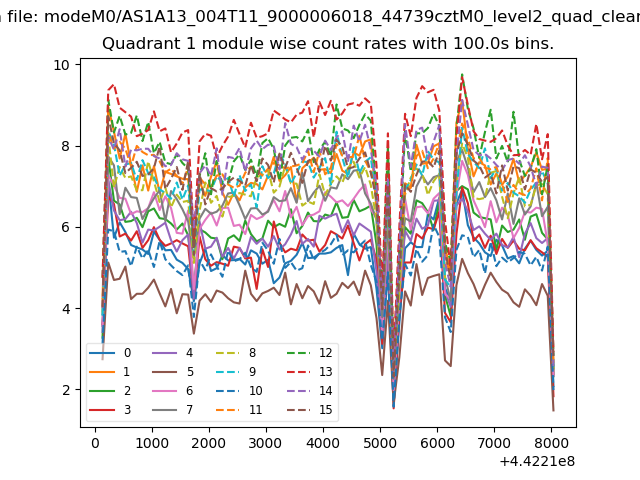
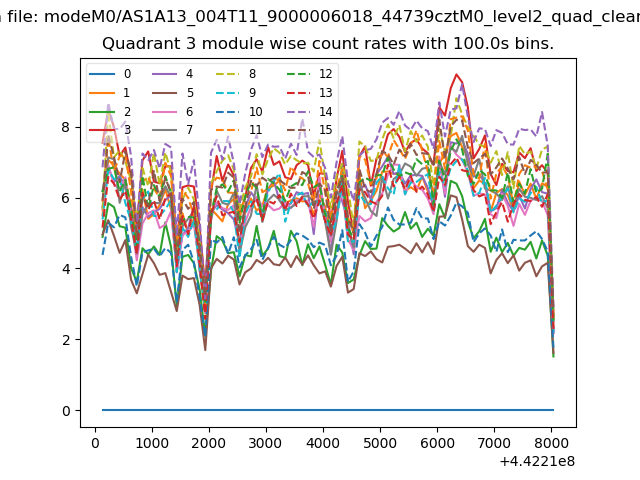
| Module-wise count rates for Quadrant A Data is divided into 100 sec bins |
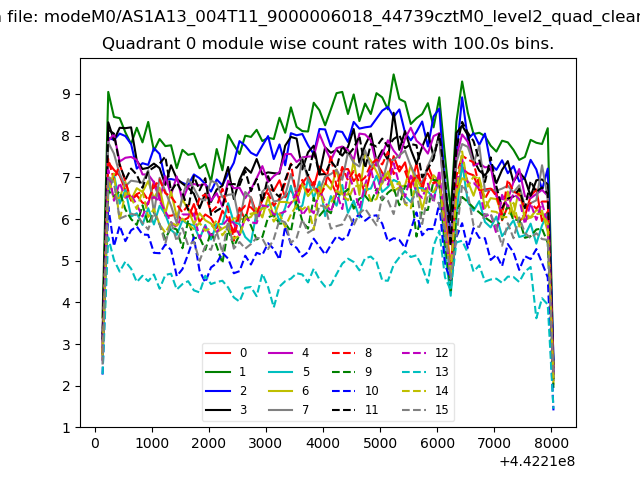 |
 |
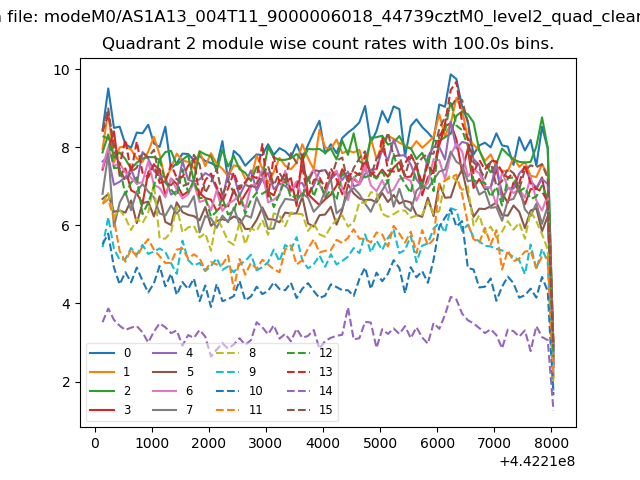
| Module-wise count rates for Quadrant B Data is divided into 100 sec bins |
 |
 |
| Module-wise count rates for Quadrant C Data is divided into 100 sec bins |
 |
 |
| Module-wise count rates for Quadrant D Data is divided into 100 sec bins |
 |
 |
| Parameter | Plot |
|---|---|
| CZT HV Monitor | 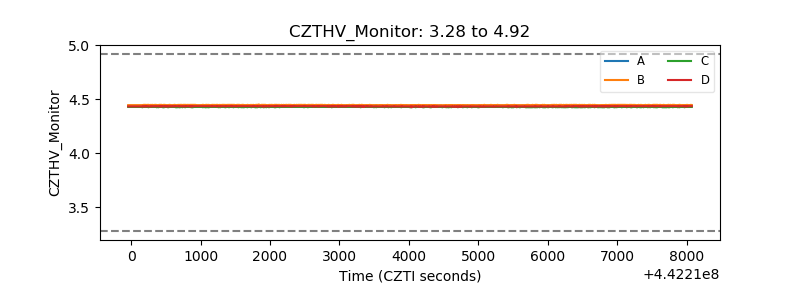 |
| D_VDD | 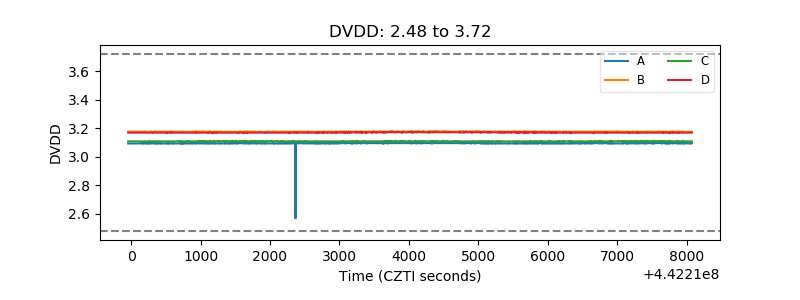 |
| Temperature 1 | 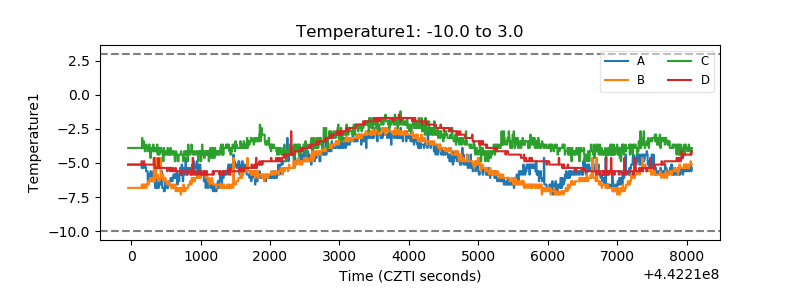 |
| Veto HV Monitor | 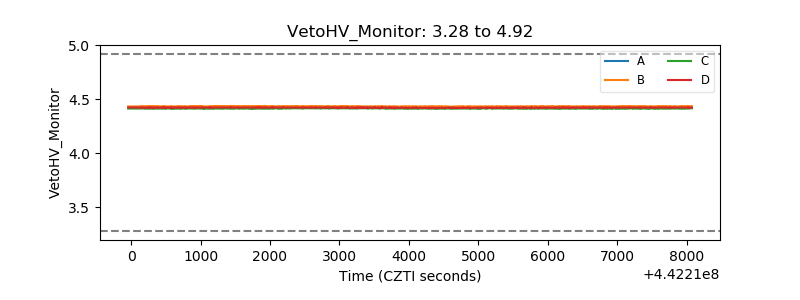 |
| Veto LLD | 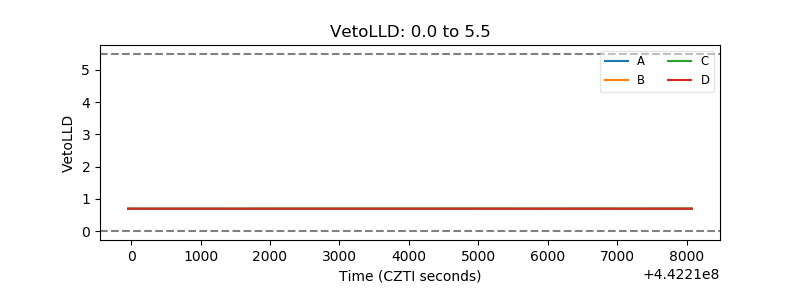 |
| Alpha Counter | 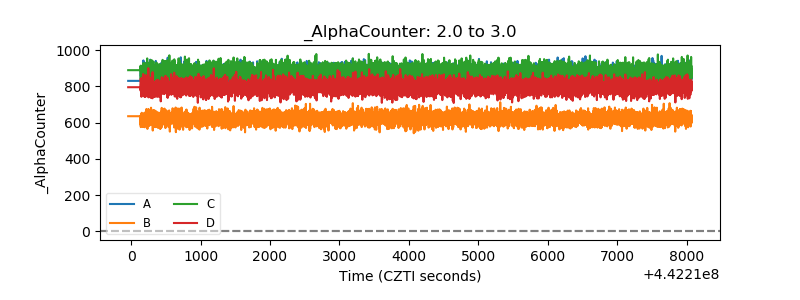 |
| _CPM_Rate | 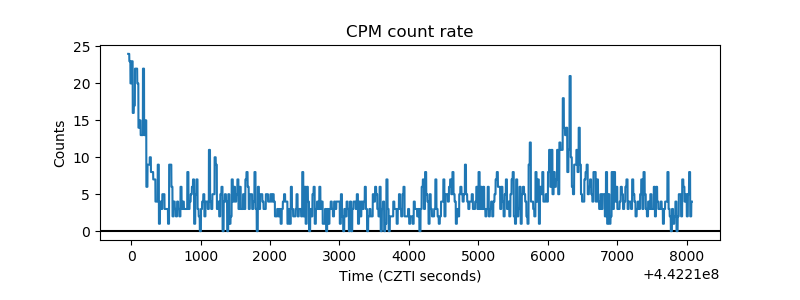 |
| CZT Counter | 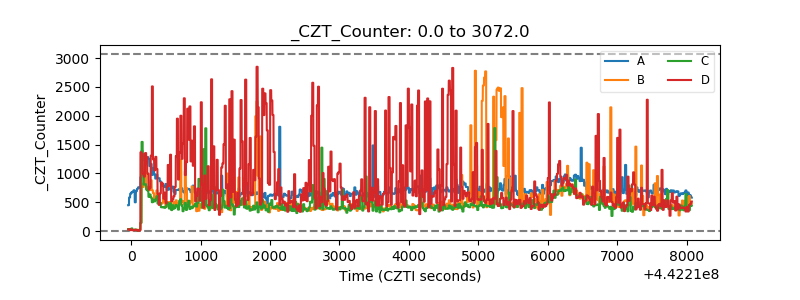 |
| +2.5 Volts monitor | 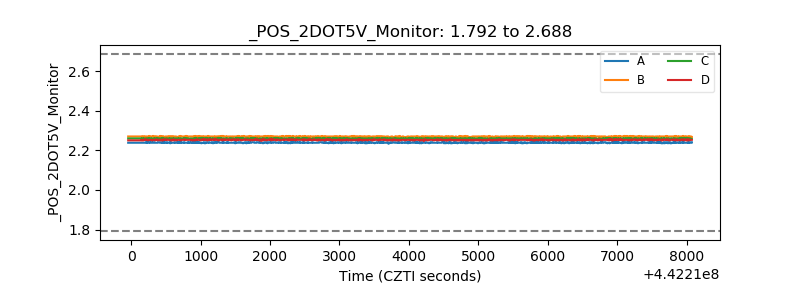 |
| +5 Volts monitor | 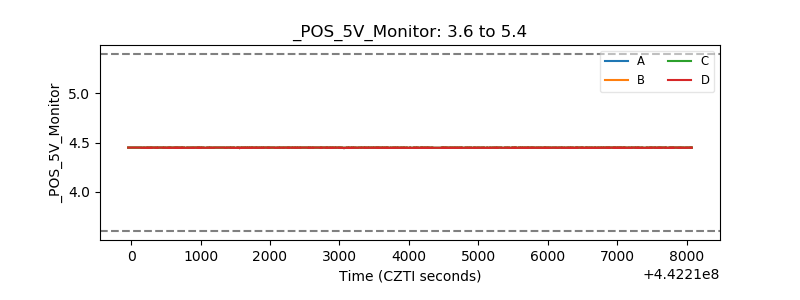 |
| _ROLL_ROT | 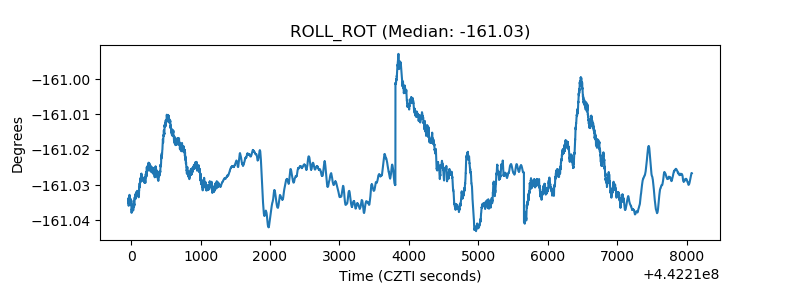 |
| _Roll_DEC | 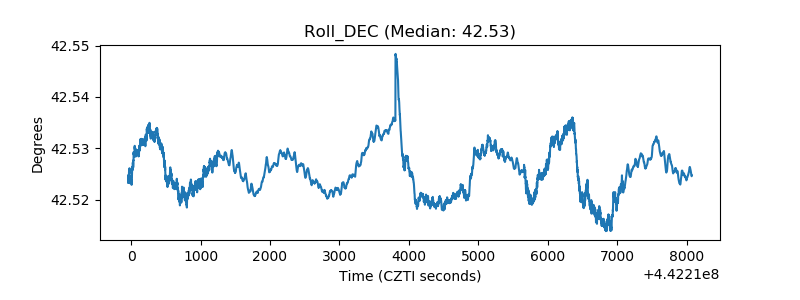 |
| _Roll_RA | 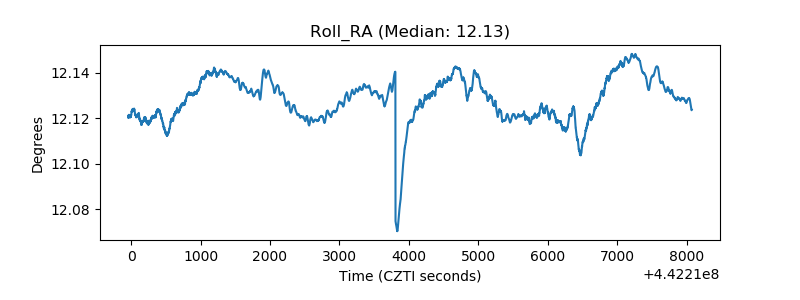 |
| Veto Counter | 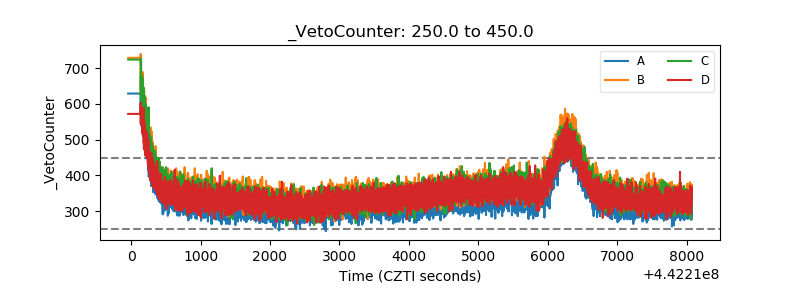 |