| Param | Original file | Final file |
|---|---|---|
| Filename | modeM0/AS1A13_004T11_9000006018_44740cztM0_level2.fits | modeM0/AS1A13_004T11_9000006018_44740cztM0_level2_quad_clean.evt |
| Size (bytes) | 575,409,600 | 126,192,960 |
| Size | 548.8 MB | 120.3 MB |
| Events in quadrant A | 5,678,121 | 847,795 |
| Events in quadrant B | 4,201,104 | 870,352 |
| Events in quadrant C | 3,666,512 | 847,037 |
| Events in quadrant D | 7,126,021 | 693,166 |
| Mode SS | |||
|---|---|---|---|
| Quadrant | BADHDUFLAG | Total packets | Discarded packets |
| A | 0 | 162 | 0 |
| B | 0 | 162 | 0 |
| C | 0 | 162 | 0 |
| D | 0 | 162 | 0 |
| Mode M0 | |||
|---|---|---|---|
| Quadrant | BADHDUFLAG | Total packets | Discarded packets |
| A | 0 | 24152 | 2 |
| B | 0 | 18208 | 0 |
| C | 0 | 16954 | 1 |
| D | 0 | 26892 | 0 |
| Quadrant | Total seconds | Saturated seconds | Saturation percentage |
|---|---|---|---|
| A | 8090 | 142 | 1.755253% |
| B | 8092 | 195 | 2.409787% |
| C | 8091 | 38 | 0.469658% |
| D | 8091 | 1045 | 12.915585% |
Noise dominated data is calculated using 1-second bins in cleaned event files. If a bin has >2000 counts, and if more than 50% of those come from <1% of pixels, then it is considered to be noise-dominated and hence unusable.
| Quadrant | # 1 sec bins | Bins with >0 counts | Bins with >2000 counts | High rate bins dominated by noise | Noise dominated (total time) | Noise dominated (detector-on time) | Marked lightcurve |
|---|---|---|---|---|---|---|---|
| A | 8091 | 8091 | 13 | 13 | 0.16% | 0.16% | 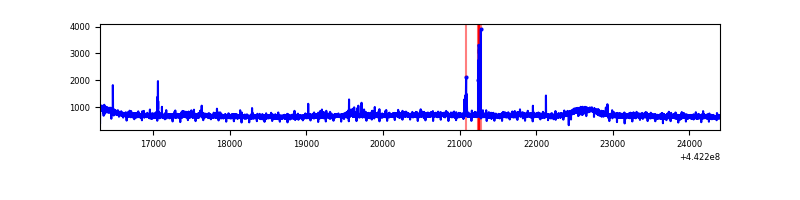 |
| B | 8092 | 8092 | 30 | 30 | 0.37% | 0.37% | 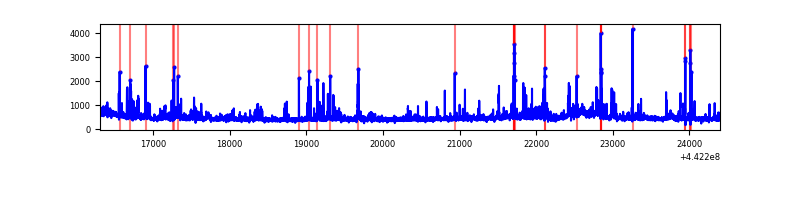 |
| C | 8091 | 8091 | 15 | 15 | 0.19% | 0.19% | 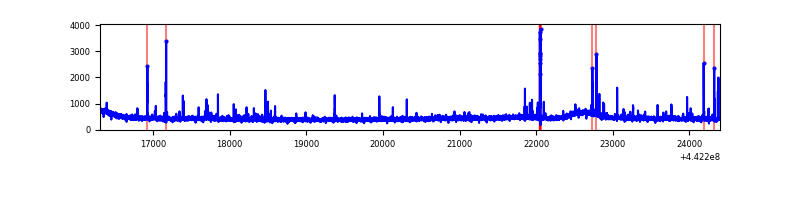 |
| D | 8091 | 8091 | 868 | 868 | 10.73% | 10.73% | 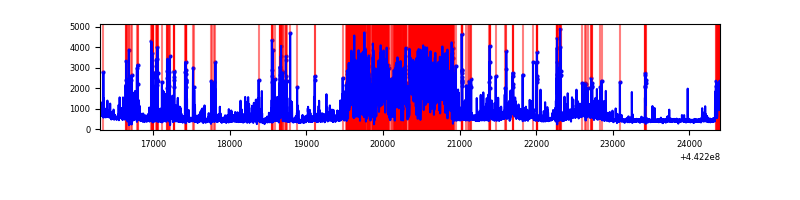 |
Top three noisy pixels from each quadrant. If the there are fewer than three noisy pixels in the level2.evt file, extra rows are filled as -1
| Pixel properties | Quadrant properties | ||||||
|---|---|---|---|---|---|---|---|
| Quadrant | DetID | PixID | Counts | Sigma | Mean | Median | Sigma |
| A | 10 | 83 | 2072901 | 10956.31 | 905 | 883 | 189.1 |
| A | 13 | 248 | 55676 | 289.73 | 905 | 883 | 189.1 |
| A | 15 | 223 | 29969 | 153.8 | 905 | 883 | 189.1 |
| B | 0 | 189 | 294472 | 1651.84 | 901 | 870 | 177.7 |
| B | 5 | 255 | 102128 | 569.69 | 901 | 870 | 177.7 |
| B | 0 | 190 | 76776 | 427.06 | 901 | 870 | 177.7 |
| C | 14 | 254 | 123002 | 586.19 | 890 | 894 | 208.3 |
| C | 3 | 233 | 31504 | 146.95 | 890 | 894 | 208.3 |
| C | 1 | 3 | 14641 | 65.99 | 890 | 894 | 208.3 |
| D | 12 | 233 | 1397107 | 6581.1 | 843 | 816 | 212.2 |
| D | 1 | 52 | 1172698 | 5523.4 | 843 | 816 | 212.2 |
| D | 13 | 249 | 597815 | 2813.82 | 843 | 816 | 212.2 |
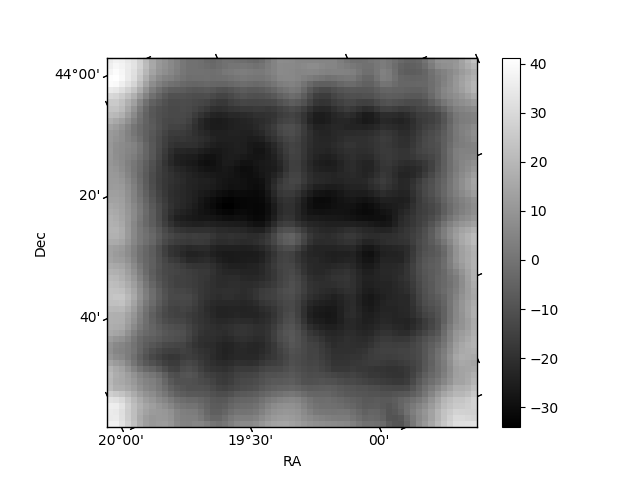
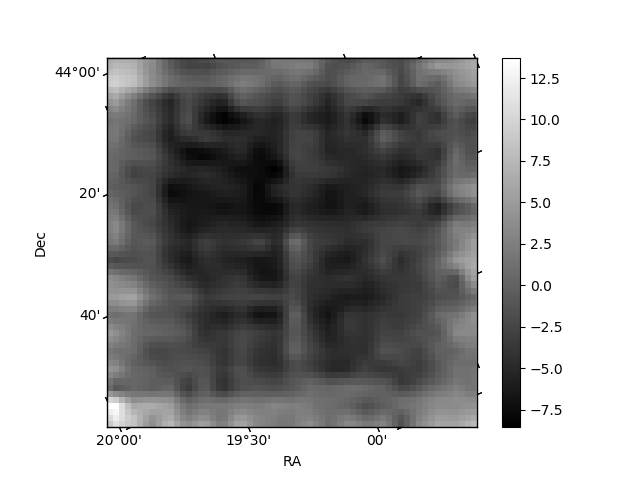
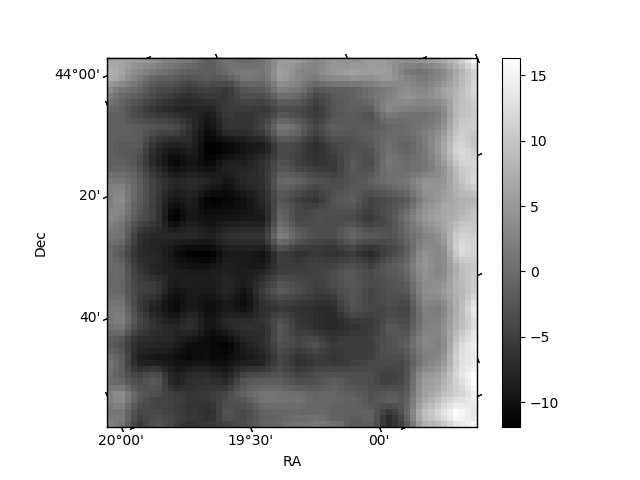
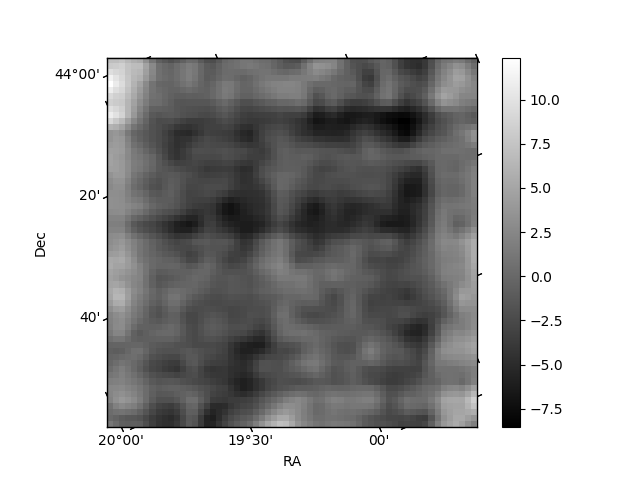
Histogram calculated using DETX and DETY for each event in the final _common_clean file
| Quadrant A | 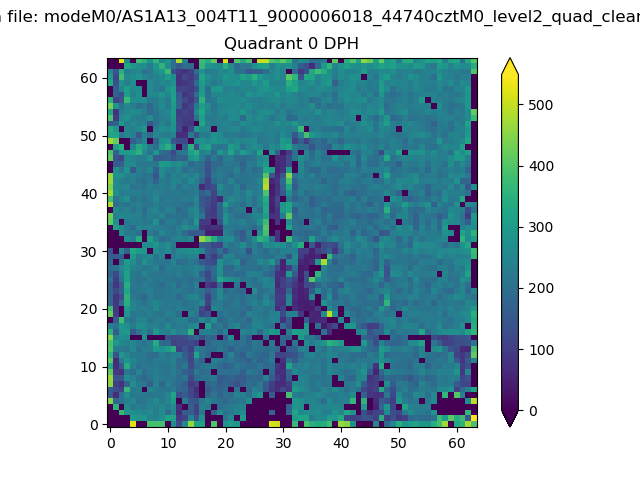 |
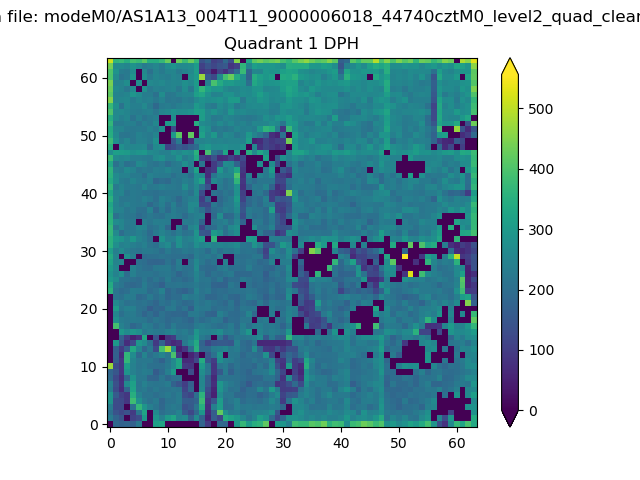 |
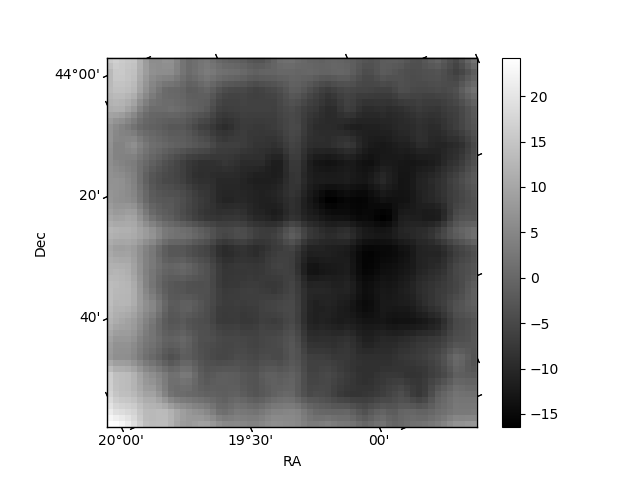
Quadrant B |
|---|---|---|---|
| Quadrant D | 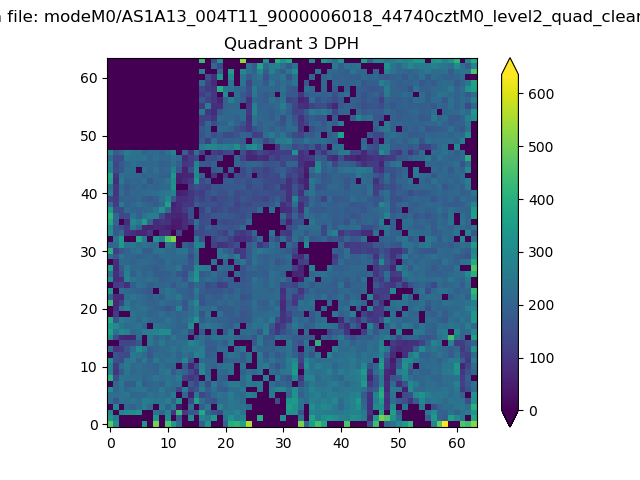 |
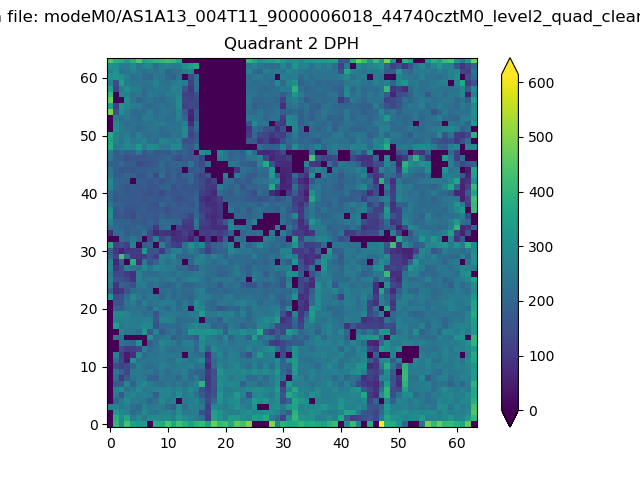 |
Quadrant C |
| Plot type | Count rate plots | Images |
|---|---|---|
| Comparison with Poisson distribution Blue bars denote a histogram of data divided into 1 sec bins. Red curve is a Poisson curve with rate = median count rate of data. |
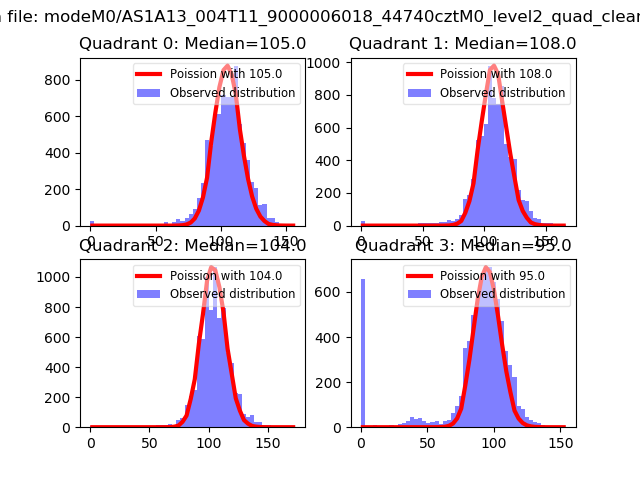 |
 |
| Quadrant-wise count rates Data is divided into 100 sec bins |
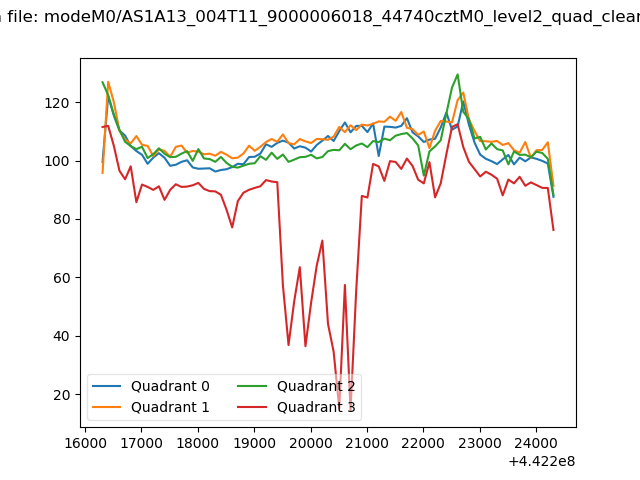 |
|
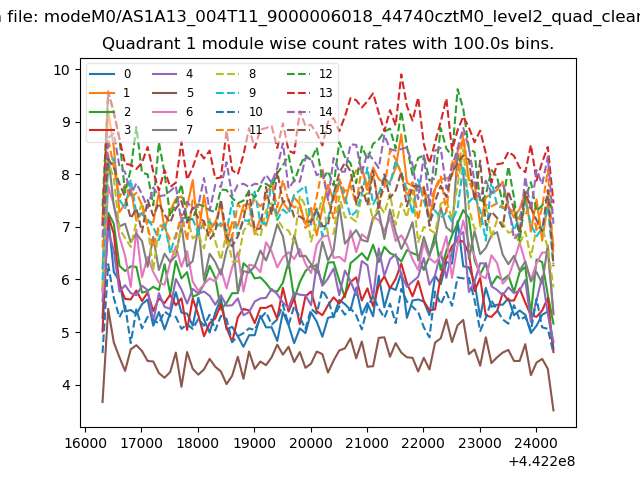
| Module-wise count rates for Quadrant A Data is divided into 100 sec bins |
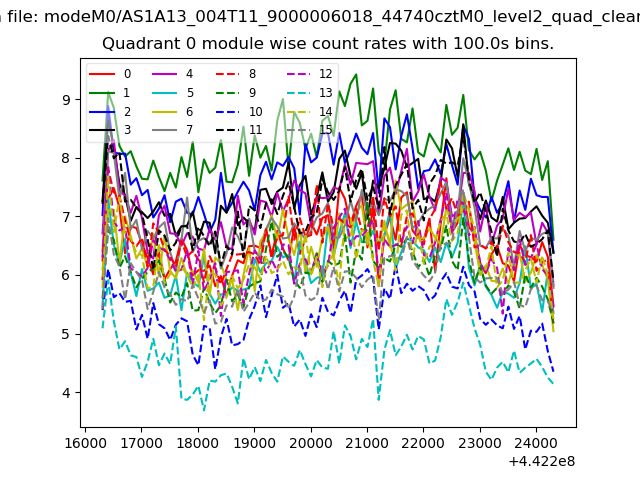 |
 |
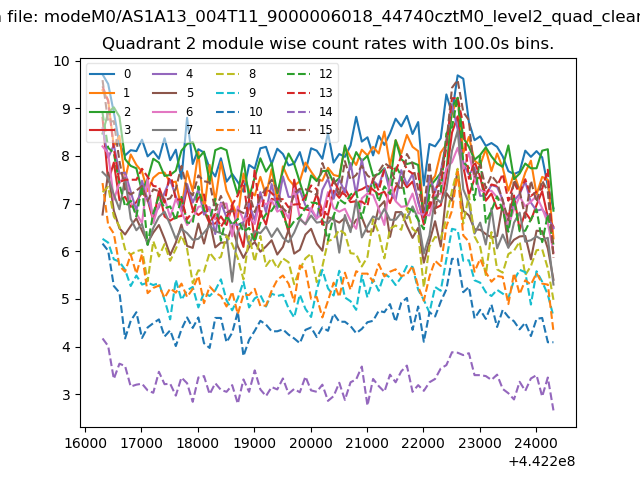
| Module-wise count rates for Quadrant B Data is divided into 100 sec bins |
 |
 |
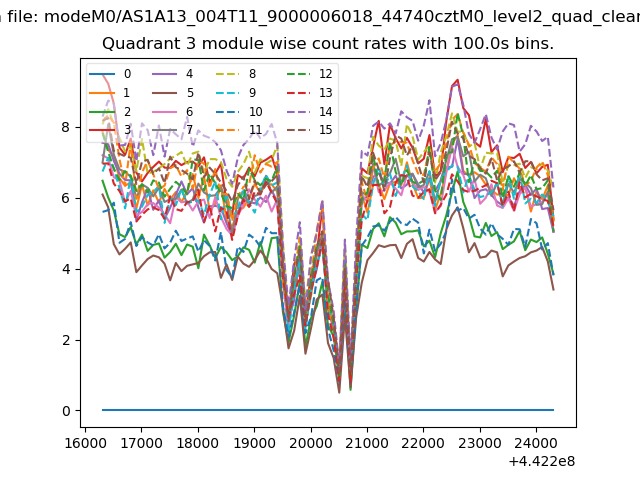
| Module-wise count rates for Quadrant C Data is divided into 100 sec bins |
 |
 |
| Module-wise count rates for Quadrant D Data is divided into 100 sec bins |
 |
 |
| Parameter | Plot |
|---|---|
| CZT HV Monitor | 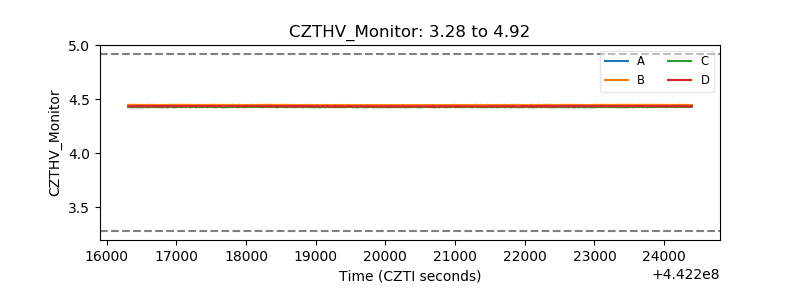 |
| D_VDD | 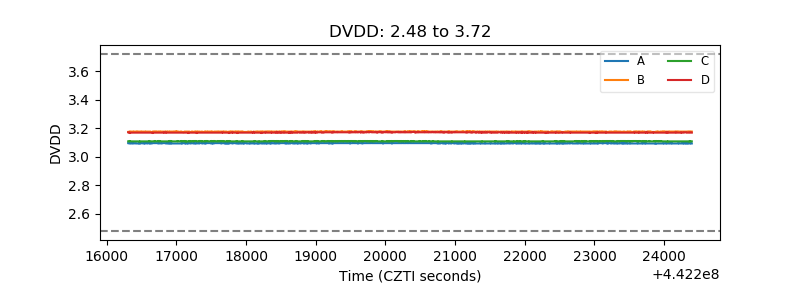 |
| Temperature 1 | 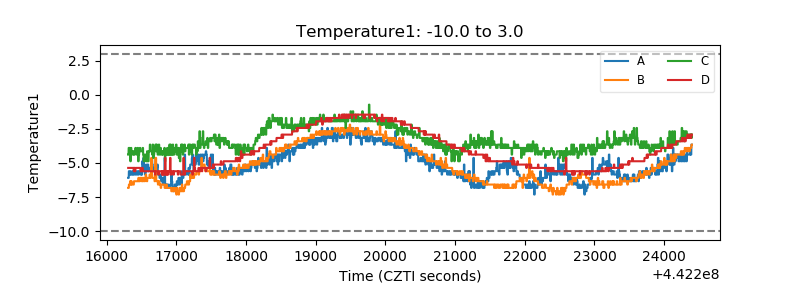 |
| Veto HV Monitor | 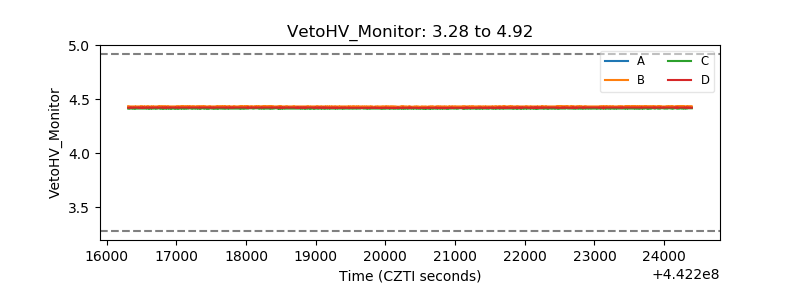 |
| Veto LLD | 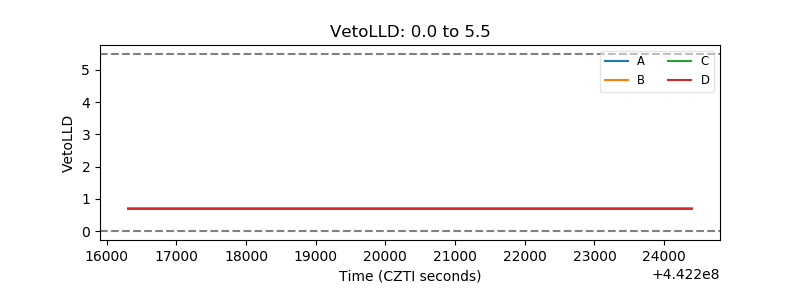 |
| Alpha Counter | 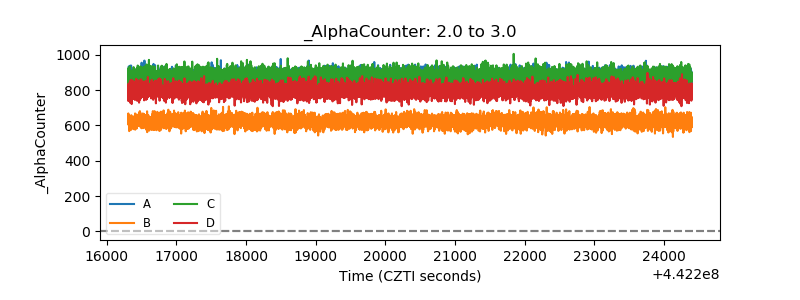 |
| _CPM_Rate | 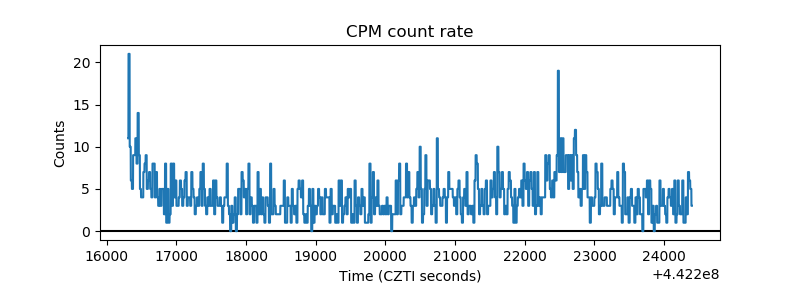 |
| CZT Counter | 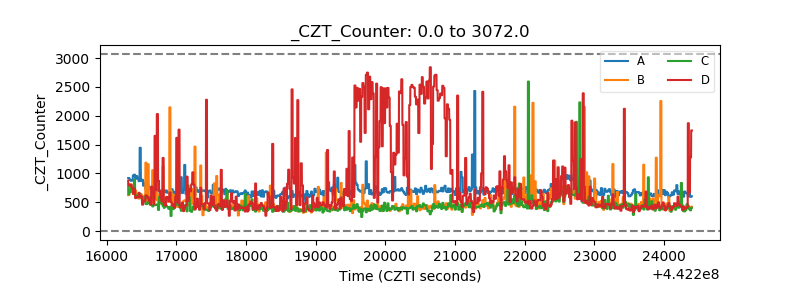 |
| +2.5 Volts monitor | 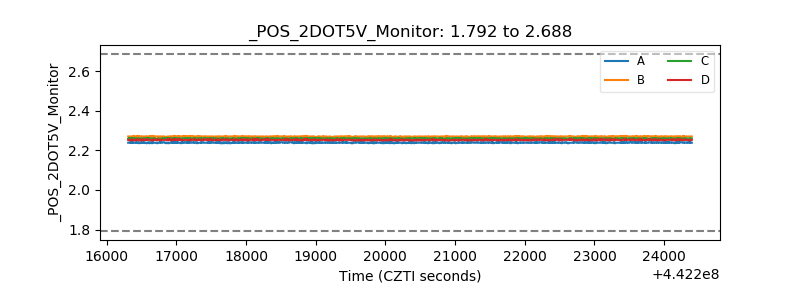 |
| +5 Volts monitor | 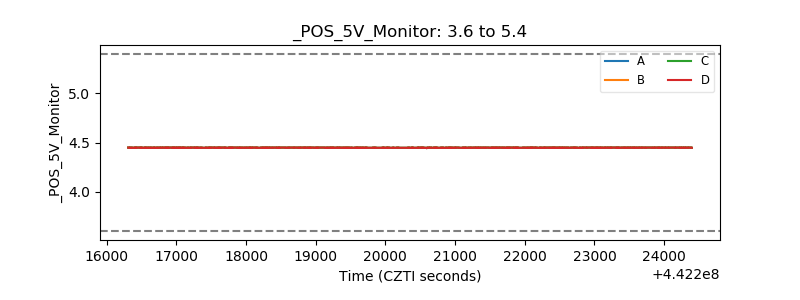 |
| _ROLL_ROT | 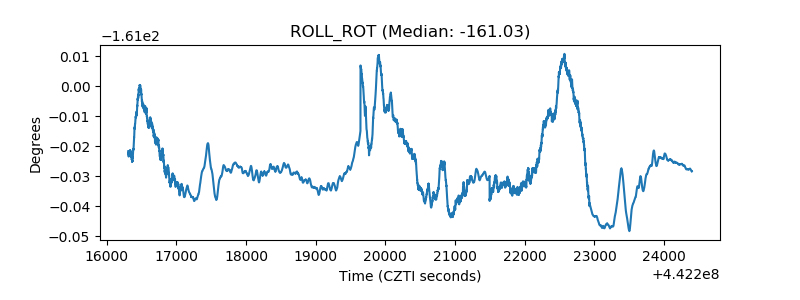 |
| _Roll_DEC | 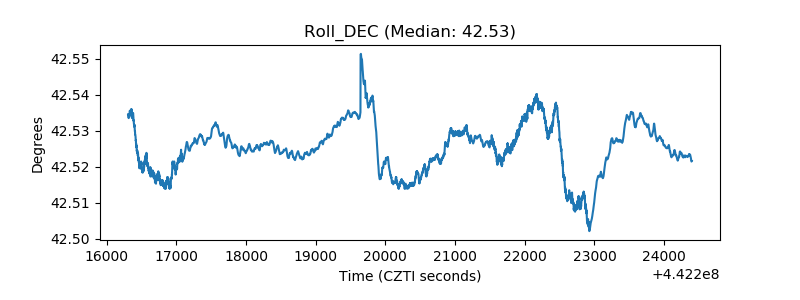 |
| _Roll_RA | 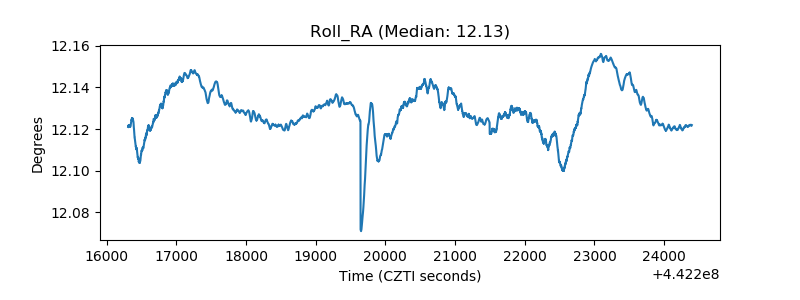 |
| Veto Counter | 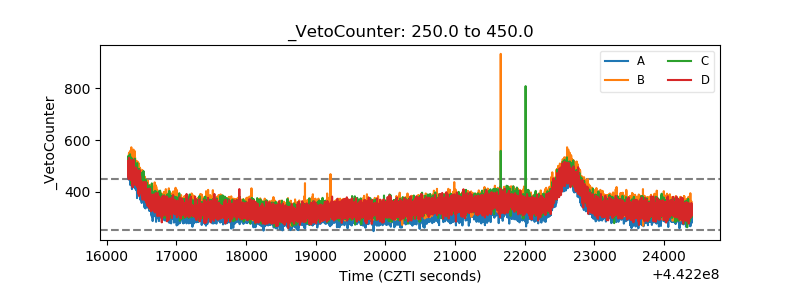 |